AceTraderFx: Weekly/Daily Technical Outlook & Trading Ideals on USD/CHF

acetraderfx

AceTrader.com Representative
Messages
1,109
WEEKLY USD/CHF TECHNICAL OUTLOOK
Last Update At 29 Sep 2014 00:12GMT

Trend Daily Chart
Up

Daily Indicators
Rising

21 HR EMA
0.9503

55 HR EMA
0.9479

Trend Hourly Chart
Up

Hourly Indicators
Bearish divergences

13 HR RSI
70

14 HR DMI
+ve

Daily Analysis
Resumption of MT uptrend

Resistance
0.9620 - 100% proj. fo 0.9353-0.9515 fm 0.457
0.9599 - 70.7% r of 0.9972-0.8698
0.9567 - Mar 2013 top

Support
0.9484 - Last Fri's European high (now sup)
0.9457 - Last Thur's NY low
0.9433 - Sep 167 high (now sup)


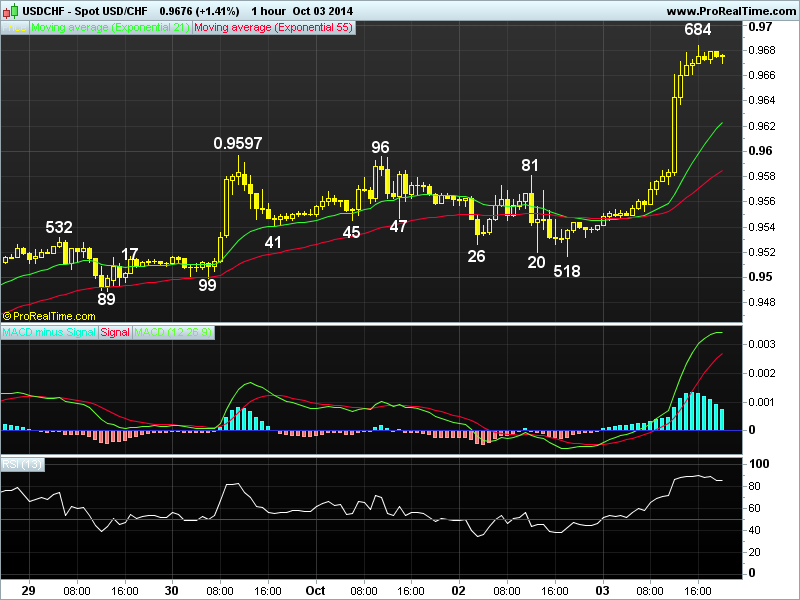
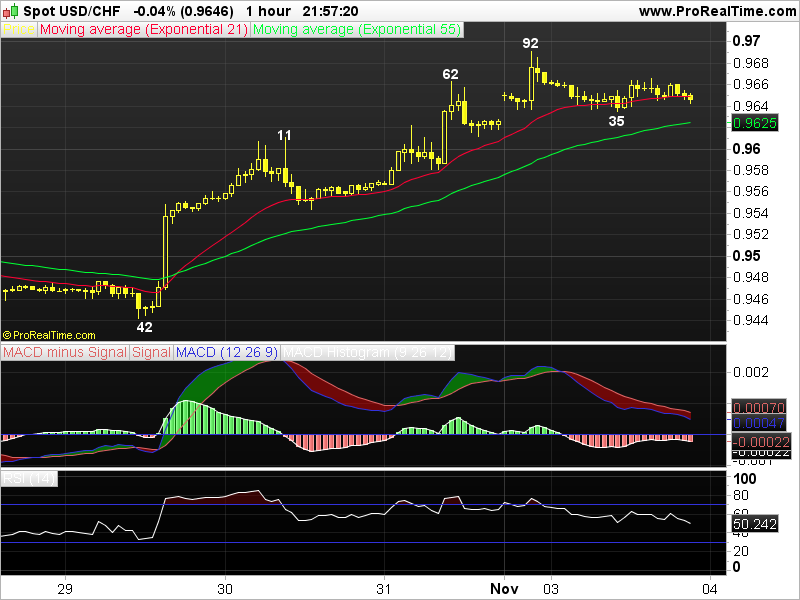
. USD/CHF - 0.9517... Dlr continued its recent winning streak last week after meeting renewed buying at 0.8353 on Tue, price climbed to a fresh 1-year peak of 0.9522 in Fri's NY session due to broad-based rally in the dlr.

. Looking at the bigger picture 1st, dlr's aforesaid gain to 0.9522 Fri confirms the 3-legged rise fm Mar's 2-1/2 year trough at 0.8698 to at least retracing MT fall fm 0.9972 (2012 peak) remains in progress n gain to 0.9599 is now envisaged, being 70.7% r of this move, however, as hourly indicators have displayed 'bearish divergences', reckon 0.9620 (equality measurement of 0.9353-0.9515 measured fm 0.9457) wud cap upside ahead of Fri's important U.S. payrolls report n yield a minor correction. Therefore, whilst buying on dips is the way to go, profit shud be taken on next upmove. On the downside, a daily close below 0.9457 wud be the 1st signal temporary top is in place n risk stronger retracement to 0.9389 but sup at 0.9332 shud remain intact.

. Today, as current price is trading abv the 21-hr & 55-hr emas, buying dlr on dips is recommended, however, reckon 0.9599 wud cap upside. Below 0.8457 wud abort present bullish scenario n risk retracement to 0.9433, 0.9407/10.

CHF%20sep%2029.png
 
Last edited by a moderator:
AceTraderFx Oct 6: Weekly Technical Outlook & Trading Ideals on USD/CHF

WEEKLY USD/CHF TECHNICAL OUTLOOK
Last Update At 06 Oct 2014 00:07GMT

Trend Daily Chart
Up

Daily Indicators
Overbought

21 HR EMA
0.9623

55 HR EMA
0.9585

Trend Hourly Chart
Up

Hourly Indicators
Overbought

13 HR RSI
85

14 HR DMI
+ve

Daily Analysis
Resumption of MT uptrend

Resistance
0.9814 - 100% proj. of 0.9301-0.9597 fm 0.9518
0.9745 - 2.618 times ext. of 0.8698-0.9037 fm 0.8857
0.9701 - 61.8% proj. of 0.9301-0.9597 fm 0.9518

Support
0.9637 - Hourly chart
0.9597 - Last Tue's high (now sup)
0.9581 - Last Thur's johj ( now sup)

. USD/CHF - 0.9676... Although dlr resumed its recent uptrend to a fresh 1-year high of 0.9597 last Tue, broad-based profit taking in the greenback pushed back down to 0.9518 Thur b4 rallying again to fresh 2014 peak of 0.9684 on Fri due to robust U.S. jobs data together wuth buying in eur/chf cross.

. Fri's gain to 0.9684 confirms the 3-legged MT upmove fm Mar's 2-1/2 year trough at 0.8698 remains in progress. Looking at the bigger picture, dlr's said strg rise fm 0.8698 confirms correction fm 2012 peak at 0.9972 has ended n dlr is en route twd there later this month. Current rising daily technical indicators suggest gain to 0.9745 wud be seen next, this is 2.618 times extension of intermediate rise fm 0.8698-0.9037 measured fm 0.8857, o/bot readings on the daily oscillators wud prevent strg gain n reckon pivotal res at 0.9839 (2013 top in May)) wud hold on 1st testing. Therefore, buying dlr on dips is the way to go n only a daily close below 0.9489 wud signal temporary top is in place.

. Today, dlr briefly climbed to 0.9690 in NZ but has retreated. As current price is trading abv the 21-hr & 55-hr emas, buying on dips is favoured but upside is ltd to 0.9745. Below 0.9597 wud be the 1st signal a minor top is made.
CHFoct%2006.png
 
Last edited by a moderator:
AceTraderFx Oct 9: Daily Technical Outlook & Trading Ideals on USD/CHF

DAILY USD/CHF TECHNICAL OUTLOOK
Last Update At 09 Oct 2014 00:44GMT

Trend Daily Chart
Up

Daily Indicators
Turning down

21 HR EMA
0.9545

55 HR EMA
0.9571

Trend Hourly Chart
Near term down

Hourly Indicators
Falling

13 HR RSI
35

14 HR DMI
-ve

Daily Analysis
Consolidation with downside bias

Resistance
0.9624 - Tue's high
0.9601 - Y'day's high
0.9555 - Tue's low (now res)

Support
0.9504 - Intra-day low
0.9489 - Last Mon's low
0.9433 - Sep 17 high (now sup)

. USD/CHF - 0.9527... Despite y'day's intra-day swings in Asian & European sessions inside a 0.9556-0.9601 range following previous day's decline to 0.9555, the pair tumbled after release of dovish Fed minutes, price fell to 0.9510 due to dlr's broad-based weakness n then hit an intra-day low of 0.9504 in Asia.

. Looking at the hourly n daily charts, y'day's break of 0.9555 suggests further choppy trading below Mon's fresh 1-year peak at 0.9690 wud continue with downside bias n further weakness to 0.9496 is now envisaged, this is the natural 50% r of intermediate rise fm 0.9301 to 0.9690, a daily close below there wud bring stronger correction twd 0.9436 n possibly twd 0.9357, being 38.2% n 50% r respectively of 0.9024-0.8960. In view of abv analysis, selling dlr on recovery in anticipation of further decline is favoured as only abv 0.9601 (y'day's top) wud signal 1st leg of correction is over, however, reckon 0.9630/40 wud cap upside n yield another leg of decline next week.

. Today, we've exited previous short position after intra-day recovery fm 0.9504 (Australia) n wud sell again on minor recovery as 0.9555 (prev. sup, now res) wud cap present rebound n yield decline to 0.9470/75.
CHF%20oct%2009.png
 
Last edited by a moderator:
AceTraderFx Oct 14: Daily Technical Outlook & Trading Ideals on USD/CHF

DAILY USD/CHF TECHNICAL OUTLOOK
Last Update At 14 Oct 2014 00:33GMT

Trend Daily Chart
Up

Daily Indicators
Turning down

21 HR EMA
0.9519

55 HR EMA
0.9534

Trend Hourly Chart
Near term down

Hourly Indicators
Rising fm o/s

13 HR RSI
41

14 HR DMI
-ve

Daily Analysis
Choppy consolidation to continue

Resistance
0.9624 - Last Tue's high
0.9593 - Last Fri's high
0.9552 - Y'day's European high

Support
0.9469 - Intra-day low in Australia
0.9433 - Sep 17 high (now sup)
0.9357 - 50% of 0.9024-0.9690

. USD/CHF - 0.9504... Although dlr came under broad-based selling pressure in NZ y'day n fell sharply to 0.9520 in Asian morning, price staged a recovery to 0.9552 in early European morning. However, price again fell to session low of at 0.9512 in N. American morning b4 tanking briefly but sharply to 0.9469 today.
. Looking at the hourly chart, y'day's strg retreat suggests the recovery fm last Wed's low at 0.9470 has ended at 0.9593 last Fri n consolidation with downside bias wud be seen for a re-test of aforesaid sup, a firm break there wud confirm the corrective decline fm last Mon's fresh 1-year high at 0.9690 has resumed n extend weakness twd 0.9433. Having said that, 'bullish convergences' on the hourly oscillators' readings shud prevent steep fall below said lvl n reckon 0.9357 (50% of 0.9024-0.9690) wud hold this week n yield recovery. On the upside, only abv 0.9624 wud confirm the correction fm 0.9690 has ended n yield re-test of abovementioned lvl.

. Today, despite intra-day brief break of y'day's 0.9512 low to a 2-week trough of 0.9469 in Aust., as price has rebounded at Asian open, abv 0.9539 signals temp. low is amde n yield agin twd 0.9593.

CHF%20oct%2014.png
 
Last edited by a moderator:
AceTraderFx Oct 20: Weekly Technical Outlook & Trading Ideals on USD/CHF

WEEKLY USD/CHF TECHNICAL OUTLOOK
Last Update At 20 Oct 2014 00:03GMT

Trend Daily Chart
Sideways

Daily Indicators
Turning down

21 HR EMA
0.9455

55 HR EMA
0.9454

Trend Hourly Chart
Sideways

Hourly Indicators
Rising

13 HR RSI
58

14 HR DMI
+ve

Daily Analysis
Consolidation with upside bias

Resistance
0.9563 - Wed's high
0.9525 - 50% r of 0.9690-0.9360
0.9491 - Last Thur's high

Support
0.9405 - Last Thur's low
0.9360 - Last Wed's fresh 3-week low
0.9301 - Sep 16 low

. USD/CHF - 0.9469...The greenback also swung wildly in opposite direction to euro last week. Despite initial weakness to 0.9469 on Mon, price recovered to 0.9563 Wed but only to tank to a near 3-week trough of 0.9360 after downbeat US retail sales, price later bounced back to 0.9491 Thur n moved sideways on Fri.

. Let's look at daily picture 1st, dlr's erratic decline fm Oct's fresh 1-year peak at 0.9670 n then last week's breach of 0.9470 sup to 0.9360 confirms MT rise fm 2014 near 2-1/2 year trough at 0.8698 (Mar) has indeed formed a tempo rary top at 0.9690 n consolidation with downside bias is seen for further weakness to 0.9311, this is a 'minimum' 38.2% r of aforesaid upmove fm 0.8698, a daily close below daily sup at 0.9301 is needed to bring stronger correction twd 0.9194 (50% r). As daily technical are turning down, suggesting consolidation with downside bias is in store this week. On the upside, only a daily clsoe abv0.9563 (last week's high on Wed) wud dampen present bearish bias on dlr.

. Today, dlr's erratic rise fm 0.9360 to 0.9491 signals 1st leg of said correction fm 0.9690 has ended, abv 0.9491 wud add credence to this view n bring stronger gain to 0.9525 (50% r) but res at 0.9563 shud cap upside.
CHF%20oct%2020.png
 
Last edited by a moderator:
AceTraderFx Oct 29: Daily Technical Outlook & Trading Ideals on USD/CHF

DAILY USD/CHF TECHNICAL OUTLOOK
Last Update At 29 Oct 2014 00:17GMT

Trend Daily Chart
Sideways

Daily Indicators
Neutral

21 HR EMA
0.9477

55 HR EMA
0.9490

Trend Hourly Chart
Near term down

Hourly Indicators
Rising fm o/s

13 HR RSI
38

14 HR DMI
-ve

Daily Analysis
Consolidation with a neutral bias

Resistance
0.9593 - Oct 10 high
0.9559 - Last Wed's high
0.9521 - Y'day's high

Support
0.9446 - Y'day's low
0.9398 - Last Tue's low
0.9360 - Oct 15 low

. USD/CHF - 0.9468... Dlr went through a roller-coaster session on Tue as despite initial rise to rebound to 0.9511 in European morning, price tumbled to session low of 0.9446 in NY morning after weak U.S. durable goods data. Dlr briefly bounced to 0.9481 on upbeat U.S. consumer confidence b4 stabilising.

. Looking at the hourly n daily charts, y'day's weakness to 0.9446 suggests the recovery fm Oct's low at 0.9360 has possibly ended at 0.9559 last Wed n choppy trading with mild downside bias wud be seen for marginal fall. On the bigger picture, as dlr's rally fm 0.9360 to 0.9559 suggests the 1st leg of correction fm Oct's 1-year peak at 0.9690 has ended there, reckon sup 0.9436, being the 'dynamic' 61.8% r shud remain intact n yield another rebound later. Abv 0.9521 wud indicate the pullback fm 0.9559 has ended n retain bullishness for a retest of said res, break, wud extend marginally but daily res at 0.9693 shud hold this week.

. Today, we are holding a long position entered y'day for recovery to 0.9225 n only below 0.9436 wud abort intra-day bullishness n risk further weakness to 0.9398, break wud confirm recovery fm 0.9360 has ended, 0.9360 later.
CHF%20OCT%20%2029.png
 
Last edited by a moderator:
AceTraderFx Nov 4: Daily Technical Outlook & Trading Ideals on USD/CHF

DAILY USD/CHF TECHNICAL OUTLOOK
Last Update At 04 Nov 2014 01:10GMT

Trend Daily Chart
Up

Daily Indicators
Neutral

21 HR EMA
0.9648

55 HR EMA
0.9625

Trend Hourly Chart
Up

Hourly Indicators
Turning down

13 HR RSI
50

14 HR DMI
+ve

Daily Analysis
Consolidation b4 marginal rise

Resistance
0.9800 - Psychological lvl
0.9745 - 2.618 times ext. of 0.8698-0.9037 fm 0.8857
0.9692 - Y'day's fresh 1-year peak

Support
0.9612 - Fri's NY low
0.9581 - Fri's European low
0.9544 - Last Thur's NY low

. USD/CHF - 0.9645... Although the greenback opened higher in NZ on Mon due to dlr's broad-based strength n rose briefly to a fresh 1-year peak at 0.9692 at Asian open, price pared its gains n retreated to session low at 0.9635 in NY morning on poor U.S. mfg PMI b4 moving sideways in NY afternoon.

. Looking at the hourly n daily charts, y'day's breach of Oct's 1-year peak at 0.9690 signals the 3-legged upmove fm Mar's 2-1/2 year trough at 0.8698 has once again resumed n consolidation with upside bias wud be seen for gain twds 0.9722, being the 61.8% projection of 0.9104-0.9690 measured fm 0.9360.
Having said that, sharp move beyond there is unlikely to be seen due to loss of momentum n reckon res 0.9745/49 (2.618 times extension of 0.8698-0.9037 fm 0.8857 n equality of 0.9301-0.9690 measured fm 0.9360 respectively) shud remain intact n yield a much-needed correction later this week. On the downside, below sup 0.9581 (Fri's NY low) wud indicate a temp. top has been made n stronger retracement twds 0.9544 wud follow.

. Today, we are looking to trade fm both sides of the market n will buy dlr on dips to 0.9615 or wud sell if price climbs marginally to 0.9710 1st.
chf%285%29.png
 
Last edited by a moderator:
AceTraderFx Nov 11: Daily Technical Outlook & Trading Ideals on USD/CHF

DAILY USD/CHF TECHNICAL OUTLOOK
Last Update At 11 Nov 2014 00:34GMT

Trend Daily Chart
Up

Daily Indicators
Bearish divergences

21 HR EMA
0.9668

55 HR EMA
0.967

Trend Hourly Chart
Sideways

Hourly Indicators
Rising

13 HR RSI
60

14 HR DMI
+ve

Daily Analysis
Consolidation with upside bias

Resistance
0.9772 - 61.8% proj. of 0.9024-0.9690 fm 0.9360
0.9742 - Last Fri's fresh 1-year peak
0.9705 - Last Fri's Euroepan morning low

Support
0.9617 - Y'day's low
0.960 - Last Thur's low
0.9580 - Last week's low (Tue)

. USD/CHF - 0.9680... Although the greenback opened lower to 0.9632 in NZ on Mon, price staged a recovery to 0.9659 at Asian open, renewed selling there knocked price to session low at 0.9617 in European morning. However, the pair rebounded strongly to 0.9684 in NY session due to broad-based strength in usd.

. Let's look at the hourly n daily charts, y'day's rebound fm 0.9617 suggests the pullback fm last Fri's fresh 1-year peak at 0.9742 has ended there n consolidation with initial upside bias remains, abv 0.9705/10 wud signal pull back is over n bring gain twd 0.9742, break there wud extend the 3-legged up move fm Mar's 2-1/2 year trough at 0.8698 twd projected target at 0.9772 (being 61.8% projection of 0.9024-0.9690 fm 0.9360). However, as hourly indicators wud display 'prominent' bearish divergences on such move, strg rise abv there is not envisaged n recon 0.9800/10 wud hold fm here n bring correction.

. Today, in view of abv analysis, we're standing aside initially n wud buy dlr on dips once 0.9705/10 res is penetrated. On the downside, we will sell dlr on recovery is price drops back below 0.9632 n such move wud indicate rebound is over, the weakness to 0.8580 wud follow, break 0.9455/60.
CHF%20nov%2011.png
 
Last edited by a moderator:
AceTraderFx Nov 18: Daily Technical Outlook & Trading Ideals on USD/CHF

DAILY USD/CHF TECHNICAL OUTLOOK
Last Update At 18 Nov 2014 00:15GMT

Trend Daily Chart
Up

Daily Indicators
Bearish divergences


21 HR EMA
0.9633

55 HR EMA
0.9629

Trend Hourly Chart
Near term up

Hourly Indicators
Rising

13 HR RSI
62

14 HR DMI
+ve

Daily Analysis
Consolidation with upside bias

Resistance
0.9742 - Nov's fresh 1-year peak
0.9700 - Last Tue's high
0.9689 - Last Fri's high

Support
0.9574 - Last Fri's low
0.9553 - Y'day's low
0.9511 - Oct 28 high (now sup)

. USD/CHF - 0.9646... Despite a brief recovery to 0.9601 in Australia on Mon, intra-day sell off in dlr/yen led to broad-based usd's weakness n pressured price to 0.9553 in Asian morning. However, dlr quickly pared its losses n rose to 0.9624 in Europe n then to session high of 0.9652 in NY morning.

. Looking at the hourly n daily charts, despite y'day's retreat to 0.9553, subsequent strg rebound suggests the 1st leg of correction fm Nov's fresh 1-year peak at 0.9742 has ended there n consolidation with upside bias wud be seen. Abv res 0.9689 (last Fri's high) wud add credence to this view n extend gain to 0.9700 (last Tue's top), however, aforesaid peak may hold initially n yield more choppy consolidation. On the downside, only below 0.9553 wud indicate the corrective decline fm 0.9742 has resumed instead n turn outlook bearish for further weakness twds 0.9511 (prev. res, now sup).

. Today, in view of near term bullish bias, we are buying dlr on dips for gain to 0.9700 n only below 0.9574 (Fri's low) wud indicate recovery fm y'day's low at 0.9553 has ended n risk re-test of this lvl later.
CHF%20nov%2018%281%29.png
 
Last edited by a moderator:
Back
Top