AceTraderFx April 9: Daily Technical Outlook on Major –USD/CHF

acetraderfx

AceTrader.com Representative
Messages
1,109
DAILY USD/CHF TECHNICAL OUTLOOK
Last Update At 09 Apr 2014 00:38GMT

Trend Daily Chart
Sideways

Daily Indicators
Turning down

21 HR EMA
0.8448

55 HR EMA
0.8468

Trend Hourly Chart
Down

Hourly Indicators
Rising fm o/s

13 HR RSI
39

14 HR DMI
-ve

Daily Analysis
Minor recovery b4 one more fall

Resistance
0.8953 - Last Fri's high
0.8905 - Last Fri's low
0.8880 - Y'day's high

Support
0.8826 - Y'day's low
0.8815 - Last Tue's low
0.8788 - Mar 24 low

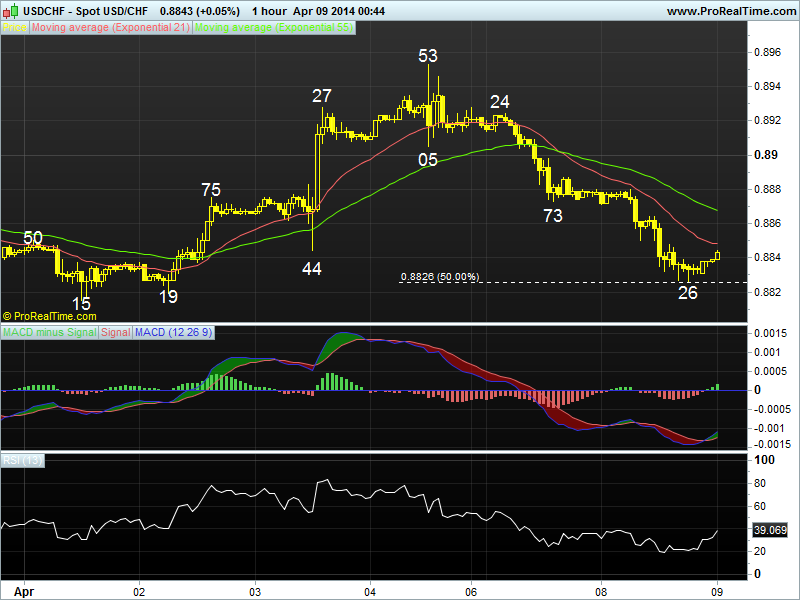
. USD/CHF - 0.8843... The pair tracked intra-day moves in eur/usd closely y'day. Despite initial narrow trading in Asia, intra-day rally in euro due to broad-based usd's weakness together with selling in eur/chf cross at London open knocked price lower, dlr tanked fm 0.8880 (European high) to 0.8826 in NY.

. Let's look at the daily picture 1st, y'day's selloff to 0.8826, which is exactly 50% r of the recent erratic rise fm Mar's fresh 2-year trough at 0.8698 to 0.8953 confirms the 1st leg of correction has ended n as price is currenly trading below the 21-hr & 55-hr emas, suggesting downside bias remains for further weakness to the 'dynamic' 61.8% r objective at 0.8795, however, a daily close below daily sup at 0.8788 is needed to signal aforesaid correction fm 0.8698 has ended, then dlr wud ratchet lower twd 0.8698 later this month. On the upside, a move back abv 0.8905 anytime wud turn outlook bullish for re-test of 0.8953.

. Today, in view of abv analysis, selling dlr on recovery is the way to go but profit shud be taken on decline as 0.8788 sup is expected to hold on 1st testing n risk is seen for a rebound to take place later today or tomorrow.

chf%20t%2822%29.png
 
Last edited by a moderator:
AceTraderFx Apr 15: Daily Technical Outlook on Major – USD/CHF

DAILY USD/CHF TECHNICAL OUTLOOK
Last Update At 15 Apr 2014 00:09GMT

Trend Daily Chart
Sideways

Daily Indicators
Falling

21 HR EMA
0.8790

55 HR EMA
0.8785

Trend Hourly Chart
Sideways

Hourly Indicators
Rising

13 HR RSI
63

14 HR DMI
+ve

Daily Analysis
Initial recovery b4 retreat

Resistance
0.8899 - Mar 28 high
0.8846 - Last Wed's high
0.8806 - Y'day's high 0.8743 -

Support
Last Fri's 3-week low
0.8698 - Mar 13 low
0.8665 - 61.8% proj. of 0.9839-0.8891 fm 0.9251


. USD/CHF - 0.8804... The greenback rose to 0.8784 in NZ due to the gap-down open in euro n continued to strengthen in European session. Price climbed to session high of 0.8806 at NY open after the release of stronger-than-expected U.S. retail sales. Dlr eased to 0.8782 at European closing b4 rebounding.

. Looking at the hourly n daily charts, although Fri's rebound fm 0.8743
suggests MT downtrend fm 2012 peak at 0.9972 is not ready to resume yet n choppy trading abv Mar's fresh 2-year trough at 0.8698 wud continue, as dlr's sell off fm 0.8953 (Apr 6 high) to 0.8743 confirms the 1st leg of correction has ended, reckon 0.8846 wud limit upside n bring another fall. Below said 0.8743 low wud retain bearishness for a re-test of 0.8698 later this week, break wud confirm aforesaid decline has resumed n extend weakness to 0.8665 (61.8% projection of 0.9839-0.8891 measured fm 0.9251).

. Today, in view of abv analysis, we are looking to sell dlr on intra-day
gain for subsequent strong retreat but 0.8743 shud hold. On the upside, abv
0.8846 wud indicate pullback fm 0.8953 has ended instead n turn outlook bullish for gain to 0.8899. However, res 0.8953 shud remain intact.

CHF%20apr%2015.png
 
Last edited by a moderator:
AceTraderFx May2: Daily Technical Outlook on USD/CHF

Daily Technical Outlook on USD/CHF
DAILY USD/CHF TECHNICAL OUTLOOK
Last Update At 01 May 2014 23:53GMT

Trend Daily Chart
Sideways

Daily Indicators
Neutral

21 HR EMA

0.8795

55 HR EMA

0.8802

Trend Hourly Chart
Near term down

Hourly Indicators
Turning up

13 HR RSI
43

14 HR DMI
-ve

Daily Analysis
Consolidation with downside bias

Resistance
0.8905 - Apr 04 low (now res)
0.8862 - Last Tue's high
0.8851 - Wed's high

Support
0.8771 - Mon's low
0.8743 - Apr 11 3-week low
0.8698 - Mar 13 (2014 low )


. USD/CHF - 0.8792 ... Despite extending decline fm Wed's 0.8851 high in thin European open y'day due to intra-day rise in the eur/usd, dlr touched sessions low of 0.8783 at NY open, broad-based recovery in the greenback lifted the pair to 0.8801 b4 moving narrowly in quiet NY afternoon.

. Looking at the hourly & daily charts, dlr's retreat fm 0.8851 suggests
'choppy' trading below last Tue's high at 0.8862 wud continue with downside bias but below Mon's 0.8771 low is needed to confirm early recovery fm Apr's 3-week trough at 0.8743 has ended there, then re-test of said sup wud follow, a break there wud indicate MT downtrend fm 2012 peak at 0.9972 has possibly resumed n extend weakness twd Mar's 2-year trough at 0.8698 next week. On the upside, only daily close abv 0.8862 wud signal the pullback fm Apr's high at 0.8953 has end ed at 0.8743 instead n turn outlook bullish for subsequent gain to 0.8880 (Apr 08 high) but res at 0.8953 (Apr's high) shud limit upside.

. Today, traders are keeping their powder dry ahead of release of the U.S. jobs data n selling on intra-day recovery is favoured. In case dlr rises on strg payrolls n penetrates 0.8862 res, risk is seen for gain twd 0.8905/10.

CHFmay%2002.png
 
Last edited by a moderator:
AceTraderFx Jun 11: Daily Technical Outlook & Trading Ideals on USD/CHF

DAILY USD/CHF TECHNICAL OUTLOOK

Last Update At 11 Jun 2014 00:06GMT

Trend Daily Chart
Sideways

Daily Indicators
Bearish divergences

21 HR EMA
0.8990

55 HR EMA
0.8975

Trend Hourly Chart
Near term up

Hourly Indicators
Turning down

13 HR RSI
62

14 HR DMI
+ve

Daily Analysis
Consolidation with upside bias

Resistance
0.9082 - Feb 03 high
0.9037 - Last Thur's high
0.9008 - Y'day's high

Support
0.8965 - Y'day's low
0.8920 - Mon's low
0.8908 - Last Thur's low


. USD/CHF - 0.8997 ... Although the greenback traded in a narrow range in Asia y'day, renewed buying emerged at 0.8964 at European open n price rallied to session high of 0.9008 at European midday. However, dlr pared some of its gains n retreated to 0.8989 at NY open b4 moving sideways in subdued NY session.

. Looking at the hourly chart, y'day's rebound to 0.9008 suggests pullback fm last Thur's 3-1/2 month high at 0.9037 has ended at 0.8908 (Thur NY low) n consolidation with upside bias remains for erratic rise fm Mar's 2-year trough at 0.8698 to resume n yield re-test of aforesaid top. Abv wud retain bullishness for further gain to 0.9076/82, being the 'natural' 50% r of MT decline fm 0.9455 (2013 Sep peak) n Feb 03 high respectively, however, as hourly oscillators wud display 'bearish divergences' on such move, strg gain abv there is unlikely to be seen n risk wud increase for a much-needed correction later this week.

. Today, in view of abv analysis, we are buying dlr on intra-day retreat for a re-test of 0.9037 1st n only below Mon's low at 0.8920 wud indicate a temporary top has been made n turn outlook bearish for a stronger correction to 0.8908 but sup 0.8883 shud remain intact n yield subsequent rebound.

CHF%20jun%2011.png
 
Last edited by a moderator:
Back
Top