American Stock Exchange

cac40 link.png

Against the backdrop of the start of the corporate reporting period, corporate news comes to the fore for stock indices. ArcelorMittal SA announced that it intends to acquire a majority stake in the Austrian steel company Voestalpine AG. The preliminary amount of the deal is estimated at 1 billion dollars. The day before, Hermes International SA published its financial results, according to which the quarterly revenue exceeded 3.10 billion euros, and the growth compared to the previous quarter was 33%, thanks to an increase in sales in all segments.

The rally that began in the French bond market in March of this year is continuing now, with popular 10-year bonds yielding 1.334%, up from 0.350% in early March, and conservative 20-year bonds hitting 1.628%, the last time observed at the beginning of 2017.

cac.png


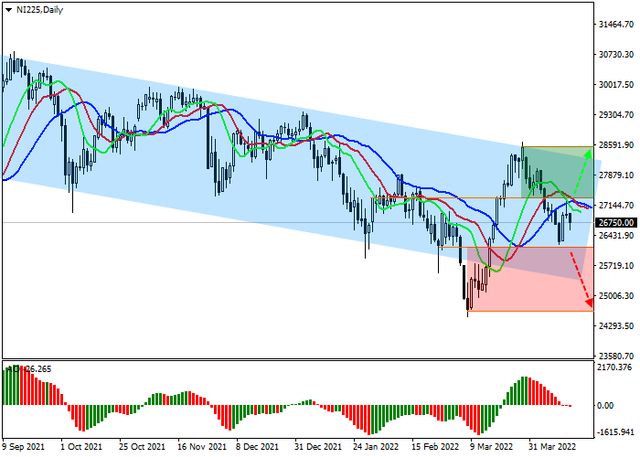
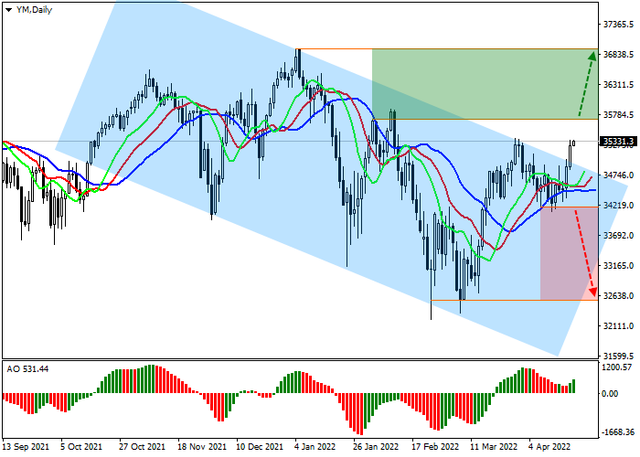
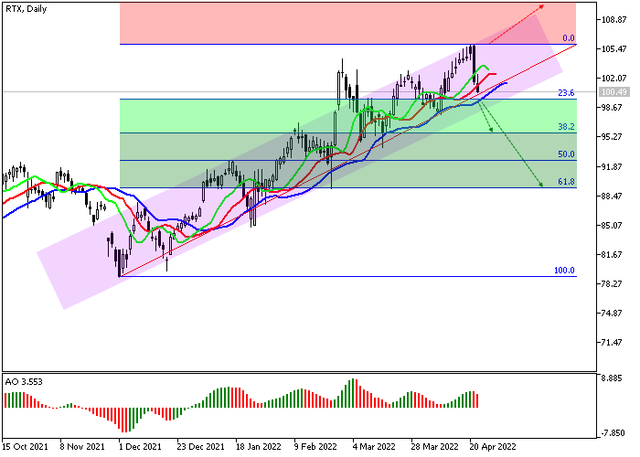
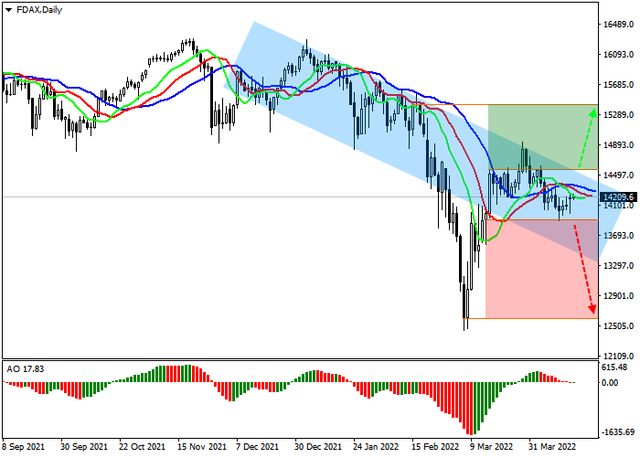
The quotes of the asset are traded as part of a global downtrend, rising in the direction of the resistance line. Technical indicators are holding a local buy signal: the range of EMA fluctuations on the Alligator indicator is about to start expanding in the direction of growth, and the histogram of the AO oscillator is trading in the purchase zone while forming local ascending bars.

Support levels: 6420, 5880 | Resistance levels: 6800, 7150​
 
1.png


The corporate reporting period in Japan started with the publication of financial results of real estate companies. So, the investment company Daiwa House REIT Investment Corp., Ltd. showed quite strong results: revenue was recorded at around 30.26B yen, surpassing 29.57B yen in the previous quarter. In turn, Mitsubishi Estate Logistics REIT Investment Corp. reported revenue of 5.03B yen, which was also higher than the 4.95B yen shown in the previous quarter. LaSalle Logiport REIT showed revenue of 10.59B yen, which was better than the projected 10.55B yen.

In the domestic bond market, the situation began to stabilize after the global downtrend changed last week. Thus, the yield on 10-year Japanese treasuries lost 1.26% relative to Friday's close, while conservative 20-year bonds rose by 2.19%, and global 30-year bonds — by 3.11%.

n.png


On the global chart of the asset, the price remains within a wide descending channel, moving in the direction of the resistance line. Technical indicators are in a state of uncertainty: the histogram of the AO oscillator is close to the transition level, forming descending bars, and the fast EMAs on the alligator indicator are below the signal line.

Support levels: 26175, 24681 | Resistance levels: 27386, 28506​
 
snap-forum-1.png


The shares of Snap Inc, the US company that owns the Snapchat messenger, are trading at 32.

On the daily chart of the asset, a global downtrend continues to form, at the lows of which the price is clamped inside the Triangle pattern. There is not much time left before the figure's implementation, and if the quotes break the February low of 28, the downward scenario will receive the necessary confirmation.

snap.png


The four-hour chart shows that a full-fledged correction has not yet begun, as the instrument has not consolidated above the initial Fibonacci 23.6% correction level of 41. At the moment, the upward dynamics seem unlikely since technical indicators confirm the increased activity of the "bears": fast EMAs on the Alligator indicator crossed the signal line downwards, and the AO oscillator histogram consolidated below the transition level, continuing to form downward bars.​
 
dax-link.png


The stock markets of the EU countries continue to trade in a local downtrend against the background of the reduction by the World Bank of the world economic growth forecast for 2022 to 3.2%. The main reasons for the correction of the indicator are losses caused by the development of the military conflict in Ukraine, quarantine restrictions due to the spread of the coronavirus pandemic, as well as a significant increase in inflation. These factors can lead to an increase in the level of poverty in the world due to sudden spikes in prices for energy, fertilizers and food, and the policy of adjusting interest rates is likely to exacerbate the inequality of residents of different territories. The previous forecast for global GDP growth was 4.1%, but due to the situation in Ukraine, it was also lowered. Meanwhile, the estimated global economy in 2021 grew by 5.5%, showing the highest post-recession pace in 80 years.

At the moment, the situation in the German domestic bond market is coming to the fore again, where growth continues. Thus, 10-year debt stocks reached a yield of 0.9240%, despite the fact that at the beginning of the month it was only 0.5170%. In turn, the yield of conservative 20-year bonds exceeded the 1% mark for the first time since 2018, and is now at 1.014%, having risen from 0.556% at the beginning of the month.

dax30.png


On the global chart of the asset, the price is trading as part of a correction to the previous decline. Technical indicators are reversing again, and are ready to issue a signal to start purchases: the range of EMA fluctuations on the alligator indicator is actively narrowing, and the histogram of the AO oscillator has moved into the buying zone, forming the first ascending bar.

Support levels: 13883, 12600 | Resistance levels: 14550, 15420​
 
1.png


On the daily chart, the first wave of the higher level (1) of C formed, and a correction developed as the second wave (2) of C. Now, the wave C of (2) has formed and the development of the wave (3) has started, within which the first wave of the lower level 1 of (3) is forming.

If the assumption is correct, the price will grow to the levels of 242.7 - 260. In this scenario, critical stop loss level is 173.09.

ba.png
 
ym-1.png


The Dow Jones is correcting upwards and is trading at 35330.

The first week of corporate reporting showed that investors are redirecting their capital from the communications sector to the real one after companies in this segment began to publish disappointing financial results one after another. The day before, Netflix Inc. lost more than 35% of value after the company announced a possible decrease in the number of active subscribers by 2 million earlier this year.

In turn, the reports of Tesla Inc. and Procter & Gamble Co. supported the market. Electric car manufacturer Tesla Inc. reported revenue of 18.76 billion dollars, up from 17.72 billion dollars a quarter earlier, and EPS hit 3.22 dollars for the first time in history. Industrial group Procter & Gamble Co. also posted quarterly revenue growth of 19.38 billion dollars versus a forecast of 18.72 billion dollars, with earnings per share of 1.33 dollars, higher than the expected 1.3 dollars.

ym.png


The index quotes made an attempt to overcome the resistance line and leave the long downward channel. Technical indicators issued a new buy signal: fast EMAs of the Alligator indicator began to actively expand the range of fluctuations in the direction of growth, and the histogram of the AO oscillator is forming new rising bars.

Support levels: 34150, 32560 | Resistance levels: 35680, 36930​
 
amx-1.png


On the daily chart, the fifth wave of the higher level (5) develops, within which the wave 3 of (5) formed, and the fourth wave 4 of (5) develops. Now, the wave a of 4 has formed, the wave b of 4 has ended, and the development of wave c of 4 has started, within which the wave of the lower level (ii) of c is ending.

If the assumption is correct, the price will fall to the levels of 144.62 - 131.35. In this scenario, critical stop loss level is 194.7.

axp.png
 
ebay-1.png


The shares of eBay Inc., an American online retailer, are correcting upwards of around 55.

On the daily chart of the asset, a narrow downward channel has developed. Currently, the price is approaching the range resistance line passed earlier to retest it. Despite exiting the channel, the rate is still below the initial 23.6% Fibonacci retracement at 57.00, which is a prerequisite for starting an upward correction.

On the four-hour chart of the asset, the first signs of future growth begin to appear, and if it consolidates above the initial correction of 23.6% around $57, two trend development scenarios are relevant. The first and most likely one is reaching the 38.2% Fibonacci base correction level at $62 The second scenario assumes a fully formed correction, reaching the 61.8% full correction level at 69.

ebay.png
 
starbucks.png
[/JUSTIFY]

The shares of Starbucks Corp., one of the world's largest coffee companies, are in a corrective trend at around $79.

On the daily chart of the asset, a global downward channel is forming, within which another wave of decline is developing, reaching the year's low at $.79 yesterday.

On the 4-hour chart, this low is the latest support for the price to the 61.8% initial trend level in a Fibonacci extension at 69.00. After consolidation below it, an additional target is relevant, located at the basic trend of 100.0% for the Fibonacci extension around $54, but so far, such a movement seems unlikely, and it is better to focus on the first target. The indicator readings also evidence it: fast EMAs on the Alligator indicator remain below the signal line, and the AO oscillator histogram forms local correctional bars in the sell zone.

sbux.png
 
rtx-3.png


Raytheon Technologies Corporation is an American multinational aerospace and defense conglomerate headquartered in Waltham, Massachusetts. It is one of the largest aerospace, intelligence services providers, and defense manufacturers in the world by revenue and market capitalization.

rtx-2.png


The shares of Raytheon Technologies Corp., one of the largest US financial and industrial groups, are moving within a stable corrective trend near the level of 100.

On the daily chart, a narrow ascending channel is forming, within which the price once again failed to consolidate above the resistance line around 106 and returned to the channel, dropping to the support line at 99, coinciding with the initial correction level of 23.6% Fibonacci. The beginning of a global downward correction is possible only after the consolidation below the level.

Technical indicators signal the presence of a stable buy signal but do not rule out a downward correction: fast EMAs on the Alligator indicator are approaching the signal line, and the AO oscillator histogram is forming downward bars in the buying zone.

rtx-1.png
 
Back
Top