American Stock Exchange

ge-2.png


General Electric Co. stocks continue to trade within the mid-term downward channel. Over the past two weeks, the price has attempted to grow and reached 93.74, but then corrected downwards against the background of the statement by the head of the US Fed Jerome Powell about the need for a sharp adjustment of interest rates already at the May meeting of the regulator.

The growth of quotations of the trading instrument may resume if positive financial statements on activities for Q1 2022 are published on Tuesday. It should be noted that during the last four reporting quarters, management reported higher profits than experts expected. Positive dynamics is also possible in Q1 2022, as efforts to reduce the volume of debts, reduce costs and benefits from previously acquired assets will affect financial indicators. According to the estimates of the analytical company Zacks Investment Research, the income of General Electric Co. in the healthcare sector, may amount to 4,206B dollars, which is 2.4% less than the same indicator last year. The profit of the aviation sector may reach 5.896B dollars, which is 18.1% more than in the same period last year. Total earnings per share may amount to 0.23 dollars, and total revenue – to 17.17B dollars. In general, investors will be able to receive 3.16 dollars per share for the year.

ge-1.png


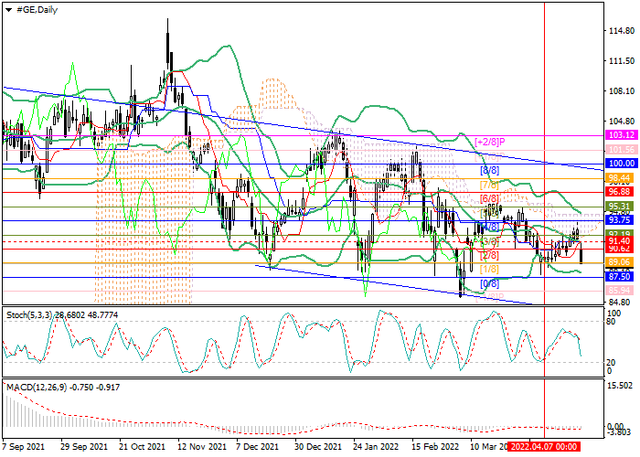
In case of a breakdown of 89.06 (Murray [1/8]), the decline may continue to 87.50 (Murray [0/8]), 85.94 (Murray [-1/8]). The key level for the "bulls" is 91.40 (the middle line of the Bollinger Bands). Its breakout will provide growth to 93.75 (Murray [4/8]), 95.31 (Murray [5/8]). Technical indicators signal a decline: the Bollinger Bands and the Stochastic are reversing downwards, the MACD histogram is increasing in the negative zone.

Resistance levels: 91.40, 93.75, 95.31 | Support levels: 89.06, 87.50, 85.94​
 
bac-1.png


The shares of one of the largest banks and analytical agencies in the US, Bank of America Corp., are traded within a corrective trend around 37.

On the daily chart, the price is within a rare Symmetrical Channel pattern and the day before reached the global support level of 36.6, which many times acted as a strong support for the asset and was eventually tested by quotes just at the beginning of the formation of this figure.

bank-of-america.png


On the four-hour chart, the instrument is falling within the second channel, which is directed downwards. After reaching the resistance line of 40, a clear reversal has formed and there are all signs of a likely continuation of the downtrend. This probability is confirmed by the readings of technical indicators: the range of EMA fluctuations on the Alligator indicator continues to expand in the direction of decline, and the histogram of the AO oscillator forms descending bars, being in the sell zone.

bac-3.png
 
ftse-forum-1.png


The leading index of the London Stock Exchange FTSE 100 is showing local corrective dynamics and is now at 7474.0.

Tomorrow, one of the largest components, HSBC Holdings Plc., and tobacco market leader, British American Tobacco Group, will publish their financial statements. From the British financial giant, analysts expect quarterly revenue to rise to 9.76 billion pounds, well above 8.89 billion in the previous period, but forecasts for the British American Tobacco Group are rather pessimistic: revenue is expected to fall to 12.67 billion pounds compared to 13.51 billion a quarter earlier.

One should also note the ongoing correction in the UK bond market, where 10-year bonds fell to 1.8465% from 2.0150% at the end of last week. The yield on 20-year conservative bonds corrected to 1.954%, which is well below the high of 2.128% set last Thursday

ftse-chart.png


Index quotes are trading within the global Expanding Formation pattern. Technical indicators are in a buy signal state, which is rapidly weakening: the fluctuation range of the Alligator indicator EMAs is actively narrowing and the histogram of the AO oscillator is approaching the transition level.

Support levels: 7350, 6990 | Resistance levels: 7670, 7900​
 
sp500-forum.png


The leading index of the US economy, the S&P 500, is correcting downwards, trading around 4204. The period of corporate reporting continues, and this week is one of the most active: yesterday, the financial results were published by such market giants as Microsoft Corp., Alphabet Inc., and Visa Inc.

The American company providing services for conducting payment transactions Visa Inc. reported revenue of 7.19B dollars, up from 7.06B dollars a quarter earlier. Data from two other tech corporations disappointed traders: Microsoft Corp. reported revenue of 49.36B dollars, down from 51.73B dollars a quarter earlier, and earnings per share of 2.22 dollars, up from 2.48 dollars a quarter earlier. The owner of the Google search engine, Alphabet Inc., was able to demonstrate only 68.01B dollars in revenue, which is lower than 75.33B dollars a quarter earlier and inferior to analysts' forecast of 68.08B dollars. Earnings per share were 24.62 dollars, down from 30.69 dollars.

Growth leaders include Sherwin-Williams Co. (+9.41%), Waste Management (+5.23%), and Whirlpool Corp. (+4.63%).

Among the decline leaders are Tesla Inc. (–12.18%), General Electric Co. (–10.34%), and Universal Health Services Inc. (–9.69%).

spx.png


The index quotes are moving in a local sideways trend, declining towards the year's low. Technical indicators maintain a global sell signal: fast EMAs on the Alligator indicator are below the signal line, and the AO oscillator histogram is trading in the sell zone, forming downward bars.

Resistance levels: 4281, 4590 | Support levels: 4137, 3900​
 
jj-forum-1.png


Shares of one of the world's leading retail holdings Johnson & Johnson are being corrected and traded at around 183.

On the daily chart of the asset, the price is holding above the resistance line of the global ascending channel, breaking the initial Fibonacci extension trend level of 61.8%, located at around 175.

On the four-hour time frame, it is clearly seen that the instrument will soon reach the the initial Fibonacci extension trend level of 100.0% in the area of 190.00, after which the strength of the uptrend will increase and the likelihood of continued growth will also increase significantly.

jj-chart.png


Technical indicators signal in favor of the development of upward dynamics: the range of EMA fluctuations on the Alligator indicator expands in the direction of growth, and the histogram of the AO oscillator is forming new ascending bars in the purchase zone.​
 
ym-forum-1.png


The Dow Jones is correcting upwards and is trading at 33967

The active phase of the publication of corporate reports continues, and at the end of this week, the technology company Meta Platforms Inc. presented its data. Despite the loss of the Russian and Belarusian markets, the issuer managed to increase the number of active users to 1.96B from 1.93B a quarter earlier. However, statistics recorded a drop in quarterly revenue to 27.91B dollars from 33.67B dollars and net income from 9.50B dollars to 7.47B dollars in Q1 2022. The world's largest chain of fast food restaurants McDonald's Corp. reported an 11% increase in revenue over the same period. Earnings per share were 2.28 dollars, which even surpassed the successful previous quarter, when the figure was about 2.23 dollars.

As for the bond market, the yield on the popular 10-year bonds fell slightly and amounted to 2.820%, while the conservative 20-year bonds lost 1.02% and are now trading at a yield of 3.091%.

ym.png


Quotes of the index continue to decline within a wide downward channel, approaching the support line. Technical indicators are holding a local sell signal: fast EMAs of the Alligator indicator began to actively expand the range of fluctuations in the direction of decline, and the histogram of the AO oscillator is forming new descending bars.

Support levels: 33200, 32320 | Resistance levels: 34230, 35340​
 
apple-forum-1.png


On the daily chart, the development of the third wave of the higher level 3 has completed, in which wave (5) of 3 has formed, and the development of a downward correction as the fourth wave 4 continues. At the moment, wave (A) of 4 has formed, wave (B) of 4 has completed and wave (C) of 4 is developing, in which the first wave of the lower level 2 of (C) was formed.

If the assumption is correct, the price will fall to the levels of 148.43 - 127.03. The level of 170.35 is critical and stop-loss for this scenario.

aapl.png
 
sp500-forum-2.png


Corporate reporting data puts pressure on quotes.
S&P 500 is correcting down after the release of the financial results of the leading components and is now trading at 4173.

This week may continue the negative wave of reporting giants of the US corporate sector. The holding company controlled by Warren Buffett, Berkshire Hathaway Inc., reported revenue of 70.81B dollars, beating analysts' forecast of 70.19B dollars, but earnings per share were 4.774K dollars, down from 4.901K dollars a quarter earlier.

Pfizer Inc., Advanced Micro Devices Inc. (AMD) and Starbucks Corp. will present their data today. Market participants expect from pharmaceutical giant Pfizer Inc. a quarterly revenue of 24.1B dollars, which could surpass the previous period's figure of 23.84B dollars. AMD could also improve, posting a profit of 5.01B dollars from 4.83B dollars, while the global coffee market leader, Starbucks Corp., is likely to worsen its numbers (revenue could reach 7.62B dollars, which is below 8.05B dollars a quarter earlier).

sp500.png


The index quotes are trading in a global downtrend, falling towards the support line. Technical indicators maintain the global sell signal: the fast EMAs of the Alligator indicator are below the signal line, and the histogram of the AO oscillator is trading in the sell zone, forming descending bars.

Support levels: 4100, 3800 | Resistance levels: 4280, 4590​
 
Bank of America, the price may fall.

On the daily chart, the formation of the first wave of the higher level 1 has completed and a downward correction is developing as the second wave 2. At the moment, the formation of the wave (A) of 2 continues, in which the fifth wave of the lower level 5 of (A) develops.

If the assumption is right, the fall of the pair will continue to the levels of 32 - 26.32. The level of 40.3 is critical and stop-loss for this scenario.

bac.png
 
jp-morgan-forum-1.png


The asset is in correction; the probability of fall is maintained.
On the daily chart, the development of the third wave of the higher level 3 was completed and the development of a downward correction as the wave 4 continues. At the moment there is a formation of the wave (A) of 4, which included the third wave of the lower level 3 of (A).

If the assumption is correct, after the wave 4 of (A) is complete, the decline of the price will continue to the levels of 101 - 83.18. The level of 144.05 is critical and stop-loss for this scenario.

jp-morgan.png
 
Back
Top