ExnessOfficial
Exness Representative
- Messages
- 51
ETHUSD Daily chart
ETHUSD is moving within a descending price channel on the daily time frame, and has now touched the upper side of the channel, which is considered a crucial area. Below, the Stochastic Oscillator is slowly heading towards the 80-100 zones.
If the price breached the upper side of the channel, it may be a sign that Ethereum is heading to higher levels, but if it closes below, it may push the price towards further decline.
Pick a side for ETH
- Buy
- Sell
Find more here:https://bit.ly/3ECF4Zx
![[EN] PROM-7491_W45 - ETHUSD Price channel.jpg](https://www.forexpeacearmy.com/community/s3/data/attachments/84/84965-0cab8e7acc544fa23e8c3cab7c2666e9.jpg)
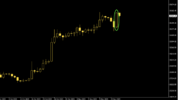
 ️ US500 (S&P 500) Daily chart
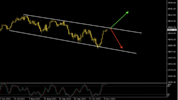
![[EN] PROM-7592_2023 - W50 - EURUSD Resistance zone.jpg](https://www.forexpeacearmy.com/community/s3/data/attachments/85/85265-fcbb2fe4dd326c15361e75c75e75cd43.jpg)
![[EN] PROM-7605_2023 - W48 - USOIL downtrend (1).jpg](https://www.forexpeacearmy.com/community/s3/data/attachments/85/85308-a0f5349f084a59f95594a456fa315e73.jpg)