ExnessOfficial

Exness Representative
Messages
51
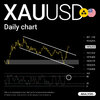
Gold is falling towards a potential support zone

Gold has fallen strongly since the beginning of the week from prices $1,925 to $1,896 amid sustained USD buying, Fed rate hike expectations.

It seems that it is now heading towards a potential support zone around prices $1,890 to $1,884 prices. While the Stochastic oscillator indicator reached the oversold area.

Are you buying or selling?
Find more here: https://bit.ly/3ECF4Zx
 

Attachments

  • [EN] PROM-7214_2023 - W38 - XAUUSD Potential support zone.jpg
    [EN] PROM-7214_2023 - W38 - XAUUSD Potential support zone.jpg
    418.7 KB · Views: 6
Last edited:
AMZN stock is forming a potential bat pattern after a big decline from the supply zone that shown on the chart.

If the price continues to fall, it may confirm the strength of the pattern and push the stock to lower levels.

Are you buying or selling?
Find more here: https://bit.ly/3ECF4Zx
 

Attachments

  • [EN] PROM-7185_2023 - W38 - AMZN Stock (1).jpg
    [EN] PROM-7185_2023 - W38 - AMZN Stock (1).jpg
    302.4 KB · Views: 3
Think you're good at technical analysis?
Answer this quiz:

What are the 2 conditions shown on this chart?
Find more here: https://bit.ly/3ECF4Zx

1. Rectangle pattern & Price action
2. Demand zone & Inverted Cup and Handle
3. Resistance zone & broken price channel
4. Volatility and divergence
 

Attachments

  • [EN] PROM-7230_2023 - W39 - Technical analysis quiz.jpg
    [EN] PROM-7230_2023 - W39 - Technical analysis quiz.jpg
    297.7 KB · Views: 5
Gold is under pressure and touching a critical zone

Fundamentally: XAUUSD is declining under negative pressure due to market expectations of continued raising of interest rates by the US Federal Reserve and influenced by the surge in US yields.

Technically: Gold is touching a critical demand zone around prices $1,820 - $1,803. A rebound upwards from this zone is possible, provided it is not broken and a day candlestick closes below it.

Pick a side for Gold: Long or Short?
Find more here: https://bit.ly/3ECF4Zx
 

Attachments

  • [EN] PROM-7262_2023 - W40 - XAUUSD Critical zone.jpg
    [EN] PROM-7262_2023 - W40 - XAUUSD Critical zone.jpg
    321.4 KB · Views: 4
Test your technical analysis skills and answer this quiz:
What are the 2 conditions shown on this chart?

1. Rectangle pattern & Downtrend
2. Gann fan and RSI
3. Bat pattern and Horizontal channel
4.Volatility and Divergence

Find more here: https://bit.ly/3ECF4Zx
 

Attachments

  • [EN] PROM-7275_2023 - W41 - Technical analysis quiz.jpg
    [EN] PROM-7275_2023 - W41 - Technical analysis quiz.jpg
    286.2 KB · Views: 3
Where is gold price heading?

XAUUSD broke its descending price channel on the daily time frame, supported by the tensions in Middle East, uncertainty from the US Federal Reserve, and recession fears in Europe zone.These fundamental reasons led to gold rising and reaching near the $2,000 level, last week.

Will Gold continue to rise towards higher prices? Or will it go down at least to retest the broken channel?
Find more here: https://bit.ly/3ECF4Zx
 

Attachments

  • PROM-7412_2023 - W43 - XAUUSD Technical & Fundamental analysis.jpg
    PROM-7412_2023 - W43 - XAUUSD Technical & Fundamental analysis.jpg
    418.8 KB · Views: 4
Gold moves inside a narrow price channel

The anticipation that the Federal Reserve (Fed) to hold rates steady and perhaps start cutting in 2024 weighs on the US Dollar (USD) and lends some support to the yellow precious metal.

On the chart, XAUUSD recovers its recent losses near $2,040. And is now moving in a narrow ascending price channel on the H4 chart. While the stochastic oscillator indicator below is giving a positive intersection.

Based on the current situation, Are you buying or selling?
 

Attachments

  • [EN] PROM-7663_2023 - W49 - XAUUSD Price channel.jpg
    [EN] PROM-7663_2023 - W49 - XAUUSD Price channel.jpg
    394 KB · Views: 3
Bitcoin potential rise

BTCUSD is forming an inverted head & shoulders on H1 chart, and is now trading below the downtrend line. If the price breaks this trendline, the bullish harmonic pattern will be activated and BTC may rise for higher levels.

Are you buying or selling?
Find more here: https://bit.ly/3ECF4Zx
 

Attachments

  • [EN] PROM-7703_2023 - W49 - BTCUSD Head & Shoulders.jpg
    [EN] PROM-7703_2023 - W49 - BTCUSD Head & Shoulders.jpg
    267.1 KB · Views: 3
US500: Will it break the critical resistance?

US500 rose supported by the Federal Reserve's decision on keeping the fed rate unchanged at 5.50%. Most US stocks and other assets rose too.

The index is now heading to the main resistance zone around $4,800. which seems to be a critical station where we might see a breakout and new uptrend, or falling down below it.

Pick a side: Buy or Sell?
Find more here: https://bit.ly/3ECF4Zx
 

Attachments

  • [EN] PROM-7732_2023 - W50 - US500 Resistance zone.jpg
    [EN] PROM-7732_2023 - W50 - US500 Resistance zone.jpg
    414.8 KB · Views: 1
Test your technical analysis skills and answer the quiz:
What are the 2 conditions shown on this chart?

1.Triangle pattern and resistance zone
2. Price channel and Shark pattern
3. Triple top and support zone
4. Bollinger bands and Volume

Let us know:https://bit.ly/3ECF4Zx
 

Attachments

  • technical analysis .jpeg
    technical analysis .jpeg
    254.6 KB · Views: 5
Back
Top