Tusharcsfx
Recruit
- Messages
- 0
Daily FX Analysis – Red Sea, Stable EUR, AUD Retreats, USD/JPY Eyes BoJ.
Introduction
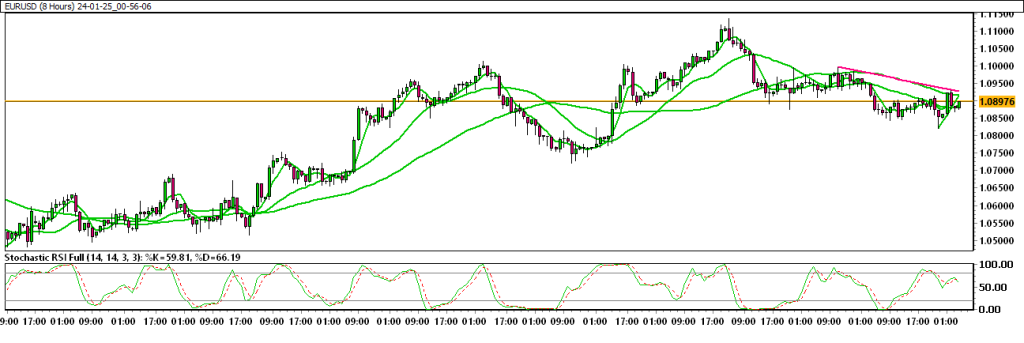
The GBP/USD consolidates above 1.2700 amid modest USD weakness, driven by a positive risk-on environment. Despite a rebound in the pair, rising tensions in the Red Sea pose potential challenges. Meanwhile, EUR/USD stabilizes near 1.0900, influenced by an improving risk mood. The Australian Dollar retraces gains as the market awaits potential policy rate reduction by the Australian Central Bank. Japanese Yen struggles against the USD, with investors anticipating dovish actions from the Bank of Japan amid geopolitical risks and China’s economic concerns.Markets In Focus Today – GBP/USD
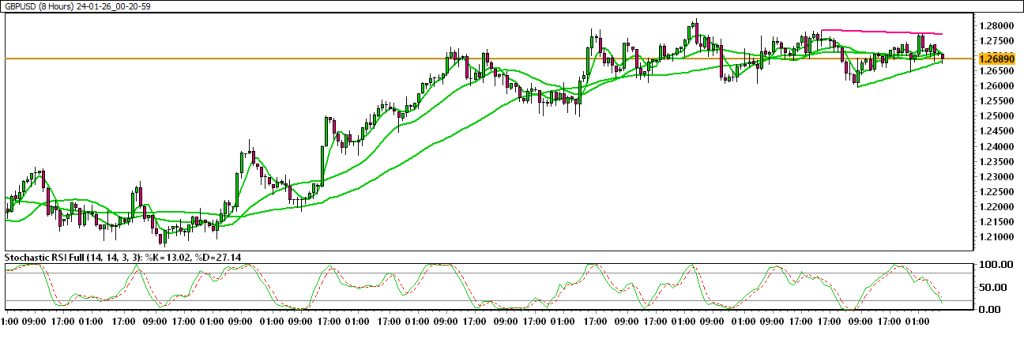
GBP/USD Consolidates Above 1.2700 On Modest USD Weakness.
GBP/USD kicks off the new week on a positive note, trading above 1.2700 early Monday. The risk-on environment bolsters the rebound of the major pair. However, the rising tension in the Red Sea might boost safe-haven asset demand and cap the pair's upside. GBP/USD staged a rebound in the second half of the previous week and erased a large portion of its weekly losses. The pair’s near-term technical outlook is yet to point to a build-up of bullish momentum as it holds steady at around 1.2700 in the European morning on Monday. Nevertheless, investors remain indecisive about the Federal Reserve (Fed) policy pivot timing ahead of this week’s key growth and inflation data from the US.Technical Overview With Chart :
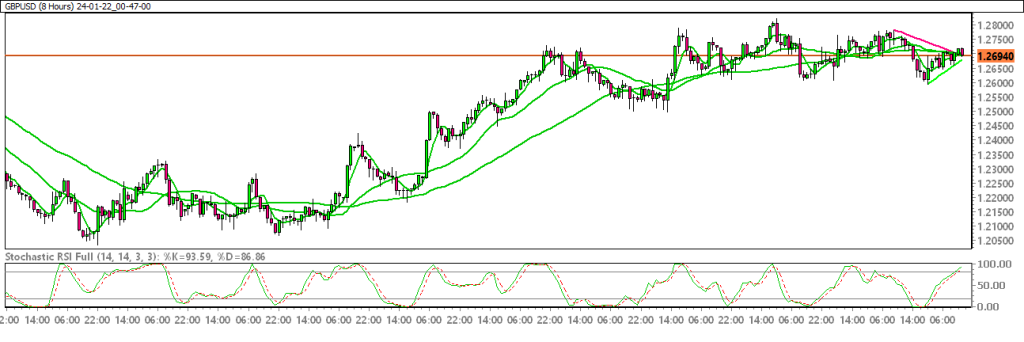
Moving Averages :
Exponential :
- MA 10 : 1.27 | Negative Crossover | Bearish
- MA 20 : 1.27 | Positive Crossover | Bullish
- MA 50 : 1.26 | Positive Crossover | Bullish
Simple :
- MA 10 : 1.27 | Negative Crossover | Bearish
- MA 20 : 1.27 | Negative Crossover | Bearish
- MA 50 : 1.26 | Positive Crossover | Bullish
Stochastic Oscillator : 55.73 | Buy Zone | Positive
Resistance And Support Levels :
- R1 : 1.28 R2 : 1.29
- S1 : 1.26 S2 : 1.25
Overall Sentiment: Bullish Market Direction: Buy
Trade Suggestion: Limit Buy: 1.2685 | Take Profit: 1.2792 | Stop Loss: 1.2619EUR/USD
Read Full Report Visit Us - Capital Street FX