Tusharcsfx
Recruit
- Messages
- 0
Weekly Index Analysis – Dow Soars, S&P Records, FTSE Struggles.
Introduction:
Asian stocks are poised for a weekly gain, with attention focused on the upcoming US inflation test. The Shanghai composite has risen by 0.14%. Across the region, the Singapore MSCI is up 0.76% at 279.55. European equities have reached a two-year peak, driven by positive economic indicators and strong earnings reports. On Wall Street, there is an uptrend fueled by robust GDP data. The strong start to the year for the US stock market faces a significant challenge next week, with a busy schedule featuring major tech earnings, the Federal Reserve’s monetary policy meeting, and the eagerly awaited employment report.Market In Focus For The Next Week – Dow Jones
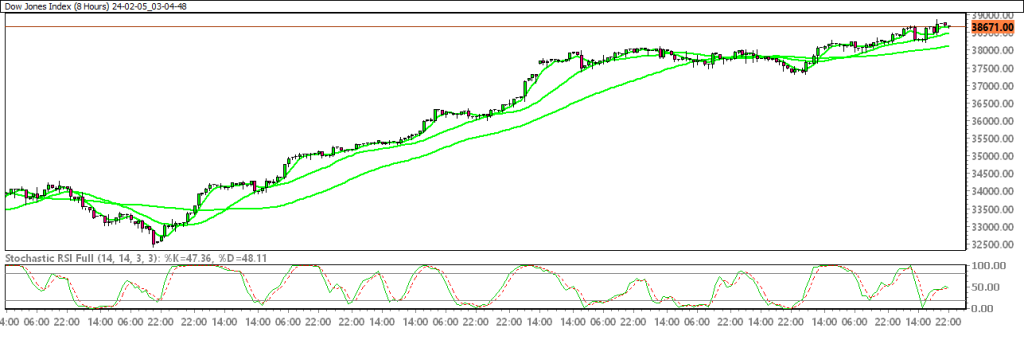
The Dow Jones advanced amid a broad rally in the equity markets.TECHNICAL OVERVIEW:
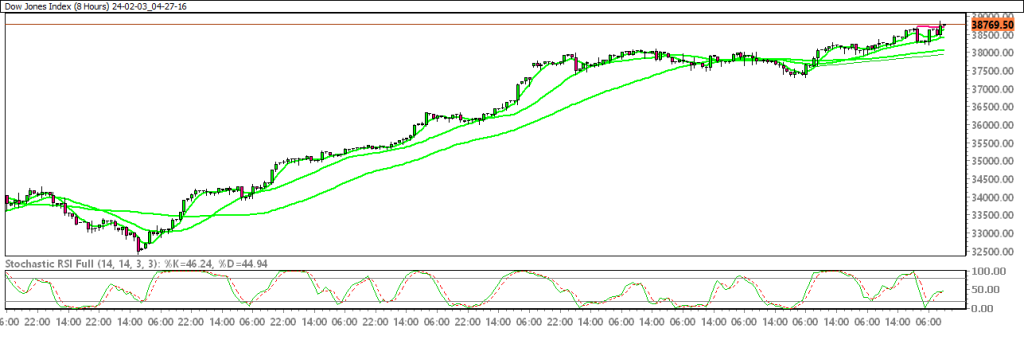
Moving Averages:
Exponential:
- MA 5: 38642.70 | Positive Crossover | Bullish
- MA 20: 38425.32 | Positive Crossover | Bullish
- MA 50: 38077.36 | Positive Crossover | Bullish
Simple:
- MA 5: 38647.07 | Positive Crossover | Bullish
- MA 20: 38425.37| Positive Crossover | Bullish
- MA 50: 38077.31 | Positive Crossover | Bullish
Stochastic Oscillator: 46.24| Buy Zone |Positive
Resistance And Support Levels:
- R1: 38889.50 | R2: 39572.98
- S1: 38073.74| S2: 37280.02