Tusharcsfx
Recruit
- Messages
- 0
Daily Commodity Analysis – Expose WTI surge, corn slump, metals’ volatility causes.
Introduction
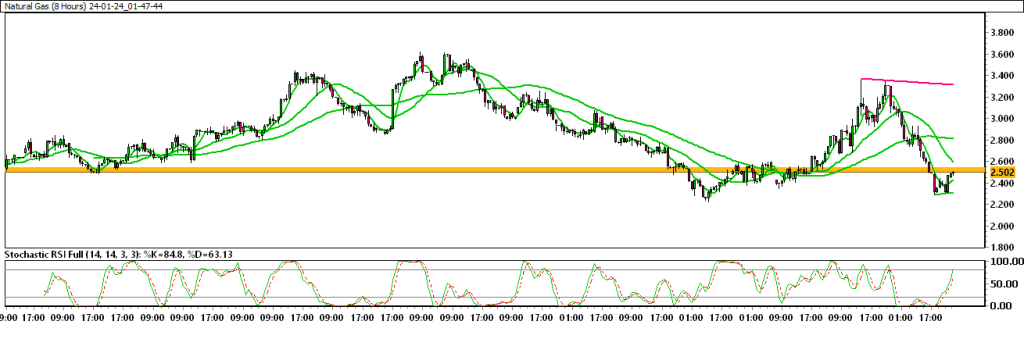
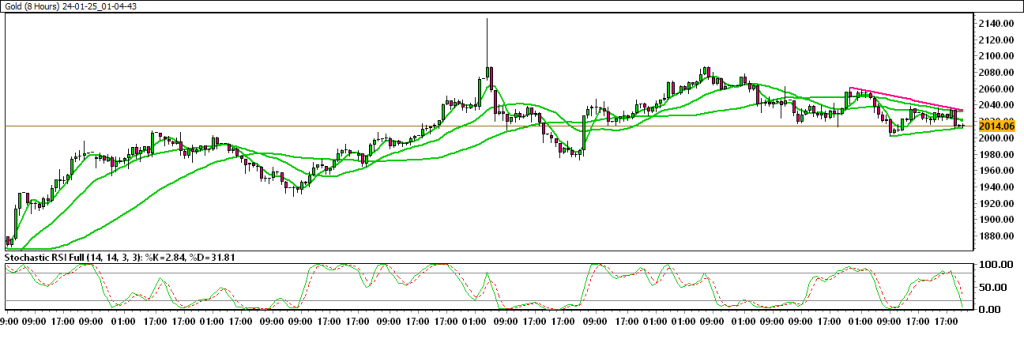
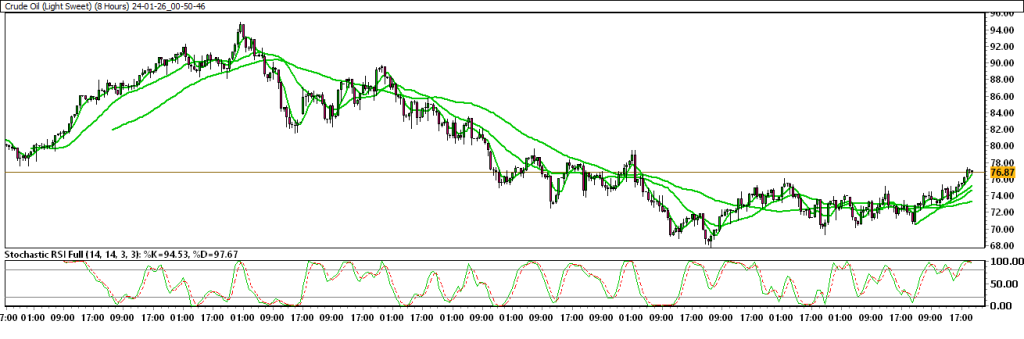
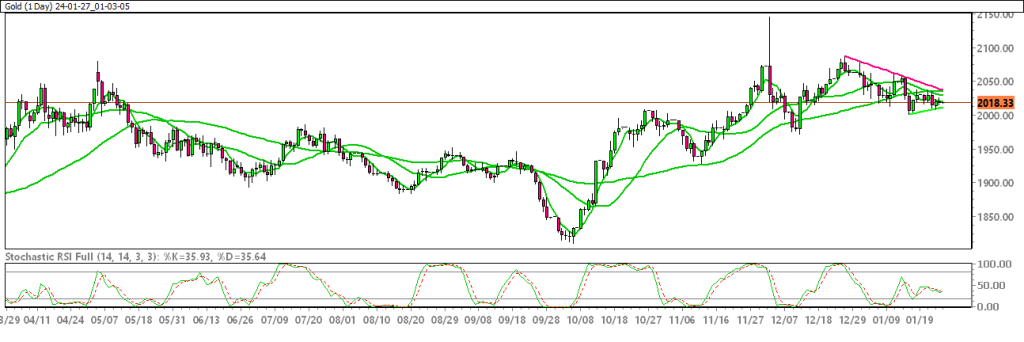
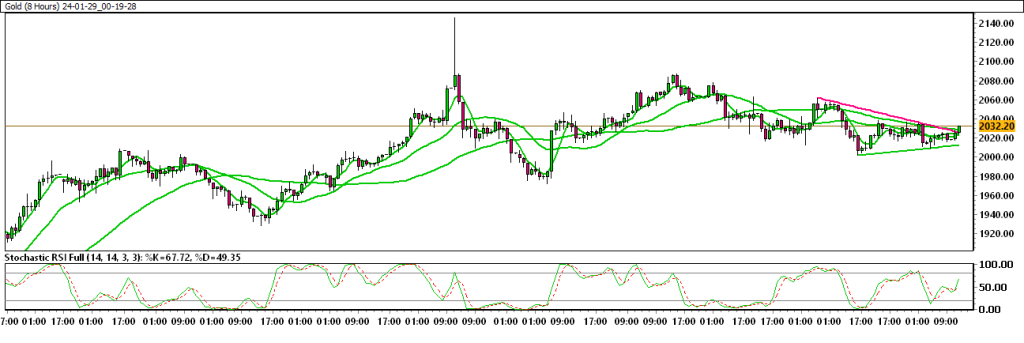
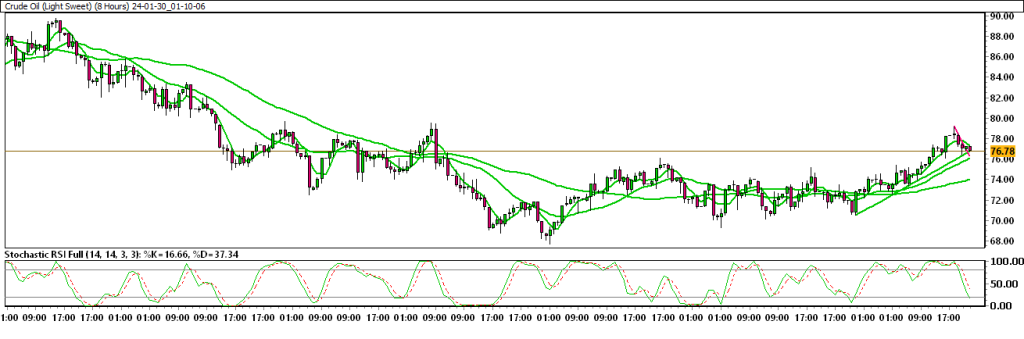
WTI crude oil rallies to around $74.70 per barrel fueled by global energy supply concerns, exacerbated by Ukraine’s drone strike on Russian fuel terminal Novatek and US production disruptions. In corn futures, fractional gains persist amid varied export figures. Gold prices rise, influenced by economic uncertainties, while silver (XAG/USD) plunges to near $22 as Fed rate-cut optimism fades, with attention now on upcoming US Q4 GDP data.Markets In Focus Today – CRUDE OIL
WTI Improves To Nearly $74.70 Over Global Energy Supplies, And Air Strikes Against Houthis.
WTI price moves higher on concerns over global supply disruptions. Ukraine conducted a drone attack on a Russian fuel terminal Novatek. West Texas Intermediate (WTI) price extends its gains for the second successive session, improving to near $74.70 per barrel during the Asian session on Tuesday. The rise in Crude oil prices is attributed to concerns over global energy supplies, sparked by a drone strike on Russia’s Novatek by Ukraine. Additionally, disruptions in Crude production from the United States (US) due to extreme cold weather have contributed to the upward pressure on oil prices.Technical Overview With Chart :
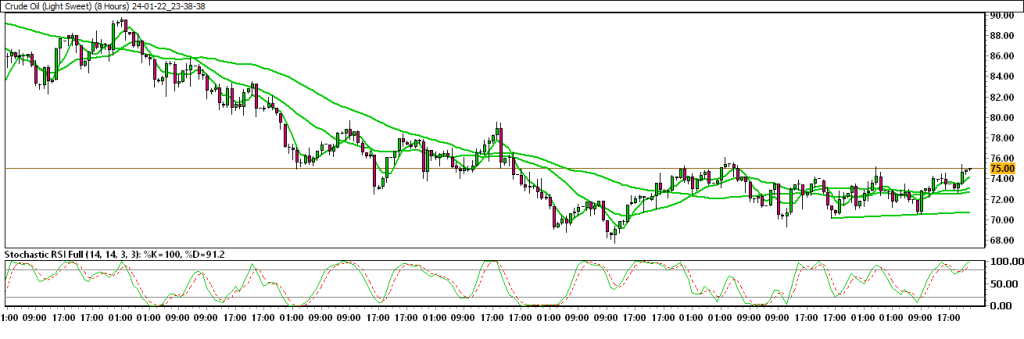
Moving Averages :
Exponential :
- MA 10 : 73.51 | Positive Crossover | Bullish
- MA 20 : 73.17 | Positive Crossover | Bullish
- MA 50 : 74.52 | Positive Crossover | Bullish
Simple :
- MA 10 : 73.13 | Positive Crossover | Bullish
- MA 20 : 72.83 | Positive Crossover | Bullish
- MA 50 : 73.56 | Positive Crossover | Bullish
Stochastic Oscillator : 83.82 | Neutral Zone | Neutral
Resistance And Support Levels :
- R1 : 75.38 R2 : 77.52
- S1 : 68.47 S2 : 66.33
Overall Sentiment: Bullish Market Direction: Buy
Trade Suggestion: Stop Buy: 75.49 | Take Profit: 79.38 | Stop Loss: 73.12CORN
READ THE FULL REPORT VISIT US - CAPITAL STREET FX