Tusharcsfx
Recruit
- Messages
- 0
Weekly Commodity Analysis – Oil, gas, gold turmoil, silver rises.
Introduction
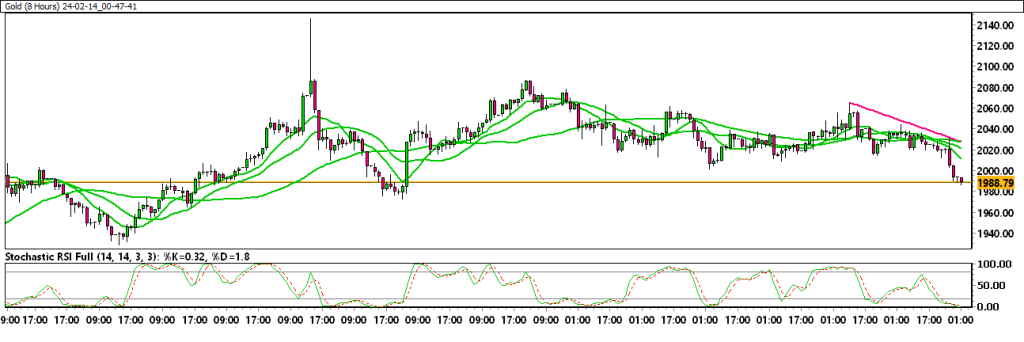
Oil prices face a weekly decline, influenced by hopes for a Gaza ceasefire and a stronger dollar, eroding the supply risks premium. Natural gas experiences a decline due to a storage draw falling short of demand, impacted by mild weather predictions. Gold slumps below $2,040 as upbeat US Nonfarm Payrolls lift Treasury yields, affecting XAU/USD. Meanwhile, silver rose over 1% to $23.17, supported by central bank decisions and declining global bond yields.Markets In Focus Today – BRENT CRUDE OIL
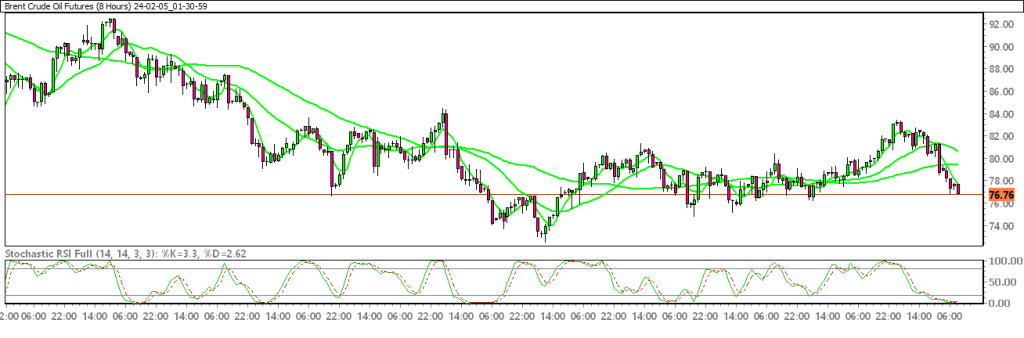
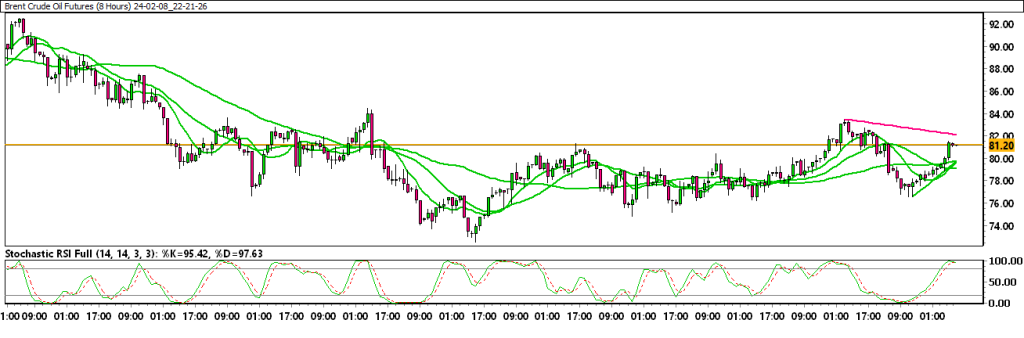
Oil Prices In Weekly Slump As Gaza Ceasefire Hopes, Stronger Dollar Bite.
Oil prices fell Friday, to end the week deep in the red as growing optimism over an extended ceasefire in the Israel-Hamas war cooled the supply risks premium baked into prices. Faltering growth in China and the possibility of some easing of tensions in the Middle East also reduced prices. High-interest rates, which tend to dampen economic growth and oil demand, in major economies like the United States and the eurozone appear to be here to stay in the near term. A stronger dollar makes oil, priced in the U.S. dollars, more expensive and less attractive to foreign buyers.Technical Overview With Chart :
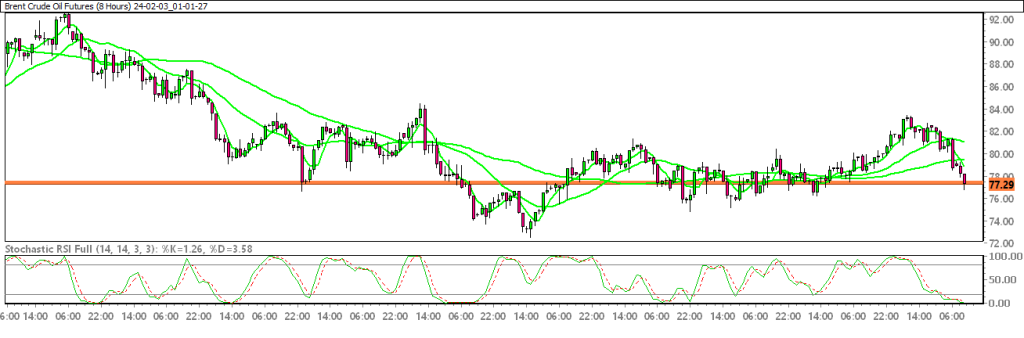
Moving Averages :
Exponential :
- MA 10 : 80.00 | Negative Crossover | Bearish
- MA 20 : 79.67 | Negative Crossover | Bearish
- MA 50 : 79.89 | Negative Crossover | Bearish
Simple :
- MA 10 : 80.76 | Negative Crossover | Bearish
- MA 20 : 79.32 | Negative Crossover | Bearish
- MA 50 : 78.60 | Negative Crossover | Bearish
Stochastic Oscillator : 31.58 | Sell Zone | Negative
Resistance And Support Levels :
- R1 : 83.35 R2 : 85.56
- S1 : 76.22 S2 : 74.01