Tusharcsfx
Recruit
- Messages
- 0
Daily Commodity Analysis – oil dives, corn lows, gold reacts to bonds.
Introduction
WTI faces renewed selling pressure, hovering around $76.00 amid a second consecutive day of retreats. Despite geopolitical risks, a surge in US inventories weighs on oil prices, while OPEC’s positive global demand outlook fails to provide support. In the corn market, futures hit new lows, influenced by a red trading session and ethanol-related data. Gold prices tick higher due to sliding US bond yields and geopolitical tensions, while Silver stabilizes above $22, awaiting guidance from US Retail Sales data. Federal Reserve comments suggest a hesitant stance on rate cuts, impacting precious metals.Markets In Focus Today – Crude OIL
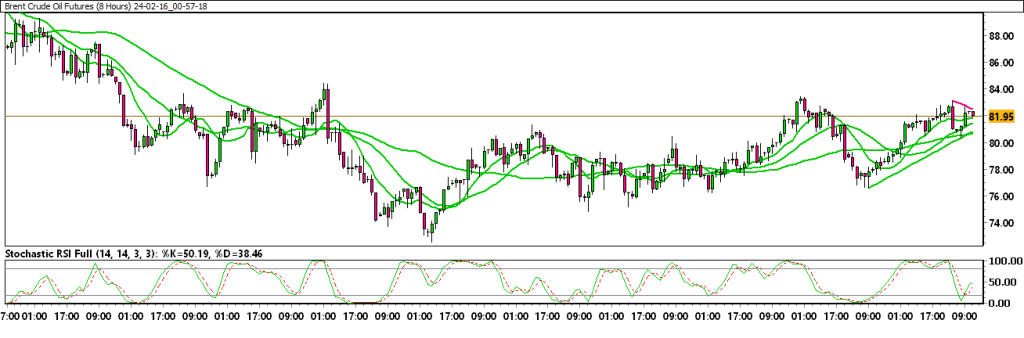
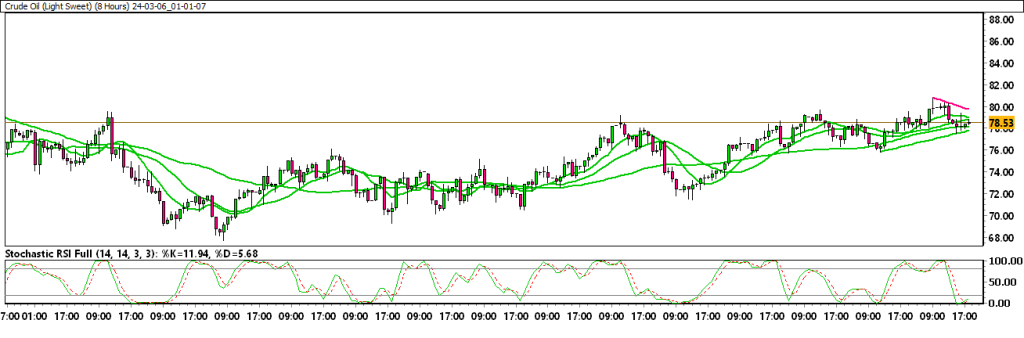
WTI Retreats Further From The Monthly Peak And Seems Vulnerable Near The $76.00 Mark.
WTI remains under some selling pressure for the second straight day on Thursday. A spike in US inventories overshadows geopolitical risks and weighs on Oil prices. The OPEC sees a rise in global demand in 2024, and 2025, albeit fails to lend support. West Texas Intermediate (WTI) US Crude Oil prices extend the overnight pullback from the vicinity of mid-$78.00s, or a fresh monthly peak and drift lower for the second successive day on Thursday. The commodity hovers around the $76.00 mark during the Asian session and remains well within the striking distance of the weekly low touched on Monday.Technical Overview With Chart :
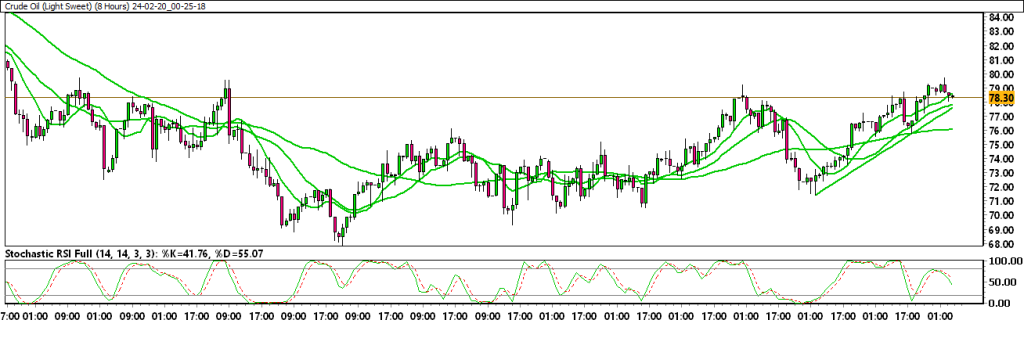
Moving Averages :
Exponential :
- MA 10 : 75.9666 | Positive Crossover | Bullish
- MA 20 : 75.3486 | Positive Crossover | Bullish
- MA 50 : 75.1257 | Positive Crossover | Bullish
Simple :
- MA 10 : 75.2912 | Positive Crossover | Bullish
- MA 20 : 75.5299 | Positive Crossover | Bullish
- MA 50 : 73.5075 | Positive Crossover | Bullish
Stochastic Oscillator : 68.9884 | Buy Zone | Negative
Resistance And Support Levels :
- R1 : 78.6054 R2 : 80.9659
- S1 : 70.9639 S2 : 68.6034