Sive Morten
Special Consultant to the FPA
- Messages
- 18,748
Monthly
Due to Easter holiday it was short week, especially if we take into consideration that market was flat even before this. Not all time frames have significant moments, but monthly time frame shows important things. I’m particularly speaking about triggering of bearish engulfing pattern. Take a look – market has closed below the low of it and officially has triggered the pattern.
Technically pattern is important per se, since it lets us to stick with it and understand when we can speak about bullish or bearish trend. Thus, until market will not take 1.3730 high – it is difficult to tell about re-establishing of bullish trend here. The minimum target usually is a length of the bars and it points on 1.2450-1.25 area. I usually apply a bit conservative targets by using just candle bodies, but if we will measure total height of engulfing pattern from low to high – we’ll see that its target stands right around Yearly Pivot Support 1 at 1.2330. Since market has moved below YPP – as you know very often price gravitates to PS1. So, price action and pattern is bearish here, and our major direction in medium term perspective will be bearish, until, as we’ve said market will not take out previous highs and will not erase this pattern.

Weekly
Trend is bearish here, market is not at oversold. We haven’t got any drastical changes and progress on previous week, although overall action was down. Looking on perspective a bit, there are some moments here that are worthy of our attention, I suppose. Take a note that market has not shown any reasonable retracement (at least 3/8) since the beginning of the year, i.e. during current trend down. Second – look how market has passed through weekly K-support. There was no respect here. This tells us how weak market is and warning us that market could re-test this area from below. One of the features of K-level, as well as any other solid areas – when market passes through it without respect, it significantly increases probability of return to this area but from the opposite side.
In April broken K-area coinsides with MPR1=1.3050 and MPS1 coinsides with our next target and next major Fib level around 1.2680. That is also previous swing low. The major conclusion that could be done here is: Trend is bearish, but we should not be surprised if we will see some reversal or exhausted patterns on daily chart that could trigger retracement to 1.3050 area. This is not neccesary to happen, but if it will – we know what to expect. May be this move to 1.3050 will happen after touching of 1.2670, this is also possible. I’m telling all these moments mostly to wake up your attention, so you will not skip and ignore any possible bullish patterns if they will appear on daily chart, for instance.

Daily
On previous week we mostly have talked about downward continuation and so on. Thus, with downward development should be all clear. Still, as we’ve said above – market could start a bounce to re-test weekly K-resistance, but we currently do not know will it happen at all or if it will – from which level bounce up could start. Since we have no clear patterns here – we will use harmonic swings. I’m not tired to repeat again the importance of harmonic numbers on any market.
EUR confirms the specific of well-trending market – since the start of the year very harmonic swings as up as down. Take a look – all retracements up are near equal. Moves down (red lines) are as well, and what is interesting – market stands right at the end point of this downward move. It means that we could see 1 harmonic retracement up, that will lead price right to MPP. Double harmonic swing up leads market precisely to MPR1 and disrespected weekly K-resistance. Since price action has formed two inside sessions, hardly it will remain here for long period.

4-hour
On 4-hour chart is not much to talk about – the same downward channel. One moment that could have some value is inner AB=CD pattern, market has reached it’s target and now shows the bounce up. Now is a major question – will it be just a bounce or it could be starting point of something greater.

60-min
Here is almost the same situation as on Thursday. The structure of price action reminds retracement, hardly it could be called as impulse move. As we’ve discussed previously – this retracement already has reached level, until which we would not have any suspicions about greater upward challenges. As we’ve said – till the K-area and re-testing of previous consolidation bears could feel themselves on even keel. But moving above this level will add pressure to overall situation. In this case we probably will have to take a pause and to wait some time to understand what is going on and why this move up has happened. Actually now we have no definite patterns that point on possible reversal here, except, may be some relative moments, such as harmonic swings, new untouched MPP and lower border of channel on 4-hour chart. May be current action looks like reverse H&S, I’m not absolutely sure. To be honest – I better prefer to see any pullback, if it will have to happen anyway, from 5/8 Fib support. But how it will turn in reality – we’ll see.
Anyway – if you’re bearish and want to enter short, current area is most suitable for this purpose, because your invalidation point will be right above K-area and you will be able to take mosition with minimum risk. But is it really bearish short-term context here – this is quite different question.
If market will break this resistance and return right back inside of previous consolidation – this could be start point of greater upward AB=CD action, or even retracement to MPR1. Besides, take a look that WPP stands very close to MPP on coming week.

Conclusion:
On monthly chart market finally has triggered bearish engulfing pattern that theoretically could lead price to Yearly Pivot Support 1 around 1.2330. Thus, we have long term direction and target. The major point is – where will be safe to enter short.
The fact that market has not shown even 3/8 pullback from the start of the year and existence of disrespected K-resistance area, untouched MPP and WPP above the market increases the odds of upward retracement. The problem though that we do not have any key to it, since we do not have any bullish patterns. That’s why it is difficult predict will this retracement start and when. It will be perfect if it will start from major 5/8 support, but market quite rare gives us perfect setups.
Taking into consideration all that moments, it is probably makes sense to monitor current action on hourly chart, particularly K-resistance area. Setup here suggests, that if market will hold below this area and continue move lower – bears still control the market, but if price will break this level – it could become deeper retracement.
If you’re sure that market is bearish, and current situation doesn’t embarrass you – this level is good opportunity, mostly because invalidation point will be close, and if even you will be wrong, you will not loose much.
So, guys, such neutral conclusion on this week… Still don’t be upset too much, situation changes quickly now.
The technical portion of Sive's analysis owes a great deal to Joe DiNapoli's methods, and uses a number of Joe's proprietary indicators. Please note that Sive's analysis is his own view of the market and is not endorsed by Joe DiNapoli or any related companies.
Due to Easter holiday it was short week, especially if we take into consideration that market was flat even before this. Not all time frames have significant moments, but monthly time frame shows important things. I’m particularly speaking about triggering of bearish engulfing pattern. Take a look – market has closed below the low of it and officially has triggered the pattern.
Technically pattern is important per se, since it lets us to stick with it and understand when we can speak about bullish or bearish trend. Thus, until market will not take 1.3730 high – it is difficult to tell about re-establishing of bullish trend here. The minimum target usually is a length of the bars and it points on 1.2450-1.25 area. I usually apply a bit conservative targets by using just candle bodies, but if we will measure total height of engulfing pattern from low to high – we’ll see that its target stands right around Yearly Pivot Support 1 at 1.2330. Since market has moved below YPP – as you know very often price gravitates to PS1. So, price action and pattern is bearish here, and our major direction in medium term perspective will be bearish, until, as we’ve said market will not take out previous highs and will not erase this pattern.
Weekly
Trend is bearish here, market is not at oversold. We haven’t got any drastical changes and progress on previous week, although overall action was down. Looking on perspective a bit, there are some moments here that are worthy of our attention, I suppose. Take a note that market has not shown any reasonable retracement (at least 3/8) since the beginning of the year, i.e. during current trend down. Second – look how market has passed through weekly K-support. There was no respect here. This tells us how weak market is and warning us that market could re-test this area from below. One of the features of K-level, as well as any other solid areas – when market passes through it without respect, it significantly increases probability of return to this area but from the opposite side.
In April broken K-area coinsides with MPR1=1.3050 and MPS1 coinsides with our next target and next major Fib level around 1.2680. That is also previous swing low. The major conclusion that could be done here is: Trend is bearish, but we should not be surprised if we will see some reversal or exhausted patterns on daily chart that could trigger retracement to 1.3050 area. This is not neccesary to happen, but if it will – we know what to expect. May be this move to 1.3050 will happen after touching of 1.2670, this is also possible. I’m telling all these moments mostly to wake up your attention, so you will not skip and ignore any possible bullish patterns if they will appear on daily chart, for instance.
Daily
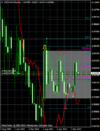
On previous week we mostly have talked about downward continuation and so on. Thus, with downward development should be all clear. Still, as we’ve said above – market could start a bounce to re-test weekly K-resistance, but we currently do not know will it happen at all or if it will – from which level bounce up could start. Since we have no clear patterns here – we will use harmonic swings. I’m not tired to repeat again the importance of harmonic numbers on any market.
EUR confirms the specific of well-trending market – since the start of the year very harmonic swings as up as down. Take a look – all retracements up are near equal. Moves down (red lines) are as well, and what is interesting – market stands right at the end point of this downward move. It means that we could see 1 harmonic retracement up, that will lead price right to MPP. Double harmonic swing up leads market precisely to MPR1 and disrespected weekly K-resistance. Since price action has formed two inside sessions, hardly it will remain here for long period.
4-hour
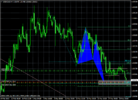
On 4-hour chart is not much to talk about – the same downward channel. One moment that could have some value is inner AB=CD pattern, market has reached it’s target and now shows the bounce up. Now is a major question – will it be just a bounce or it could be starting point of something greater.
60-min
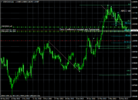
Here is almost the same situation as on Thursday. The structure of price action reminds retracement, hardly it could be called as impulse move. As we’ve discussed previously – this retracement already has reached level, until which we would not have any suspicions about greater upward challenges. As we’ve said – till the K-area and re-testing of previous consolidation bears could feel themselves on even keel. But moving above this level will add pressure to overall situation. In this case we probably will have to take a pause and to wait some time to understand what is going on and why this move up has happened. Actually now we have no definite patterns that point on possible reversal here, except, may be some relative moments, such as harmonic swings, new untouched MPP and lower border of channel on 4-hour chart. May be current action looks like reverse H&S, I’m not absolutely sure. To be honest – I better prefer to see any pullback, if it will have to happen anyway, from 5/8 Fib support. But how it will turn in reality – we’ll see.
Anyway – if you’re bearish and want to enter short, current area is most suitable for this purpose, because your invalidation point will be right above K-area and you will be able to take mosition with minimum risk. But is it really bearish short-term context here – this is quite different question.
If market will break this resistance and return right back inside of previous consolidation – this could be start point of greater upward AB=CD action, or even retracement to MPR1. Besides, take a look that WPP stands very close to MPP on coming week.
Conclusion:
On monthly chart market finally has triggered bearish engulfing pattern that theoretically could lead price to Yearly Pivot Support 1 around 1.2330. Thus, we have long term direction and target. The major point is – where will be safe to enter short.
The fact that market has not shown even 3/8 pullback from the start of the year and existence of disrespected K-resistance area, untouched MPP and WPP above the market increases the odds of upward retracement. The problem though that we do not have any key to it, since we do not have any bullish patterns. That’s why it is difficult predict will this retracement start and when. It will be perfect if it will start from major 5/8 support, but market quite rare gives us perfect setups.
Taking into consideration all that moments, it is probably makes sense to monitor current action on hourly chart, particularly K-resistance area. Setup here suggests, that if market will hold below this area and continue move lower – bears still control the market, but if price will break this level – it could become deeper retracement.
If you’re sure that market is bearish, and current situation doesn’t embarrass you – this level is good opportunity, mostly because invalidation point will be close, and if even you will be wrong, you will not loose much.
So, guys, such neutral conclusion on this week… Still don’t be upset too much, situation changes quickly now.
The technical portion of Sive's analysis owes a great deal to Joe DiNapoli's methods, and uses a number of Joe's proprietary indicators. Please note that Sive's analysis is his own view of the market and is not endorsed by Joe DiNapoli or any related companies.


")