Sive Morten
Special Consultant to the FPA
- Messages
- 18,699
Fundamentals
Reuters reports The dollar tumbled on Friday after a significantly weaker-than-expected U.S. jobs report that will increase speculation over whether the U.S. Federal Reserve holds off tightening monetary policy for longer than expected.
U.S. employers added the fewest jobs in more than a year in March amid signs the economy has been hurt by the dollar's climb to multi-year highs.
Non-farm payrolls rose by 126,000 last month, the smallest gain since December 2013, and well under the 245,000 economists had forecast. The unemployment rate held at a 6-1/2 year low of 5.5 percent.
"This (data) might put back your expectations for a Fed hike of 25 basis points to later in the year rather than June. It moves us toward September," said Daniel Morris, global investment strategist at TIAA-CREF in New York.
The euro shot up over 1 percent after the report to a one week high of $1.10270 before drifting to $1.09750, a gain of 0.88 percent on the EBS trading platform .
Trading volumes were very thin owing to the Easter holiday weekend that has much of Europe closed and skeletal staffing at U.S. banks. U.S. stock markets are closed.
"I'm not pushing the panic button yet. It is still a Q1 number. I don't think the Fed will either. We're not getting a clean read on the economy yet. We had a bad winter for most of the Northeast and any clean read for the economy will come in the next couple of months," said Win Thin, currency strategist at Brown Brothers Harriman in New York.
Against the Japanese yen, the dollar hit a one-week low of 118.71 yen before settling around 119, off 0.58 percent on the day. The greenback dropped to five-week nadir of 0.94860 Swiss franc .
"Slightly weaker U.S. growth means the dollar is not as strong, but on the other hand the ECB is printing a lot of money and that will matter more eventually. This is a small deviation on the path toward reaching parity. Our forecast for 2015 is $1.05, and for 2016 it is $0.90,” said Morris.
In a holiday-shortened bond trading session, the 10-year benchmark U.S. Treasury yield fell to a near two-month low of 1.802 percent. Trading closed with the yield at 1.84 percent.
CFTC data shows lazy growth of open interest during recent 2 months. Simultaneously on 31st of March long positions has dropped significantly to just 40K contracts, while shorts oppositely have increased to 265 K. It leads to crucial numbers of balance between longs and shorts to 86%. This, in turn significantly increases chances of retracement up. And recent NFP data is more than just welcome for this purpose.
Open interest:
 Shorts:
 Longs:

On coming week NFP data and market reaction on it will be probably in focus and some other concerns will move on second stage. But as soon as euphoria around NFP will calm down – we again will have to monitor Greece situation, EU domestic policy - it’s growing tensions in opinions among countries and Ukraine of cause.
NFP data could trigger upside action, but mostly it will be just a retracement, although this retracement could become not really small. Since this is just one weak numbers in a row of 200K+ releases.
Speaking about other questions, they are not disappeared. Disagreement among EU members on external relations with US and Russia looks as worrying factor of political stability. Some experts write that as Maidan in Frankfurt as recent German’s plane crush are warnings to Merkel from US and attempt to prevent her from any steps to drive own policy and hold Germany under US “protection” (read “occupation”). It is very clear to understand – union of Russia and Germany is financial death for US. Strong economical, logistic integration of Germany and Russia is nightmare for US economy. That is what they try to avoid with all tools that they have. Ukraine is just one of these tools.
Concerning Ukraine – nobody believes that current peace will hold for considerable time and even American expects tell that it will be broken in April, somewhere between Orthodox Easter and 9th of May – Victory day in WWII. Breaking of Minsk agreement automatically will lead to new sanctions because borders between conflict sides will change. And this will lead to another spiral of instability, as outside of EU as inside, since more and more people and some EU countries call for own independence policy in Russia relations.
US try to force EU to pay for this conflict. Just for instance is recent question on gas settlement. The point is that Ukraine has consumed all gas in storages. But this gas is crucial for creation necessary pressure in tube to make delivery possible. Without this gas transfer to EU is impossible. Now with protection from US it requires $2Bln from EU to restore gas storages, otherwise transfer will be stopped. Pure blackmail…
There are a lot of other issues where US tries to shift financial burden from Russia’s confrontation on EU. The brightest example is sanctions. Losses from this issue are incomparable for EU and US. Second is army forces. US try to burn flame of big conflict in Europe but they will not send their own troops there. European people, EU troops will pull the chestnuts out of the fire for US… As result we think that contradiction around this situation will continue to grow. That’s being said overall situation looks not very supportive for EUR and NFP is just short episode that may be will lead to short-term retracement.
Technicals
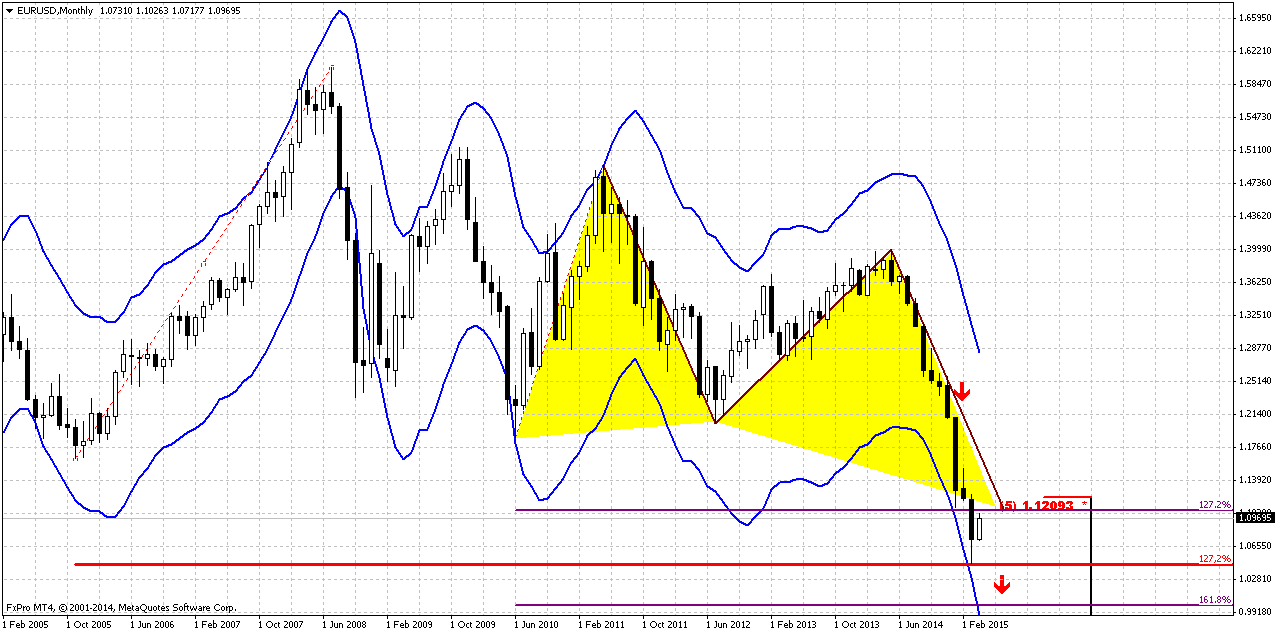
Monthly
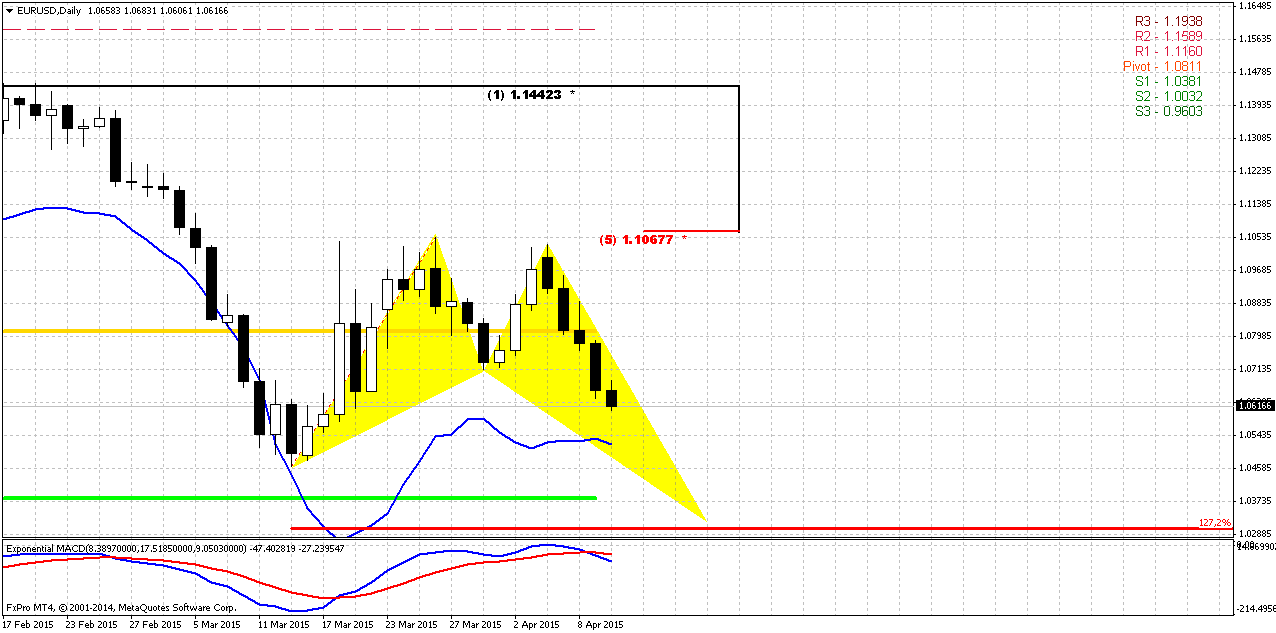
The first concern that has to be resolved is why market has stopped particularly here, at 1.05. This is not Fib support, market already has passed through 1.27 extension of Butterfly and it would be logical to suggest that it should continue move to parity and 1.618 butterfly extension. But it has stopped right here…
Yes, we have monthly oversold, but, guys, we have another object that looks extremely important. This is 1.27 extension of huge upside swing in 2005-2008 that also has created awful butterfly pattern. Recent action does not quite look like normal butterfly wing, but extension is valid and 1.05 is precisely 1.27 ratio.
Now think what do we have – market at 1.27 butterfly target and oversold, CFTC data shows overextension of shorts positions and NFP shows very bad data. This smells like solid upside retracement.
Another very important moment here is recent thrust down. Take a look – it is perfect for DiNapoli directional pattern, say, B&B “Sell”, or even DRPO… but B&B seems more probable. You can imagine what B&B means on monthly chart – large swings, definite direction of trading for weeks. Retracement up has no limitation from monthly overbought level.
Still, our next target stands the same – parity as 1.618 completion point of recent butterfly.
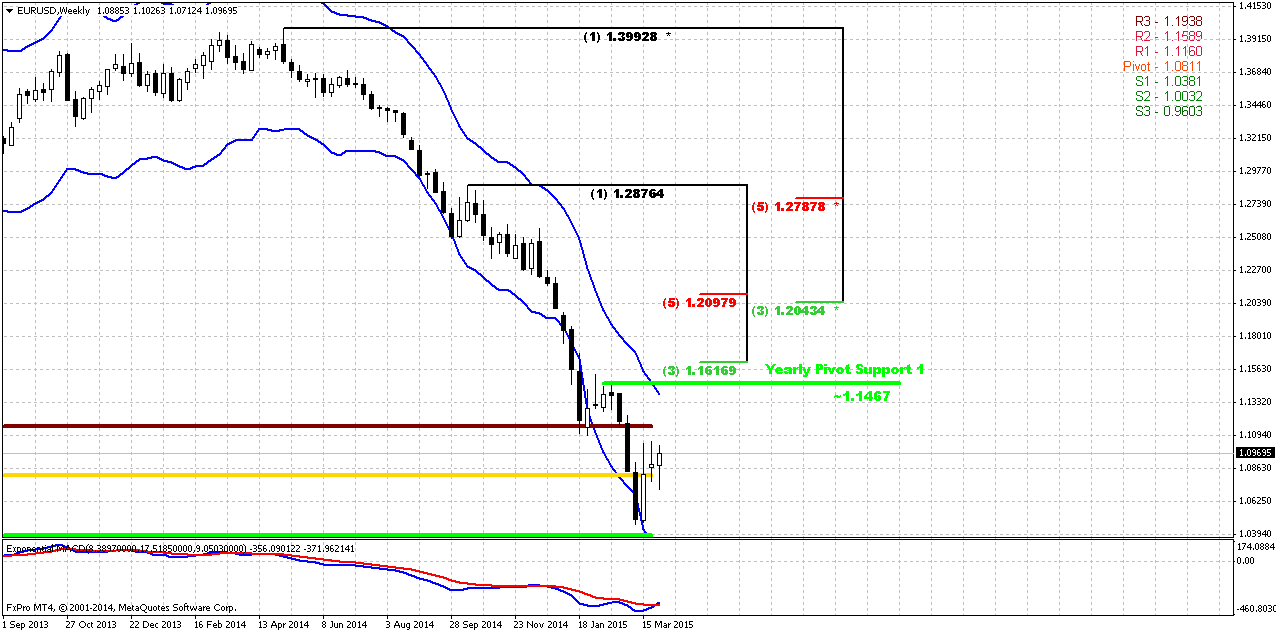
Weekly
Any monthly retracement probably should start from some clear weekly pattern. Trend has turned bullish, market has hit oversold and formed something that looks like bullish engulfing. But this is not the pattern that we’re looking for. We need extended one – either DiNapoli, or harmonic. Pay attention that within whole thrust down since it’s beginning in April 2014 market never has completed 3/8 retracement. Other words this thrust was not interrupted by retracement. It means, in turn, that we also can watch here for DRPO “Buy”.
Here we have to separate two different targets. Monthly target will stand probably around 1.20 area. This is K-resistance and former low of July 2012 (take a look at monthly). This is very strong resistance. Besides, if it will be B&B “Sell” on monthly this level most suitable for this purpose.
Short-term target will stand somewhere around 1.15 – weekly overbought, Fib resistance and broken YPR1. Depending on patterns that we have on lower charts we will try to estimate target with more precision.
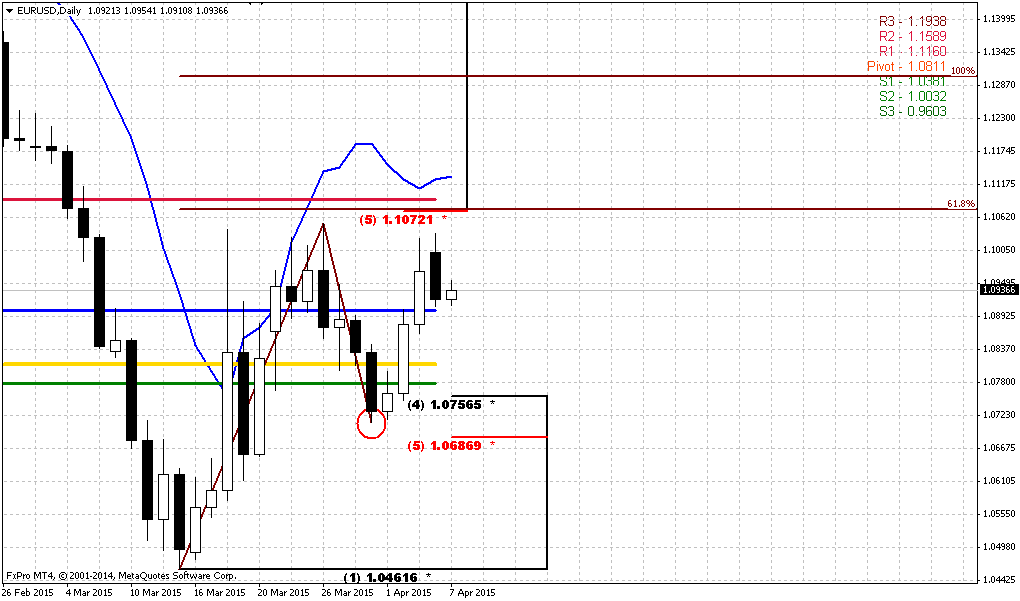
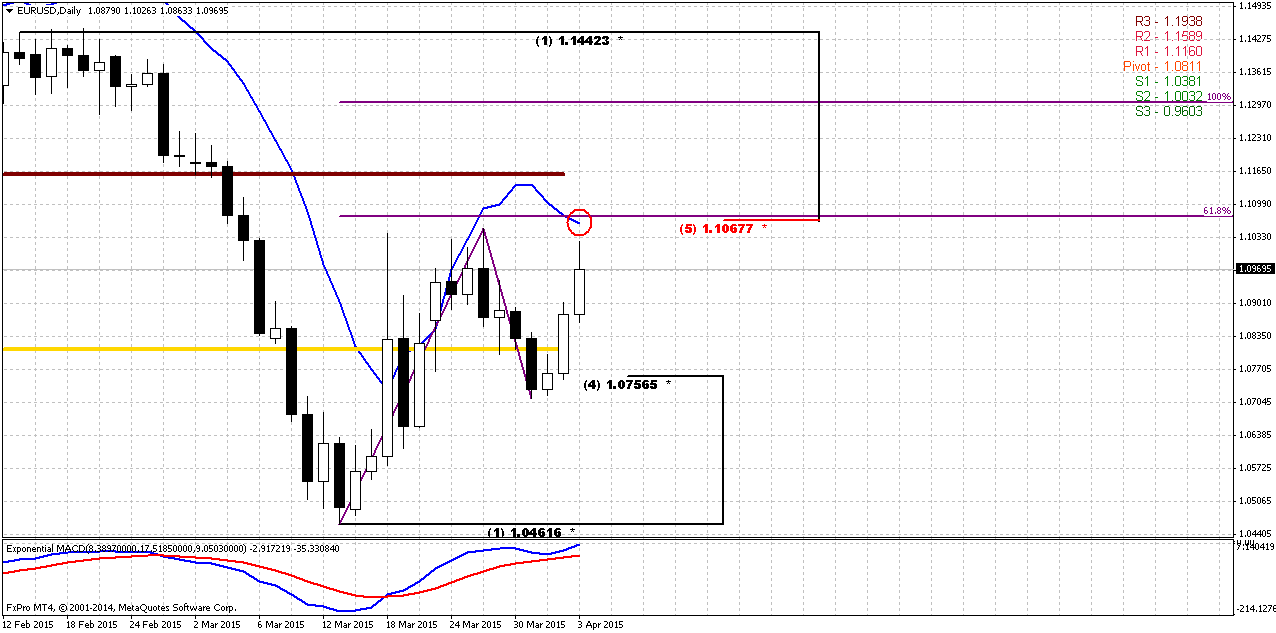
Daily
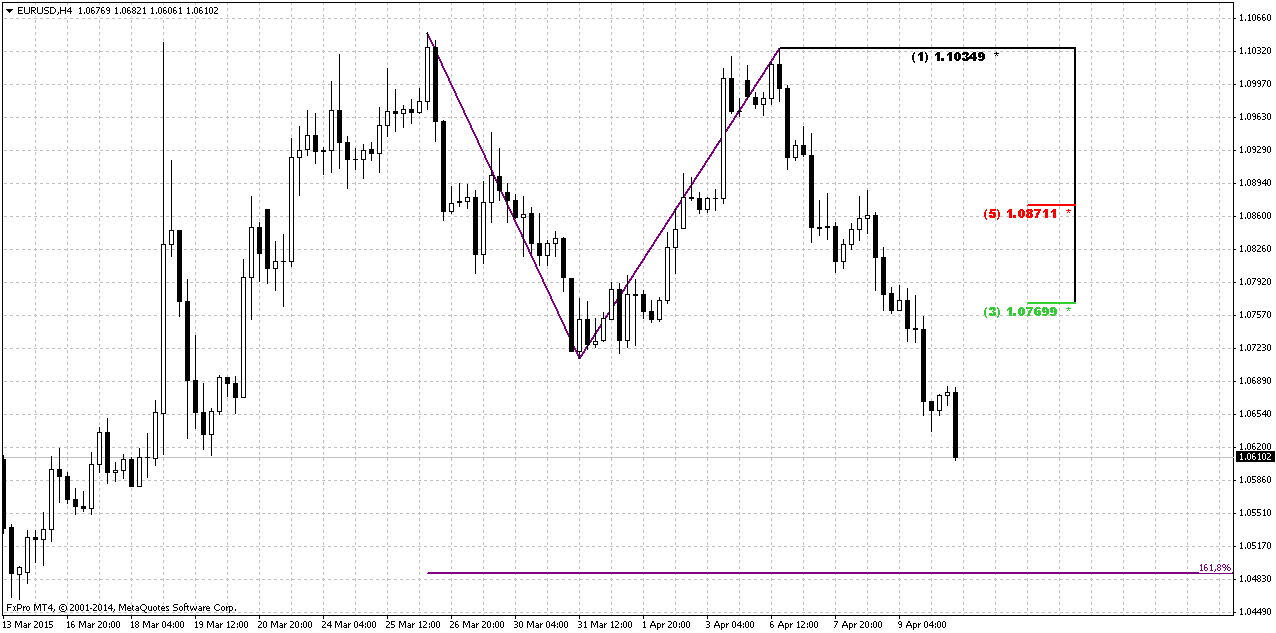
Daily trend stands bullish. Market right now shows attempt to create AB=CD upside retracement. Due NFP release CD leg looks faster and this increases chances on further upside continuation. Final AB=CD target stands in Agreement with weekly resistance area, while it is a bit too extended for daily chart and hardly will be completed on coming week.
Recent action suggests that most part of coming week we will deal with retracement down. Take a look 1.107 area is strong resistance – 0.618 extension target, Fib level (i.e. Agreement) and overbought. So, this is potential context for bearish “Stretch” pattern. So after market will hit this level we should be ready for retracement down inside of CD leg. After retracement will take place upward action should continue, since as we’ve said above current situation supports chance on solid upside retracement.
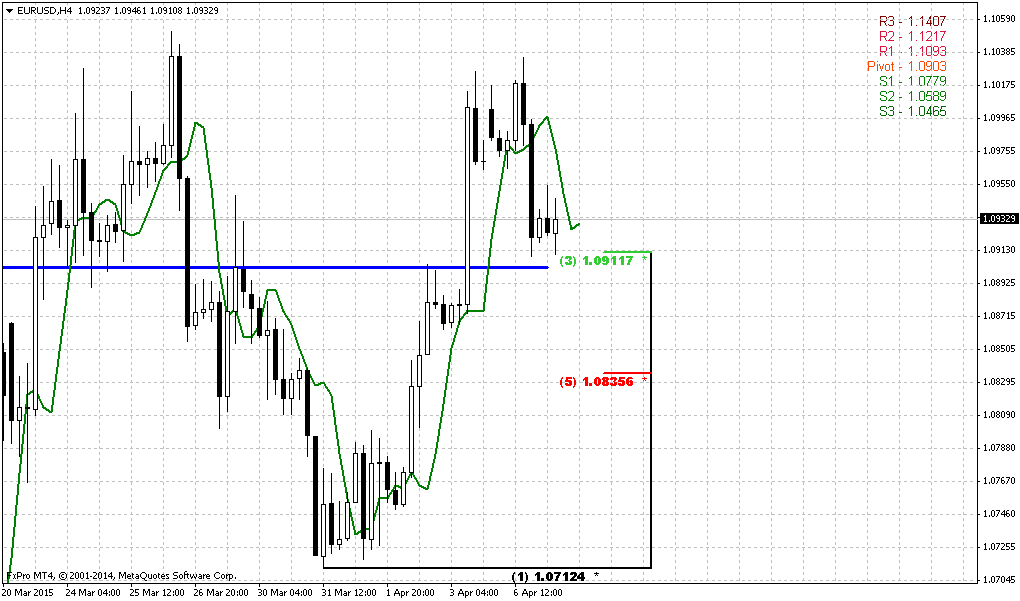
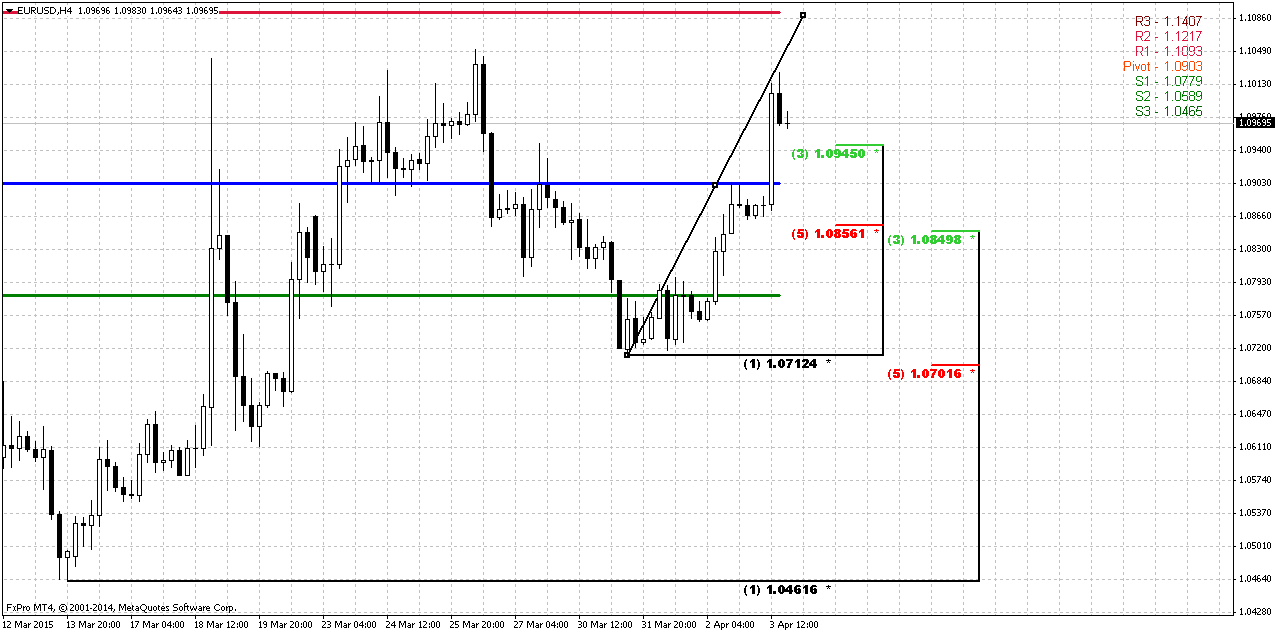
4-Hour
Daily target also coincides with WPR1, so it will be really strong resistance that probably will bring pullback down. Most probable destination of this retracement is 1.085 K-support and WPP. Very probable that retracement down will start after W&R of recent highs when stops will be grabbed above them. So watch for possible RRT patterns or bearish engulfing. I’ve drawn Fib levels on perspective, assuming that market will reach WPR1.
Conclusion:
It seems that could join a big EUR journey on monthly chart. Currently it makes possible retracement to 1.20 level and in perspective could give us B&B “Sell”.
Meantime on coming week our trading plan suggests reaching of 1.1070 resistance first and downward retracement second, at least to 1.085 area. After that upside action should continue if global situation will not change drastically.
The technical portion of Sive's analysis owes a great deal to Joe DiNapoli's methods, and uses a number of Joe's proprietary indicators. Please note that Sive's analysis is his own view of the market and is not endorsed by Joe DiNapoli or any related companies.
Reuters reports The dollar tumbled on Friday after a significantly weaker-than-expected U.S. jobs report that will increase speculation over whether the U.S. Federal Reserve holds off tightening monetary policy for longer than expected.
U.S. employers added the fewest jobs in more than a year in March amid signs the economy has been hurt by the dollar's climb to multi-year highs.
Non-farm payrolls rose by 126,000 last month, the smallest gain since December 2013, and well under the 245,000 economists had forecast. The unemployment rate held at a 6-1/2 year low of 5.5 percent.
"This (data) might put back your expectations for a Fed hike of 25 basis points to later in the year rather than June. It moves us toward September," said Daniel Morris, global investment strategist at TIAA-CREF in New York.
The euro shot up over 1 percent after the report to a one week high of $1.10270 before drifting to $1.09750, a gain of 0.88 percent on the EBS trading platform .
Trading volumes were very thin owing to the Easter holiday weekend that has much of Europe closed and skeletal staffing at U.S. banks. U.S. stock markets are closed.
"I'm not pushing the panic button yet. It is still a Q1 number. I don't think the Fed will either. We're not getting a clean read on the economy yet. We had a bad winter for most of the Northeast and any clean read for the economy will come in the next couple of months," said Win Thin, currency strategist at Brown Brothers Harriman in New York.
Against the Japanese yen, the dollar hit a one-week low of 118.71 yen before settling around 119, off 0.58 percent on the day. The greenback dropped to five-week nadir of 0.94860 Swiss franc .
"Slightly weaker U.S. growth means the dollar is not as strong, but on the other hand the ECB is printing a lot of money and that will matter more eventually. This is a small deviation on the path toward reaching parity. Our forecast for 2015 is $1.05, and for 2016 it is $0.90,” said Morris.
In a holiday-shortened bond trading session, the 10-year benchmark U.S. Treasury yield fell to a near two-month low of 1.802 percent. Trading closed with the yield at 1.84 percent.
CFTC data shows lazy growth of open interest during recent 2 months. Simultaneously on 31st of March long positions has dropped significantly to just 40K contracts, while shorts oppositely have increased to 265 K. It leads to crucial numbers of balance between longs and shorts to 86%. This, in turn significantly increases chances of retracement up. And recent NFP data is more than just welcome for this purpose.
Open interest:
On coming week NFP data and market reaction on it will be probably in focus and some other concerns will move on second stage. But as soon as euphoria around NFP will calm down – we again will have to monitor Greece situation, EU domestic policy - it’s growing tensions in opinions among countries and Ukraine of cause.
NFP data could trigger upside action, but mostly it will be just a retracement, although this retracement could become not really small. Since this is just one weak numbers in a row of 200K+ releases.
Speaking about other questions, they are not disappeared. Disagreement among EU members on external relations with US and Russia looks as worrying factor of political stability. Some experts write that as Maidan in Frankfurt as recent German’s plane crush are warnings to Merkel from US and attempt to prevent her from any steps to drive own policy and hold Germany under US “protection” (read “occupation”). It is very clear to understand – union of Russia and Germany is financial death for US. Strong economical, logistic integration of Germany and Russia is nightmare for US economy. That is what they try to avoid with all tools that they have. Ukraine is just one of these tools.
Concerning Ukraine – nobody believes that current peace will hold for considerable time and even American expects tell that it will be broken in April, somewhere between Orthodox Easter and 9th of May – Victory day in WWII. Breaking of Minsk agreement automatically will lead to new sanctions because borders between conflict sides will change. And this will lead to another spiral of instability, as outside of EU as inside, since more and more people and some EU countries call for own independence policy in Russia relations.
US try to force EU to pay for this conflict. Just for instance is recent question on gas settlement. The point is that Ukraine has consumed all gas in storages. But this gas is crucial for creation necessary pressure in tube to make delivery possible. Without this gas transfer to EU is impossible. Now with protection from US it requires $2Bln from EU to restore gas storages, otherwise transfer will be stopped. Pure blackmail…
There are a lot of other issues where US tries to shift financial burden from Russia’s confrontation on EU. The brightest example is sanctions. Losses from this issue are incomparable for EU and US. Second is army forces. US try to burn flame of big conflict in Europe but they will not send their own troops there. European people, EU troops will pull the chestnuts out of the fire for US… As result we think that contradiction around this situation will continue to grow. That’s being said overall situation looks not very supportive for EUR and NFP is just short episode that may be will lead to short-term retracement.
Technicals
Monthly
The first concern that has to be resolved is why market has stopped particularly here, at 1.05. This is not Fib support, market already has passed through 1.27 extension of Butterfly and it would be logical to suggest that it should continue move to parity and 1.618 butterfly extension. But it has stopped right here…
Yes, we have monthly oversold, but, guys, we have another object that looks extremely important. This is 1.27 extension of huge upside swing in 2005-2008 that also has created awful butterfly pattern. Recent action does not quite look like normal butterfly wing, but extension is valid and 1.05 is precisely 1.27 ratio.
Now think what do we have – market at 1.27 butterfly target and oversold, CFTC data shows overextension of shorts positions and NFP shows very bad data. This smells like solid upside retracement.
Another very important moment here is recent thrust down. Take a look – it is perfect for DiNapoli directional pattern, say, B&B “Sell”, or even DRPO… but B&B seems more probable. You can imagine what B&B means on monthly chart – large swings, definite direction of trading for weeks. Retracement up has no limitation from monthly overbought level.
Still, our next target stands the same – parity as 1.618 completion point of recent butterfly.
Weekly
Any monthly retracement probably should start from some clear weekly pattern. Trend has turned bullish, market has hit oversold and formed something that looks like bullish engulfing. But this is not the pattern that we’re looking for. We need extended one – either DiNapoli, or harmonic. Pay attention that within whole thrust down since it’s beginning in April 2014 market never has completed 3/8 retracement. Other words this thrust was not interrupted by retracement. It means, in turn, that we also can watch here for DRPO “Buy”.
Here we have to separate two different targets. Monthly target will stand probably around 1.20 area. This is K-resistance and former low of July 2012 (take a look at monthly). This is very strong resistance. Besides, if it will be B&B “Sell” on monthly this level most suitable for this purpose.
Short-term target will stand somewhere around 1.15 – weekly overbought, Fib resistance and broken YPR1. Depending on patterns that we have on lower charts we will try to estimate target with more precision.
Daily
Daily trend stands bullish. Market right now shows attempt to create AB=CD upside retracement. Due NFP release CD leg looks faster and this increases chances on further upside continuation. Final AB=CD target stands in Agreement with weekly resistance area, while it is a bit too extended for daily chart and hardly will be completed on coming week.
Recent action suggests that most part of coming week we will deal with retracement down. Take a look 1.107 area is strong resistance – 0.618 extension target, Fib level (i.e. Agreement) and overbought. So, this is potential context for bearish “Stretch” pattern. So after market will hit this level we should be ready for retracement down inside of CD leg. After retracement will take place upward action should continue, since as we’ve said above current situation supports chance on solid upside retracement.
4-Hour
Daily target also coincides with WPR1, so it will be really strong resistance that probably will bring pullback down. Most probable destination of this retracement is 1.085 K-support and WPP. Very probable that retracement down will start after W&R of recent highs when stops will be grabbed above them. So watch for possible RRT patterns or bearish engulfing. I’ve drawn Fib levels on perspective, assuming that market will reach WPR1.
Conclusion:
It seems that could join a big EUR journey on monthly chart. Currently it makes possible retracement to 1.20 level and in perspective could give us B&B “Sell”.
Meantime on coming week our trading plan suggests reaching of 1.1070 resistance first and downward retracement second, at least to 1.085 area. After that upside action should continue if global situation will not change drastically.
The technical portion of Sive's analysis owes a great deal to Joe DiNapoli's methods, and uses a number of Joe's proprietary indicators. Please note that Sive's analysis is his own view of the market and is not endorsed by Joe DiNapoli or any related companies.