Sive Morten
Special Consultant to the FPA
- Messages
- 18,732
Monthly
Reuters reports that the dollar fell against other major currencies on Friday after rising in early trading even though U.S. data showed solid jobs gains for a second straight month. The March jobs report was generally in line with market expectations and eases the way for the Federal Reserve to keep cutting back its bond-buying program, analysts and strategists said. "The dollar on balance logged a bullish week thanks to steady signs of an improving U.S. economy, which stood in contrasts to growing expectations of potentially easier policy steps in Japan and Europe," said Joe Manimbo, senior market analyst at Western Union Business Solutions in Washington. "The numbers were sufficiently in line so the bigger picture isn't changed going forward for the Fed," said currency strategist Cameron Umetsu at UBS in Stamford, Connecticut. U.S. nonfarm payrolls increased by 192,000 jobs last month after rising 197,000 in February, the Labor Department said. The unemployment rate was unchanged at 6.7 percent, as Americans flooded the labor market. Economists polled by Reuters had expected employment to increase by 200,000 last month and the unemployment rate to fall one-tenth of a percentage point.
Some traders hoping the jobs data would be more robust were disappointed, though the report will likely encourage the Fed to continue reducing its massive monetary stimulus, a process known as tapering, according to Anthony Valeri, investment strategist at LPL Financial in San Diego. It's a Goldilocks report, not too warm and not too cold, and puts pressure on the next report in May to be good," Valeri said. "It doesn't change the pace of tapering and shows the economy is still on track." Next week's release on Wednesday of minutes from the latest Fed policy-making panel will be a focus of the currency market. "The greenback’s underlying story remains positive and will look for further support next week in Wednesday’s Fed minutes," Manimbo said. "Fed records that bolster the case for a rate hike next year would ... put another plank of support under the greenback."
EURO SETBACK
On Thursday the euro had hit a one-month low against the dollar after European Central Bank President Mario Draghi said the bank's Governing Council was unanimous in its commitment to also using "unconventional instruments within its mandate in order to cope effectively with risks of a too-prolonged period of low inflation." Unconventional instruments include quantitative easing - essentially printing money to buy assets. Some euro zone central bankers considered such measures highly undesirable until now.
Technical
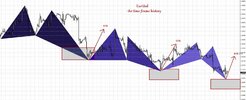
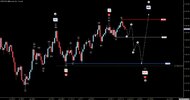
On monthly chart our major concern stands around breakout moment of 1.3830 Fib resistance and Agreement. That is also downward trendline. We see that market has challenged this level twice already, but still stands below it. On monthly chart 1.33-1.3850 area is an area of “indecision”. While market stands inside of it we can say neither upward breakout nor downward reversal. At least, reversal identification could be done with yearly pivot – if market will move below it, this could be early sign of changing sentiment. But, as you can see, nothing among this issues have happened yet.
Returning to discussion of Yearly Pivot - we’ve noted that upward bounce has started precisely from 1.3475 level. Now the major question stands as follows – whether this upward action is a confirmation of long-term bullish sentiment or just a respect of YPP first touch. Following the chart we see very useful combination for us – YPP stands very close to 1.33 – our invalidation point. And if market will move below YPP this will become bearish moment by itself.
Speaking about upward continuation, market mechanics does not allow price to show any deep retracement any more. Any move of this kind should be treated as market weakness and it will increase probability of reversal down. Take a look that as market has hit minor 0.618 AB-CD extension target right at rock hard resistance – Fib level and Agreement and former yearly PR1, it has shown reasonable bounce down to 1.33. As retracement after 0.618 target already has happened, it is unlogical and unreasonable to see another deep bounce and if it will happen - it will look suspicious.
In shorter-term perspective recent back action out from new highs...this is not good for bulls. Also it looks like W&R again. This action carries nothing positive in short-term perspective. Even if it will not lead to drastical reversal down, but it could trigger meaningful retracement. But if market will return right back to YPP – this will be done not just to test it again, right? In this case price could move lower...
Still, speaking about monthly upside targets... If this was real break through resistance, we have two major targets – AB=CD one around 1.44 and Yearly PR1 = 1.4205.
Thus, here we can make following conclusion – nothing drastical yet, but action is not very pleasant for bulls. It could trigger solid retracement down on lower time frames. Still, we can appoint working range for nearest perspective on monthly chart – this is probably an area between YPP=1.3475 and resistance around 1.3850 and in nearest time downward action looks more probable.

Weekly
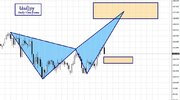
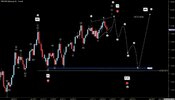
Trend here has turned bearish and former bullish stop grabber that was formed here on previous week was vanished by recent candle. Right now price stands at first 1.3710 Fib support and almost has reached MPS1. Price stands below MPP that tells about bearish sentiment.
There are two major moments to discuss. Personally I would treat current situation on monthly-weekly time frames as moderately bearish. Thus, if we will take a look at AB=CD upward pattern itself – it has much slower CD leg, mostly due long period standing right below 1.3850 resistance. When market has flat CD leg even at 0.618 target this tells about it’s weakness. Second is – we have bearish butterfly. This pattern has minimum target at 3/8 Fib support of all butterfly action and it stands around 1.35 K-support area and Yearly Pivot, right? Thus, currently I wouldn’t say that downward action has finished already. We can see, may be, some respect and bounce up as reaction on current support area, but after that some downward continuation should follow.
So, conclusion on weekly time frame stands as follows. Market has reached solid resistance level and the probability of retracement down still exists. Market has hit nearest 1.3710 level – first Fib support that we’ve pointed in our previous EUR research. So, we can meet upward retracement in the beginning of next week, but later price still could turn downside again. Right now our target of retracement here is 1.3475-1.3500 support cluster.

Daily
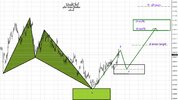
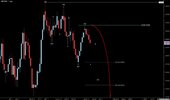
Trend is bearish here, market is not at oversold. On daily chart we can discuss only single issue and we’ve discussed yesterday. This is 3-Drive Buy pattern. Although we do not exclude possible deeper move down to 1.35 area in medium-term perspective, may be by larger daily AB=CD pattern. But right now, as we’ve said on weekly chart discussion – market has met support. This is K-support level around MPS1 and simultaneously formed 3-Drive Buy pattern. Minimum target of this pattern is top between 2nd and 3rd Drives, i.e. right around MPP. Invalidation point stands below 3rd drive. So if you will decide to deal with this pattern, it will be better to place stop somewhere below 1.3640 area, because it is not clear yet, whether market still will touch MPS1 before retracement up or not…

4-hour
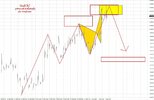
On intraday charts we do not have clear setup yet, since it is too few time has passed since NFP release. Still, I can’t exclude that we could see some attempt to reach MPS1 still before any upward retracement will start. Although crossing of 3-Drive pattern’s extensions was reached by price action. That’s why I’ve talked about stop placement somewhere below 1.3640 area. Reaching of MPS1 will not break 3-Drive pattern and in general short-term upward setup will be valid. Second moment here is target. Take a look on strong resistance around 3-Drive target – K-area, MPP, WPR1.

Conclusion:
While price stands in 1.33-1.38 area we can’t speak either on upward or downward breakout. Although in recent time situation looks more bearish rather than bullish – AB-CD up is weak, market has challenged twice 1.38 resistance area but failed and we have Butterfly “Sell” pattern on weekly. Although currently we are focused on nearest target around 1.35, but who knows… we can’t exclude reversal.
Speaking on 1 week perspective, we should be ready for upward retracement. Market has hit solid daily support and has formed 3-Drive “Buy” pattern. Those traders who do not want to trade this – better to not go against it and wait when this setup will work out.
The technical portion of Sive's analysis owes a great deal to Joe DiNapoli's methods, and uses a number of Joe's proprietary indicators. Please note that Sive's analysis is his own view of the market and is not endorsed by Joe DiNapoli or any related companies.
Reuters reports that the dollar fell against other major currencies on Friday after rising in early trading even though U.S. data showed solid jobs gains for a second straight month. The March jobs report was generally in line with market expectations and eases the way for the Federal Reserve to keep cutting back its bond-buying program, analysts and strategists said. "The dollar on balance logged a bullish week thanks to steady signs of an improving U.S. economy, which stood in contrasts to growing expectations of potentially easier policy steps in Japan and Europe," said Joe Manimbo, senior market analyst at Western Union Business Solutions in Washington. "The numbers were sufficiently in line so the bigger picture isn't changed going forward for the Fed," said currency strategist Cameron Umetsu at UBS in Stamford, Connecticut. U.S. nonfarm payrolls increased by 192,000 jobs last month after rising 197,000 in February, the Labor Department said. The unemployment rate was unchanged at 6.7 percent, as Americans flooded the labor market. Economists polled by Reuters had expected employment to increase by 200,000 last month and the unemployment rate to fall one-tenth of a percentage point.
Some traders hoping the jobs data would be more robust were disappointed, though the report will likely encourage the Fed to continue reducing its massive monetary stimulus, a process known as tapering, according to Anthony Valeri, investment strategist at LPL Financial in San Diego. It's a Goldilocks report, not too warm and not too cold, and puts pressure on the next report in May to be good," Valeri said. "It doesn't change the pace of tapering and shows the economy is still on track." Next week's release on Wednesday of minutes from the latest Fed policy-making panel will be a focus of the currency market. "The greenback’s underlying story remains positive and will look for further support next week in Wednesday’s Fed minutes," Manimbo said. "Fed records that bolster the case for a rate hike next year would ... put another plank of support under the greenback."
EURO SETBACK
On Thursday the euro had hit a one-month low against the dollar after European Central Bank President Mario Draghi said the bank's Governing Council was unanimous in its commitment to also using "unconventional instruments within its mandate in order to cope effectively with risks of a too-prolonged period of low inflation." Unconventional instruments include quantitative easing - essentially printing money to buy assets. Some euro zone central bankers considered such measures highly undesirable until now.
Technical
On monthly chart our major concern stands around breakout moment of 1.3830 Fib resistance and Agreement. That is also downward trendline. We see that market has challenged this level twice already, but still stands below it. On monthly chart 1.33-1.3850 area is an area of “indecision”. While market stands inside of it we can say neither upward breakout nor downward reversal. At least, reversal identification could be done with yearly pivot – if market will move below it, this could be early sign of changing sentiment. But, as you can see, nothing among this issues have happened yet.
Returning to discussion of Yearly Pivot - we’ve noted that upward bounce has started precisely from 1.3475 level. Now the major question stands as follows – whether this upward action is a confirmation of long-term bullish sentiment or just a respect of YPP first touch. Following the chart we see very useful combination for us – YPP stands very close to 1.33 – our invalidation point. And if market will move below YPP this will become bearish moment by itself.
Speaking about upward continuation, market mechanics does not allow price to show any deep retracement any more. Any move of this kind should be treated as market weakness and it will increase probability of reversal down. Take a look that as market has hit minor 0.618 AB-CD extension target right at rock hard resistance – Fib level and Agreement and former yearly PR1, it has shown reasonable bounce down to 1.33. As retracement after 0.618 target already has happened, it is unlogical and unreasonable to see another deep bounce and if it will happen - it will look suspicious.
In shorter-term perspective recent back action out from new highs...this is not good for bulls. Also it looks like W&R again. This action carries nothing positive in short-term perspective. Even if it will not lead to drastical reversal down, but it could trigger meaningful retracement. But if market will return right back to YPP – this will be done not just to test it again, right? In this case price could move lower...
Still, speaking about monthly upside targets... If this was real break through resistance, we have two major targets – AB=CD one around 1.44 and Yearly PR1 = 1.4205.
Thus, here we can make following conclusion – nothing drastical yet, but action is not very pleasant for bulls. It could trigger solid retracement down on lower time frames. Still, we can appoint working range for nearest perspective on monthly chart – this is probably an area between YPP=1.3475 and resistance around 1.3850 and in nearest time downward action looks more probable.

Weekly
Trend here has turned bearish and former bullish stop grabber that was formed here on previous week was vanished by recent candle. Right now price stands at first 1.3710 Fib support and almost has reached MPS1. Price stands below MPP that tells about bearish sentiment.
There are two major moments to discuss. Personally I would treat current situation on monthly-weekly time frames as moderately bearish. Thus, if we will take a look at AB=CD upward pattern itself – it has much slower CD leg, mostly due long period standing right below 1.3850 resistance. When market has flat CD leg even at 0.618 target this tells about it’s weakness. Second is – we have bearish butterfly. This pattern has minimum target at 3/8 Fib support of all butterfly action and it stands around 1.35 K-support area and Yearly Pivot, right? Thus, currently I wouldn’t say that downward action has finished already. We can see, may be, some respect and bounce up as reaction on current support area, but after that some downward continuation should follow.
So, conclusion on weekly time frame stands as follows. Market has reached solid resistance level and the probability of retracement down still exists. Market has hit nearest 1.3710 level – first Fib support that we’ve pointed in our previous EUR research. So, we can meet upward retracement in the beginning of next week, but later price still could turn downside again. Right now our target of retracement here is 1.3475-1.3500 support cluster.

Daily
Trend is bearish here, market is not at oversold. On daily chart we can discuss only single issue and we’ve discussed yesterday. This is 3-Drive Buy pattern. Although we do not exclude possible deeper move down to 1.35 area in medium-term perspective, may be by larger daily AB=CD pattern. But right now, as we’ve said on weekly chart discussion – market has met support. This is K-support level around MPS1 and simultaneously formed 3-Drive Buy pattern. Minimum target of this pattern is top between 2nd and 3rd Drives, i.e. right around MPP. Invalidation point stands below 3rd drive. So if you will decide to deal with this pattern, it will be better to place stop somewhere below 1.3640 area, because it is not clear yet, whether market still will touch MPS1 before retracement up or not…

4-hour
On intraday charts we do not have clear setup yet, since it is too few time has passed since NFP release. Still, I can’t exclude that we could see some attempt to reach MPS1 still before any upward retracement will start. Although crossing of 3-Drive pattern’s extensions was reached by price action. That’s why I’ve talked about stop placement somewhere below 1.3640 area. Reaching of MPS1 will not break 3-Drive pattern and in general short-term upward setup will be valid. Second moment here is target. Take a look on strong resistance around 3-Drive target – K-area, MPP, WPR1.

Conclusion:
While price stands in 1.33-1.38 area we can’t speak either on upward or downward breakout. Although in recent time situation looks more bearish rather than bullish – AB-CD up is weak, market has challenged twice 1.38 resistance area but failed and we have Butterfly “Sell” pattern on weekly. Although currently we are focused on nearest target around 1.35, but who knows… we can’t exclude reversal.
Speaking on 1 week perspective, we should be ready for upward retracement. Market has hit solid daily support and has formed 3-Drive “Buy” pattern. Those traders who do not want to trade this – better to not go against it and wait when this setup will work out.
The technical portion of Sive's analysis owes a great deal to Joe DiNapoli's methods, and uses a number of Joe's proprietary indicators. Please note that Sive's analysis is his own view of the market and is not endorsed by Joe DiNapoli or any related companies.


