jerry mtini
Private
- Messages
- 12
amazing
Hi Sive
I've been following your signals for a long time but never posted before. Your signals are just about always "on the ball"! You can't legislate for sudden news events like the Portugese crisis on Monday so Monday's fall was completely unexpected. I lost 100 pips so it it definately caught me by suprise!
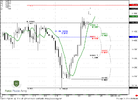
Anyway I got it all back today because I knew what you said about the "stop hunt" (stops above 1.4500) would come about about eventually. Greed is what it's all about in this game - as you said!!
Kind Regards
Jerry
Hi Sive
I've been following your signals for a long time but never posted before. Your signals are just about always "on the ball"! You can't legislate for sudden news events like the Portugese crisis on Monday so Monday's fall was completely unexpected. I lost 100 pips so it it definately caught me by suprise!
Anyway I got it all back today because I knew what you said about the "stop hunt" (stops above 1.4500) would come about about eventually. Greed is what it's all about in this game - as you said!!
Kind Regards
Jerry
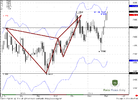
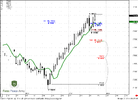
") of bears .. and confident .. another trade i take on AUd/Jpy .. its not harmonic .. Trading the Price action Actually
of bears .. and confident .. another trade i take on AUd/Jpy .. its not harmonic .. Trading the Price action Actually