Sive Morten
Special Consultant to the FPA
- Messages
- 18,681
Monthly
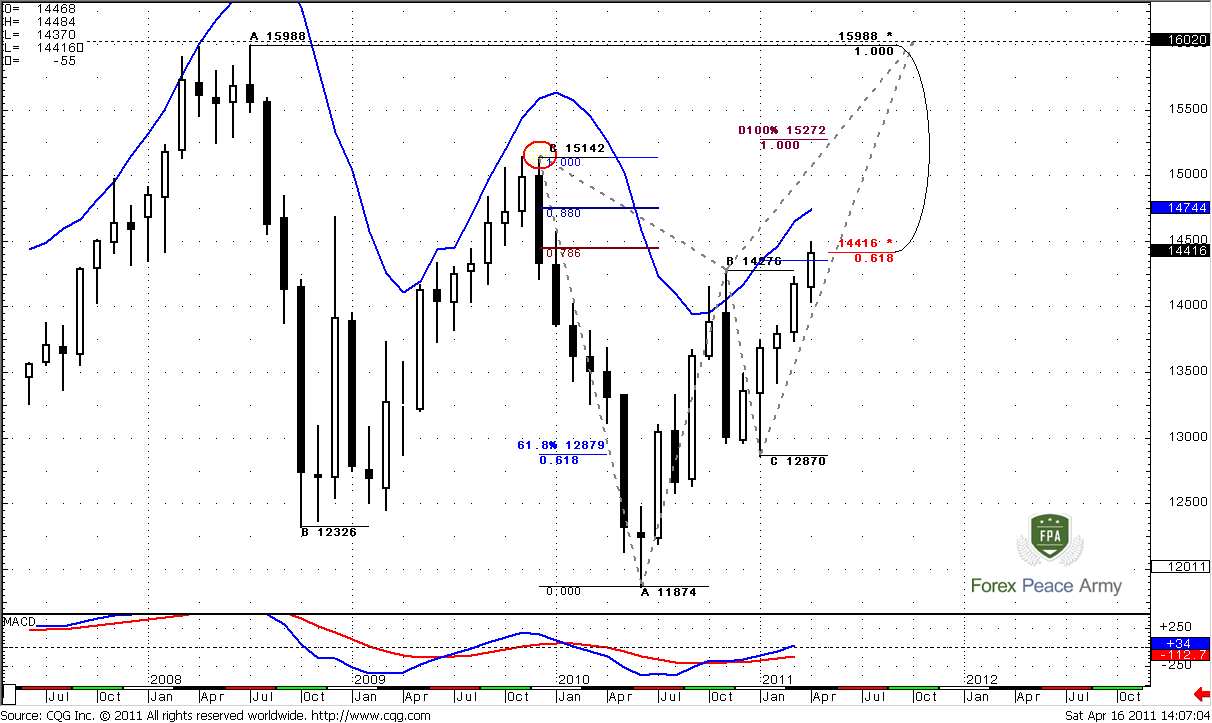
Today we will take a look at long-term perspective from another side. As we can see, market has taken out the highs at 1.4276 and totally negated long nasty black candle. Also market has reached an Agreement area around 1.4354-1.4416. Here you can see how long-term Fib levels act – market could penetrate them rather deep, but in general, we can see that this level still holds. See – market has closed right at 1.4416. Here is by the way 0.786 Fib resistance also from most recent swing down. Now market struggles with this area.
Monthly overbought area stands at 1.4744 – it’s not so far from current price action and it coincides with 0.88 Fib resistance. I suspect that this will be another level of resistance and nearest target.
But now, friends, I offer you to look at larger picture. Look at huge ABC-top pattern that has started from historical high at 1.5988. We see, that market has reached just 0.618 target from it although it has been acceded a bit. So, in terms of this ABC pattern – its “C” point at 1.5142 has an extremely importance. If market will take out this level then it will erase this ABC pattern. And this, in turn, will be extremely bullish sign – road to further upside move will become opened. This scenario, possibly already has started to materialize – see butterfly “Sell” pattern on this chart. The target of this pattern is 1.27 extension at 1.6020.
In fact, this view is a bullish one, and now this is a dominating view.
You can ask – and what about bearish view? I think, that we can start to speak about it, only when & if market will move below 1.2870 level and will not be able to break 1.4420 resistance level. Also I prefer to see trend shifting on bearish side.
Weekly
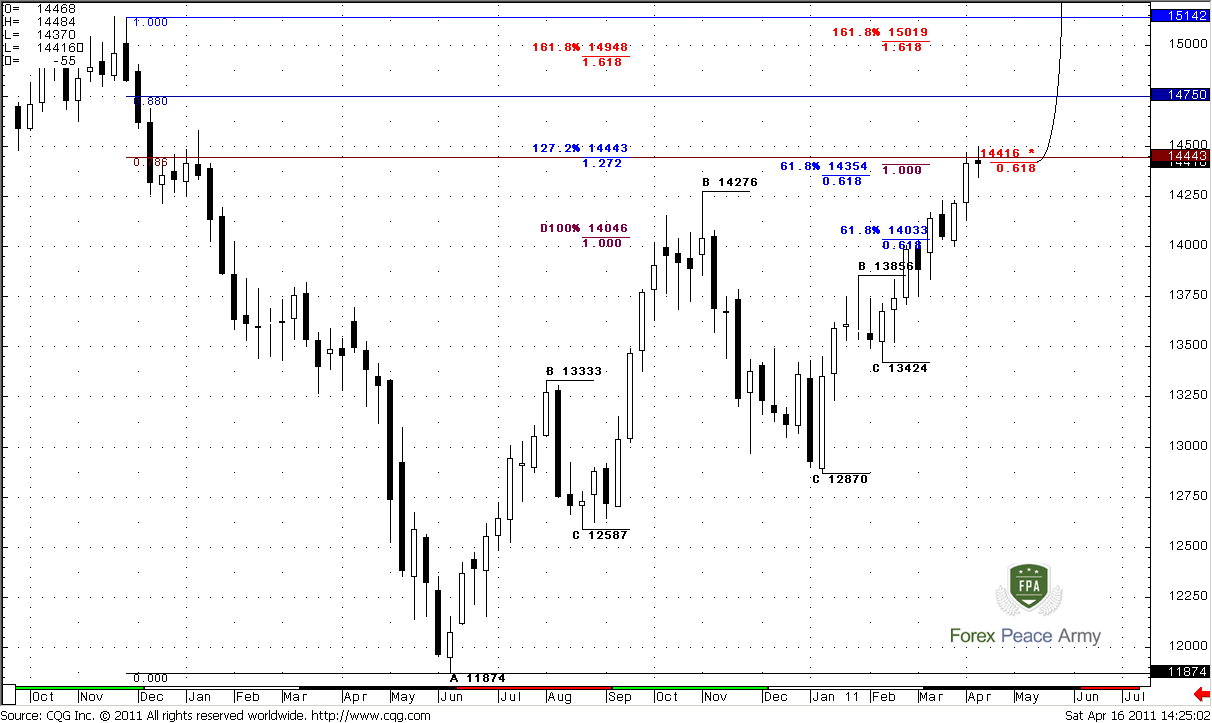
Previous week has very limited trading range, so it looks like doji on weekly time frame. That’s why on the chart #1 we see almost the same picture as during previous week. Market stands at really strong resistance – 5/8 major Fib resistance, 0.786 Fib resistance that are also multiple Agreements with different targets from different AB-CD patterns. Speaking definitely –three different targets stand near this area. And market, in fact, holds between them – 1.4350-1.4440. Currently I do not see any signs of breakout yet. But particularly existence of strong resistance could give us excellent Directional pattern with solid potential.
#1
Take a look at chart #2.
Trend is strongly bullish and will remain bullish till 1.3835-1.3877 weekly Confluence support area – MACDP will move a bit higher, when market will start retracement down.
We have an excellent thrust up that tells us couple important things. First, this thrust could be a context for possible directional signal – DRPO “Sell” or B&B, for instance. And such kinds of signals on weekly time frames promise solid moves. Second – it tells us, that there was no solid retracement yet – not even 3/8 during whole thrust up. Hence, there are a lot of stops very close to market. And, as we’ve said, market stands at area of resistance. From the bullish perspective – B&B is a preferable pattern; here market could show retracement till 1.40-1.41 area. For bears – DRPO is a preferable pattern. Also both of support areas coincide with monthly pivot levels that add them even more strength.
#2
Daily
Well, guys, we’ve just kicked around this topic here already. Whole week I’ve said that market could and should break 1.45 and blah-blah-blah... and so what? Nothing, market continues coiling around 1.4450-1.45 area. What could I say? Only the same thing - I still believe that 1.45 should be cleared out at least. It’s very rare, when market makers leave some important level and don’t grab stops. Sometimes it happens, but the probability of this event on the other side. Greed is very strong power – public stops should be grabbed.
That’s why I will not even think about enter on the short side until I see Wash&Rinse of 1.45 highs. Now let’s take a look at technical issue also.
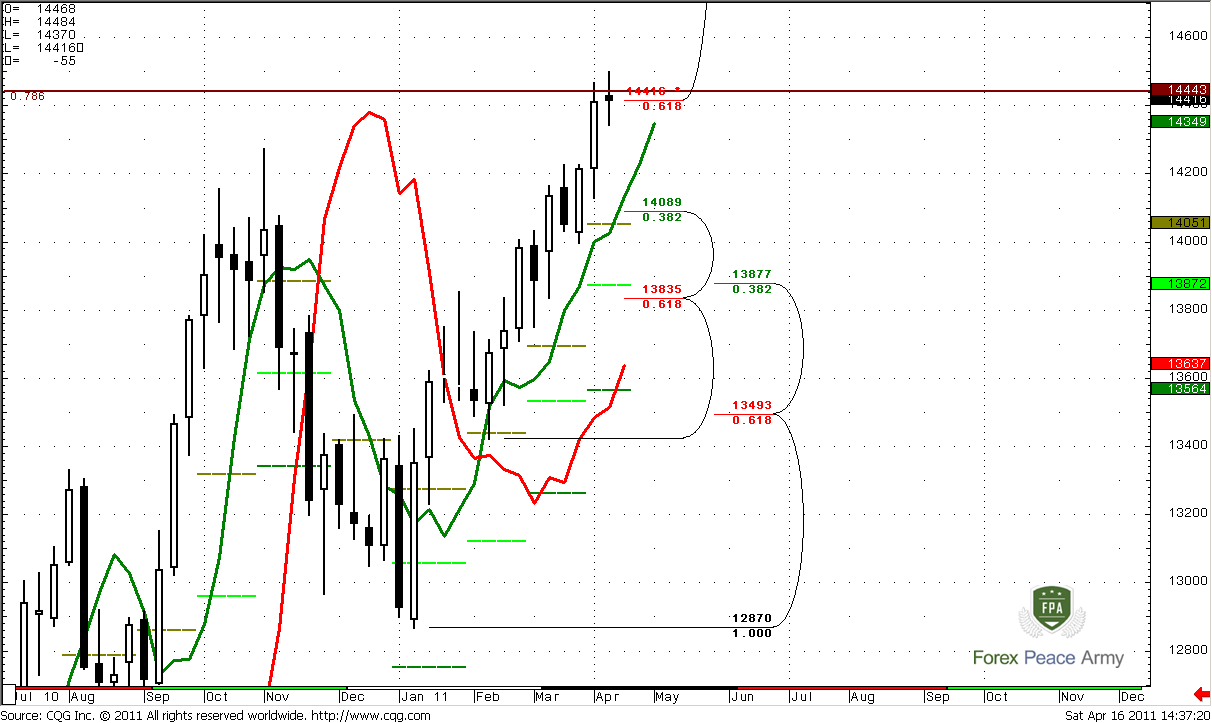
As we already know – market has hit multiple targets at multiple time frames – here I show you another one. And what has happened? Nothing. Market just stands in tight range and didn’t even a bounce to the downside. It’s curious in terms on normal price action.
Second, market stands above the pivot whole week. Yes it has shown some intraday down thrusts, but none of them has reached pivot point. Hence – market has no intention to move lower, at least currently.
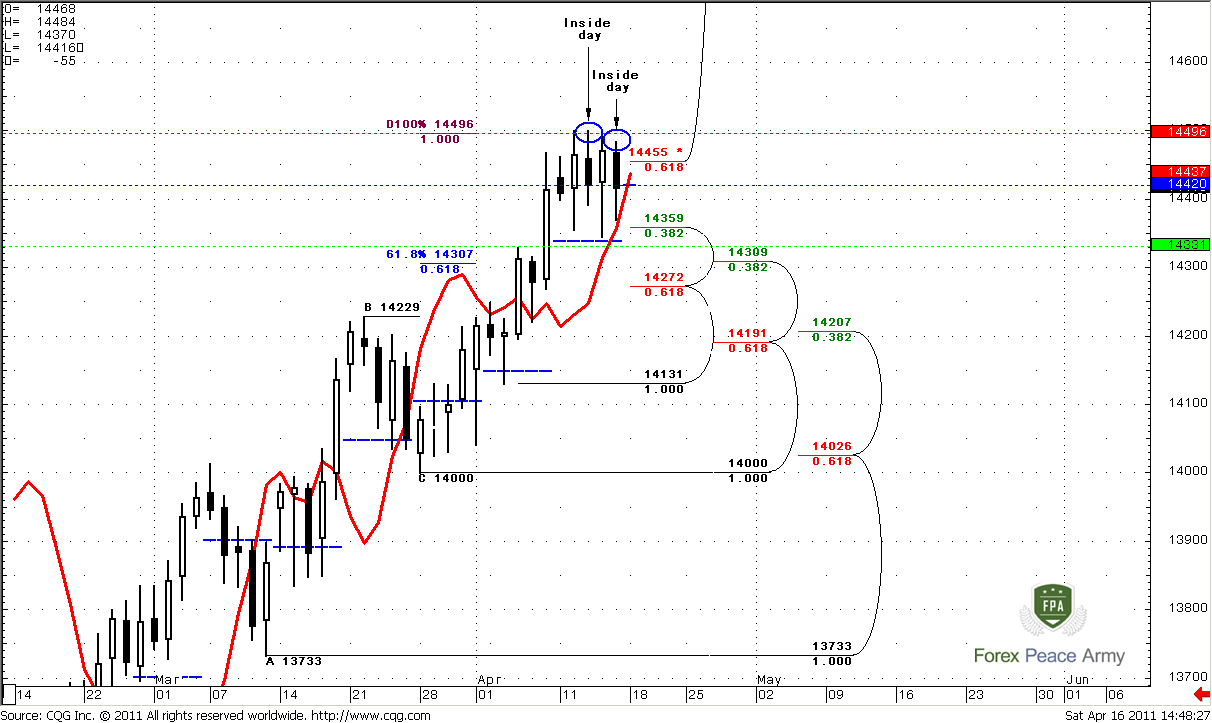
Third, look directly at price action itself – two inside days in a row – on Friday and on Wednesday. I can say, that it tells us – “Be Aware of strong move in some direction”. Inside days do not tell us the direction, they just warn us about possible strong explosive move that should happen sooner rather than later. Understand, current price action tells that market is accumulating the energy – this energy should released someday. And it should happen soon.
Forth, trend is still bullish at all time frames.
Due to tight price action on previous weeks, pivot points stand very close to each other. By the way – market has closed very close to pivot at 1.4420. So, beginning of the week could tell us something about market sentiment.
Intraday
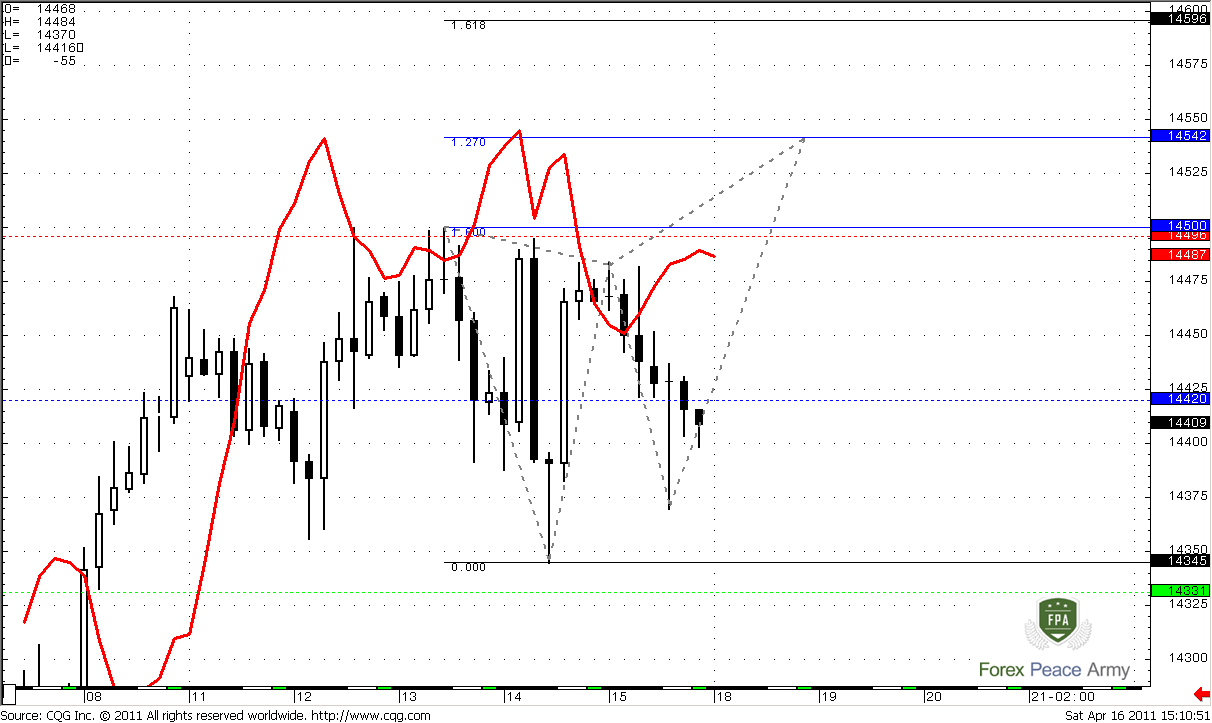
On 4-hour chart #1 you see the same stuff that was on Friday. Our Butterfly “sell” pattern is still valid. Its nearest target is 1.27 at 1.4542. At some case I also draw 1.618 target at 1.4596 – may be market will show explosive thrust, who knows…
Here you also can see how market struggle with trend direction. While trend holds bearish, market action does not support it and just stands in the range. This is bullish sign.
Meantime the attractiveness of Butterfly now is greater that on Friday. Because market stands at much lower level and we can place much tighter stop if intend to trade it.
#1
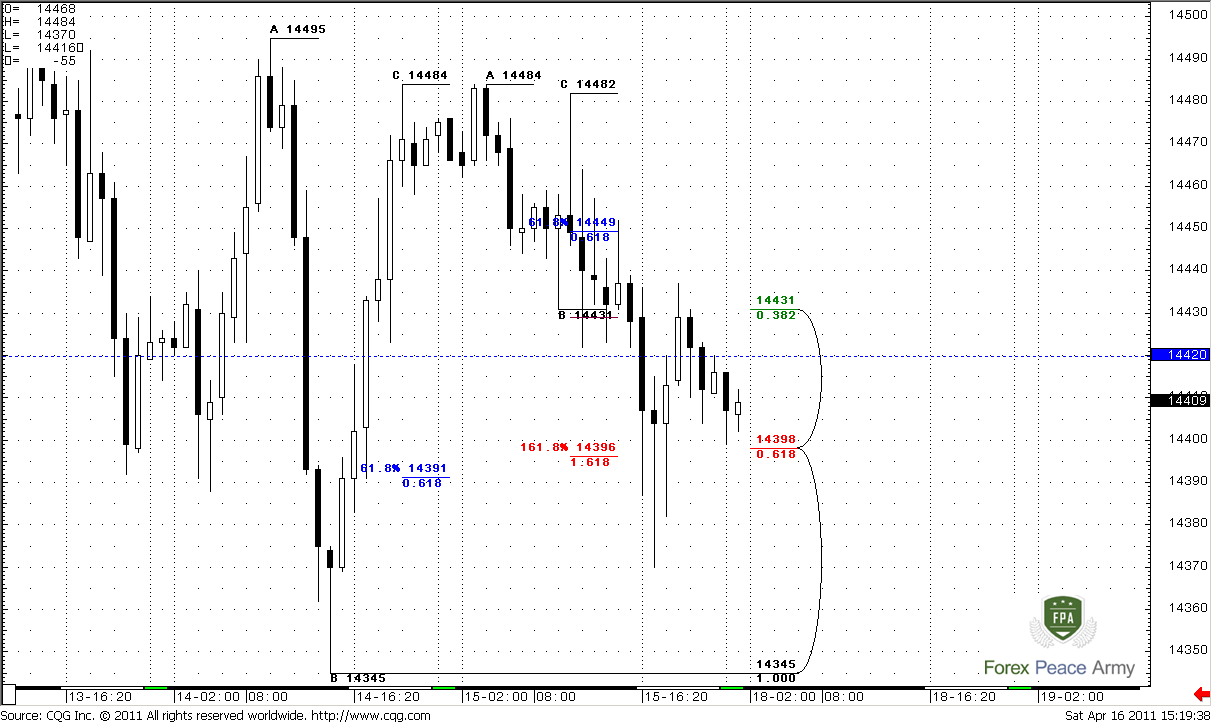
On hourly chart #2 we see some details of down thrust. Market has hit solid support area – Fib support and couple of targets. If they will hold it and market will move above pivot 1.4420 on Monday, then possibly Butterfly will employ as we expect…
#2
Conclusion:
Position traders:
Hold longs.
Intraday traders:
It’s obvious that market is building energy for future breakout. Price action suggests that this breakout more probable will be to the upside. Still, trading in such choppy environment is very risky business. Try to open positions near to some significant levels that will allow you to place tight stops. Reduce position value.
Speaking about particular Butterfly pattern – we can try to enter long with tight stop, somewhere near to 1.4340-1.4350 area, because if market will take this low – butterfly will be canceled.
It’s preferable to wait, when market will move above 1.4420 weekly pivot on Monday, and will hold there. Don’t be long, if market will hold below pivot point.
The technical portion of Sive's analysis owes a great deal to Joe DiNapoli's methods, and uses a number of Joe's proprietary indicators. Please note that Sive's analysis is his own view of the market and is not endorsed by Joe DiNapoli or any related companies.
Today we will take a look at long-term perspective from another side. As we can see, market has taken out the highs at 1.4276 and totally negated long nasty black candle. Also market has reached an Agreement area around 1.4354-1.4416. Here you can see how long-term Fib levels act – market could penetrate them rather deep, but in general, we can see that this level still holds. See – market has closed right at 1.4416. Here is by the way 0.786 Fib resistance also from most recent swing down. Now market struggles with this area.
Monthly overbought area stands at 1.4744 – it’s not so far from current price action and it coincides with 0.88 Fib resistance. I suspect that this will be another level of resistance and nearest target.
But now, friends, I offer you to look at larger picture. Look at huge ABC-top pattern that has started from historical high at 1.5988. We see, that market has reached just 0.618 target from it although it has been acceded a bit. So, in terms of this ABC pattern – its “C” point at 1.5142 has an extremely importance. If market will take out this level then it will erase this ABC pattern. And this, in turn, will be extremely bullish sign – road to further upside move will become opened. This scenario, possibly already has started to materialize – see butterfly “Sell” pattern on this chart. The target of this pattern is 1.27 extension at 1.6020.
In fact, this view is a bullish one, and now this is a dominating view.
You can ask – and what about bearish view? I think, that we can start to speak about it, only when & if market will move below 1.2870 level and will not be able to break 1.4420 resistance level. Also I prefer to see trend shifting on bearish side.
Weekly
Previous week has very limited trading range, so it looks like doji on weekly time frame. That’s why on the chart #1 we see almost the same picture as during previous week. Market stands at really strong resistance – 5/8 major Fib resistance, 0.786 Fib resistance that are also multiple Agreements with different targets from different AB-CD patterns. Speaking definitely –three different targets stand near this area. And market, in fact, holds between them – 1.4350-1.4440. Currently I do not see any signs of breakout yet. But particularly existence of strong resistance could give us excellent Directional pattern with solid potential.
#1
Take a look at chart #2.
Trend is strongly bullish and will remain bullish till 1.3835-1.3877 weekly Confluence support area – MACDP will move a bit higher, when market will start retracement down.
We have an excellent thrust up that tells us couple important things. First, this thrust could be a context for possible directional signal – DRPO “Sell” or B&B, for instance. And such kinds of signals on weekly time frames promise solid moves. Second – it tells us, that there was no solid retracement yet – not even 3/8 during whole thrust up. Hence, there are a lot of stops very close to market. And, as we’ve said, market stands at area of resistance. From the bullish perspective – B&B is a preferable pattern; here market could show retracement till 1.40-1.41 area. For bears – DRPO is a preferable pattern. Also both of support areas coincide with monthly pivot levels that add them even more strength.
#2
Daily
Well, guys, we’ve just kicked around this topic here already. Whole week I’ve said that market could and should break 1.45 and blah-blah-blah... and so what? Nothing, market continues coiling around 1.4450-1.45 area. What could I say? Only the same thing - I still believe that 1.45 should be cleared out at least. It’s very rare, when market makers leave some important level and don’t grab stops. Sometimes it happens, but the probability of this event on the other side. Greed is very strong power – public stops should be grabbed.
That’s why I will not even think about enter on the short side until I see Wash&Rinse of 1.45 highs. Now let’s take a look at technical issue also.
As we already know – market has hit multiple targets at multiple time frames – here I show you another one. And what has happened? Nothing. Market just stands in tight range and didn’t even a bounce to the downside. It’s curious in terms on normal price action.
Second, market stands above the pivot whole week. Yes it has shown some intraday down thrusts, but none of them has reached pivot point. Hence – market has no intention to move lower, at least currently.
Third, look directly at price action itself – two inside days in a row – on Friday and on Wednesday. I can say, that it tells us – “Be Aware of strong move in some direction”. Inside days do not tell us the direction, they just warn us about possible strong explosive move that should happen sooner rather than later. Understand, current price action tells that market is accumulating the energy – this energy should released someday. And it should happen soon.
Forth, trend is still bullish at all time frames.
Due to tight price action on previous weeks, pivot points stand very close to each other. By the way – market has closed very close to pivot at 1.4420. So, beginning of the week could tell us something about market sentiment.
Intraday
On 4-hour chart #1 you see the same stuff that was on Friday. Our Butterfly “sell” pattern is still valid. Its nearest target is 1.27 at 1.4542. At some case I also draw 1.618 target at 1.4596 – may be market will show explosive thrust, who knows…
Here you also can see how market struggle with trend direction. While trend holds bearish, market action does not support it and just stands in the range. This is bullish sign.
Meantime the attractiveness of Butterfly now is greater that on Friday. Because market stands at much lower level and we can place much tighter stop if intend to trade it.
#1
On hourly chart #2 we see some details of down thrust. Market has hit solid support area – Fib support and couple of targets. If they will hold it and market will move above pivot 1.4420 on Monday, then possibly Butterfly will employ as we expect…
#2
Conclusion:
Position traders:
Hold longs.
Intraday traders:
It’s obvious that market is building energy for future breakout. Price action suggests that this breakout more probable will be to the upside. Still, trading in such choppy environment is very risky business. Try to open positions near to some significant levels that will allow you to place tight stops. Reduce position value.
Speaking about particular Butterfly pattern – we can try to enter long with tight stop, somewhere near to 1.4340-1.4350 area, because if market will take this low – butterfly will be canceled.
It’s preferable to wait, when market will move above 1.4420 weekly pivot on Monday, and will hold there. Don’t be long, if market will hold below pivot point.
The technical portion of Sive's analysis owes a great deal to Joe DiNapoli's methods, and uses a number of Joe's proprietary indicators. Please note that Sive's analysis is his own view of the market and is not endorsed by Joe DiNapoli or any related companies.
") "Greed is very strong power", you say.
"Greed is very strong power", you say.
