Sive Morten
Special Consultant to the FPA
- Messages
- 18,673
Fundamentals
Reuters reports dollar slipped against a basket of currencies after touching near a four-month high on Friday, as investors pared bullish bets that a solid U.S. jobs report had pushed the Federal Reserve closer to raising interest rates this year.
A slide in longer-dated bond yields also weighed on the greenback, suggesting that because inflation remained low, the pace of the Fed's rate increases would be slow and the U.S. currency's upside potential likely limited.
But the outlook for the dollar remained generally positive on the prospect of higher rates, with most analysts expecting the central bank to begin the monetary tightening at its September policy-setting meeting.
The dollar earlier rose to a two-month peak versus the yen and near a five-month high against the Swiss franc, but by midday also had surrendered those gains.
"With the U.S. dollar rising well ahead of yield differentials, the chances are that a lot of the hawkish news is already in the price, which limits scope for further gains after the September FOMC (Federal Open Market Committee)," said Lena Komileva, chief economist and director at G+ Economics in London.
Analysts said reversals in the dollar's price action are normal when highly-anticipated U.S. economic data such as the non-farm payrolls report is released just before a weekend.
On Friday, data showed U.S. nonfarm payrolls increased 215,000 last month, slightly lower than market expectations for a rise of 223,000 jobs but still seen as consistent with a strong labor market. Upward revisions to the previous two months and a gain in average hourly earnings also were viewed positively by markets.
Following the jobs report, the swaps market was pricing in a 52 percent chance of a September rate hike, up from 47 percent before the data's release.
Christopher Vecchio, currency analyst at DailyFX in New York, said, however, that "given low headline inflation readings and a lack of break-neck speed in the labor market, the first hike in September (or October or December for that matter) is likely to be an isolated event."
Chinese exports tumbled 8.3 percent in July, their biggest drop in four months and far worse than expected, reinforcing expectations that Beijing will be forced to roll out more stimulus to support the world's second-largest economy.
Imports also fell heavily from a year earlier, in line with market forecasts but suggesting domestic demand might be too feeble to offset the weaker global demand for China's exports.
Economists had forecast exports to fall just 1 percent, after a 2.8 percent uptick in June, but the data on Saturday showed depressed demand from Europe and the first drop in exports to the United States, China's biggest market, since March.
Exports to the European Union fell 12.3 percent in July while those to the United States dropped 1.3 percent. Demand from Japan, another big trading partner, slid 13 percent.
"A recovery in external demand remains far off and economic growth will continue to rely on domestic demand, which implies policies should continue to be relaxed in the second half," wrote Qu Hongbin, China economist at global bank HSBC.
Imports fell 8.1 percent, according to the data from the General Administration of Customs. That compared with forecasts for an 8 percent drop, after a 6.1 percent decline in June, though these falls also reflected weaker commodity prices.
China recorded a trade surplus of $43.03 billion for the month, below forecasts of $53.25 billion.
The July trade data could further dim hopes for an economic turnaround in the second half of this year, after a few signs of stabilisation had emerged in June.
China's factory activity suffered its biggest contraction in two years in July as new orders fell.
On Friday the central bank published a report warning of further economic weakness, but argued the economy needed a retooled growth engine, instead of short-term stimulus.
Economists also blame a strong yuan for the export weakness, with ANZ Research estimating the currency's nominal effective exchange rate has risen by 13.5 percent since June 2014.
Analysts say Beijing has been keeping its yuan strong to wean its economy off low-end export manufacturing. A strong yuan policy also supports domestic buying power, helps Chinese firms to borrow and invest abroad, and encourages foreign firms and governments to increase their use of the currency.
"These factors suggest that China's exports will continue to face strong headwinds," Liu Ligang and Louis Lam said in an ANZ Research note on Saturday, adding that they doubted Beijing would hit its trade growth target of 6 percent for this year.
China's weak import figure partly reflects weak commodity prices paid to trading partners such as Australia, which ships coal and iron ore to China. Volume imports of most major commodities were higher than expected, as Chinese industry took advantage of the lower prices to restock on raw materials.
Coal deliveries in particular rose strongly in July, up 28.1 percent, though commodity analysts said that prospects for the market remained dim overall.
Stephen Koukoulas, managing director of Australian consultancy Markets Economics, said the fall in commodity prices was a major concern for the Australian and New Zealand economies, which both rely heavily on demand from China.
"Probably the volumes are ok but the prices that are being paid are hugely lower. We have got a real concern there for the future levels of the Aussie dollar," Koukoulas said.
So, guys, last week we’ve pointed our QIII 2015 view on what to expect on financial markets. Mostly there were two important moments. First is – we will not get rate hiking cycle in US but probably either single hike or dot increasing with solid distance between them. Second – global economy slows, that means low interest rates for long time and lack of inflation.
News above in general confirms our expectations by far. Other analysts also suggest that “…the first hike in September (or October or December for that matter) is likely to be an isolated event." So, how we should interpret recent reaction on NFP data? Was it positive? Yes. And why markets have turned in opposite direction? We could speak on two possible reasons. First one is simple. NFP data has not brought tremendous positive surprise and markets could think that rate hike will be postpone to later 2015 FED session but not in September. Second reason is more probable and this is well-known proverb “Buy on rumors Sell on fact”. After solid payrolls markets could think that first rate hike is almost done and worked out issue and start to take positions and think what will be after that. As we’ve said – we do not expect cycle of tighten policy, not do other investors. And they could start take profit from the long run and unwind short positions. In long-term perspective it does not mean that USD bullish trend is over (although this also could happen), but it could trigger meaningful retracement.
Last week CFTC data does not show big changes. Shorts-to-All speculative positions still stands around 70% and keeps door open as for rally as for further drop. Despite that EUR mostly has moved higher even on good NFP data – bears do not hurry to close shorts. Open interest shows shy growth as due longs as due short positions. That’s being said, CFTC data is not an assistant yet.
Open Interest:
 Longs:
 Shorts:

Technicals
Monthly
Despite sentiment CFTC data that shows no shifts yet, we just can’t miss or ignore some signs on technical charts and it seems that they could be early bells of coming changes. Still, we see them mostly on lower charts by far. Here, on monthly picture difference between last week’ close and current week is just 20 pips. So here we can’t bring significantly new comments yet.
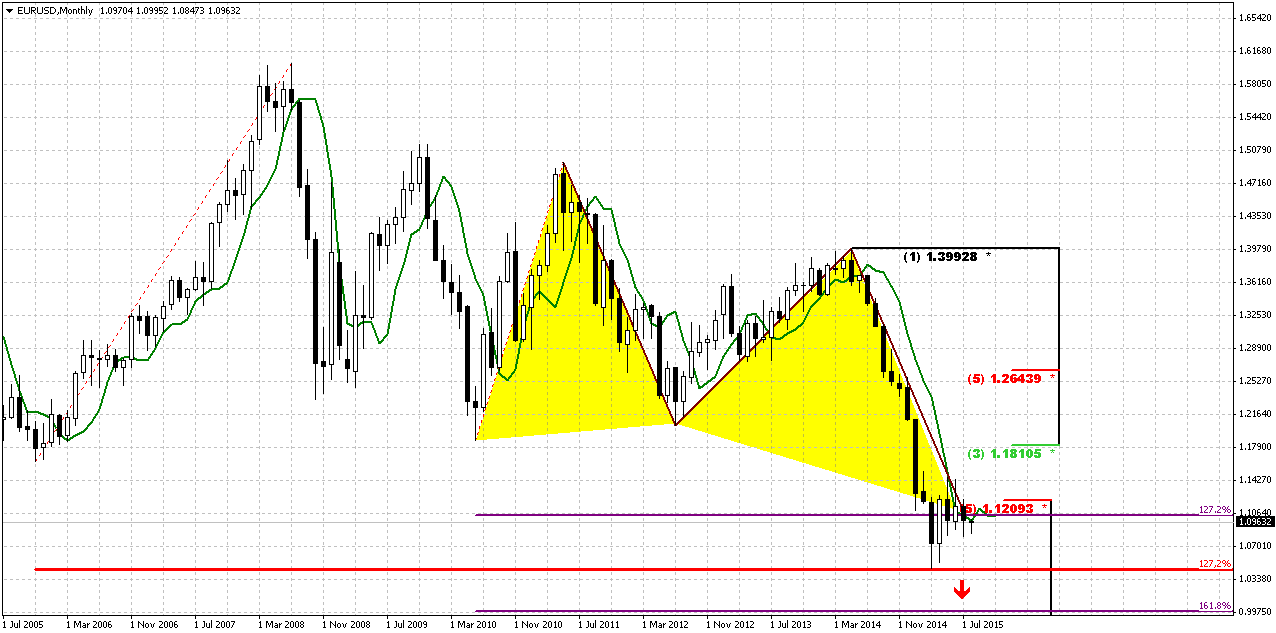
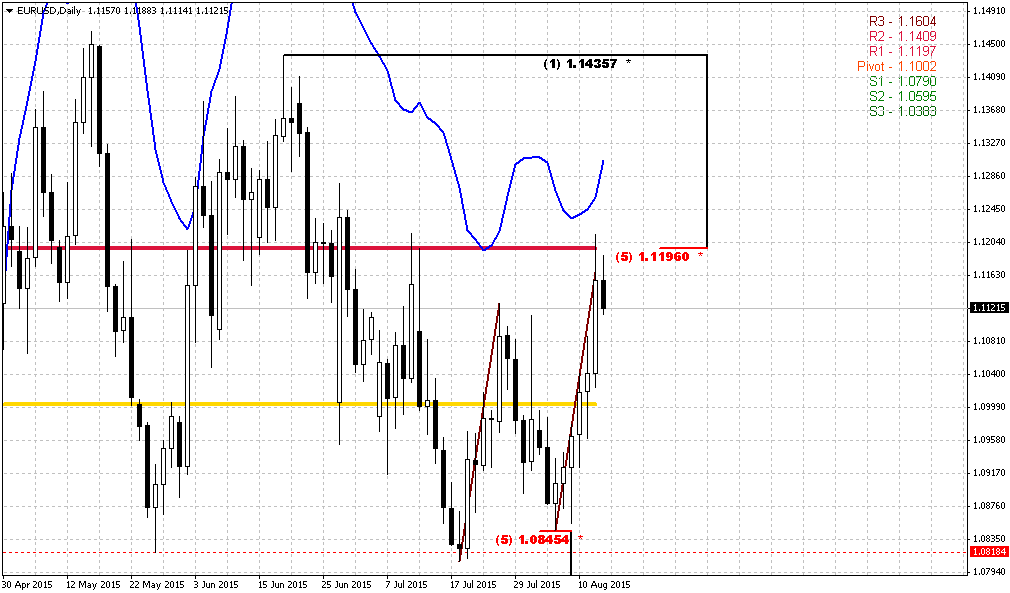
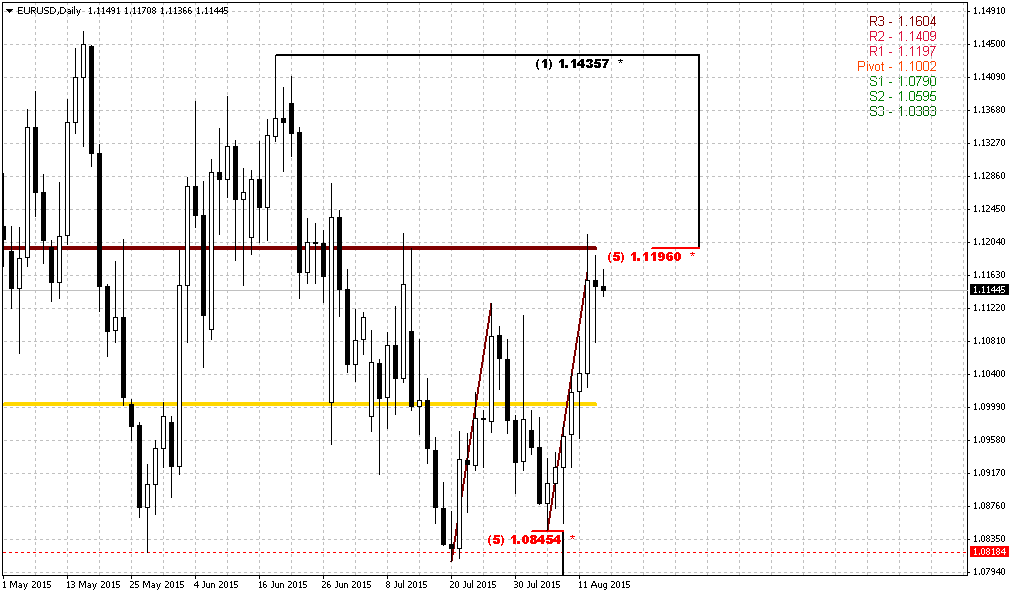
Trend is bearish on monthly chart, July action does not bring any additional information by far and does not clarify further direction. Based on character of recent activity on the market – recent 3-4 months are definitely a retracement, but it could develop differently. For example, market could return back to lows and then form DRPO Buy and trigger upside retracement or, say, it could move directly to 1.18 right now and form B&B “Sell”. Both scenarios are possible yet.
As we have estimated previously 1.05 is 1.27 extension of huge upside swing in 2005-2008 that also has created large & wide butterfly pattern. Recent action does not quite look like normal butterfly wing, but extension is valid and 1.05 is precisely 1.27 ratio. At the same time we have here another supportive targets, as most recent AB=CD, oversold and 1.27 of recent butterfly.
April has closed and confirmed nicely looking bullish engulfing pattern, although market still can’t trigger it, but it is still valid. We know that most probable target of this pattern is length of the bars counted upside. This will give us approximately 3/8 Fib resistance 1.1810 area. This retracement should be mostly tactical. We continue to expect downward continuation in long-term perspective.
Now about our recent talk on possible B&B or DRPO here. We’ve said that B&B seems more probable. We’ve got close above 3x3 DMA in June, but this barely has happened. July action stands flat and this is not sufficient to get B&B “Sell”. So chances on its appearing are melting as time is passing by. Still we will keep watching for DiNapoli directional patterns but probably they will appear not as fast as we have expected.
Despite whether upside retracement will happen or not our next long-term target stands the same – parity as 1.618 completion point of recent butterfly. Currently we should treat possible bounce up, even to 1.18 area, only as retracement within bear trend. But may be it fully will be triggered only after the fact of rate hike next month.
Weekly
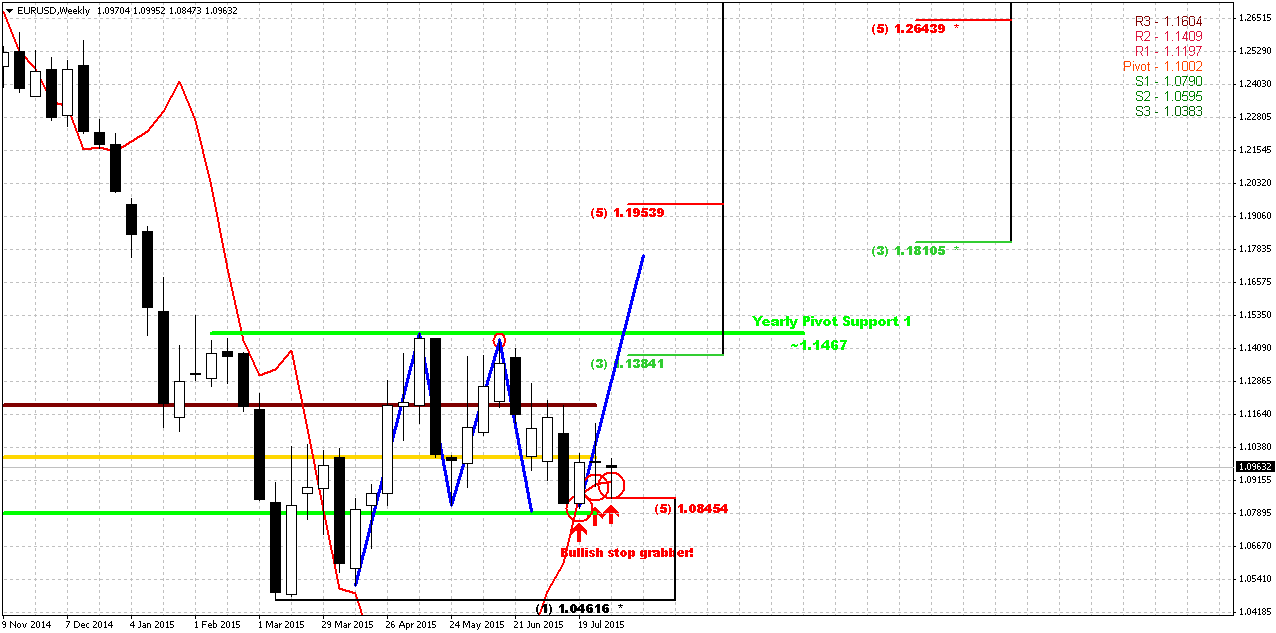
Almost whole week EUR has shown signs of weakness. It was not able to utulize superb ECI data, was not able to hold above MPP and WPP. Only on Friday it has shown shy upside action. But this action has led to not obvious results. First – upside action has happened on good NFP numbers (we talked about it above), second – anyway, but market has formed another one, third in a row, bullish grabber on weekly chart. And we can’t ignore this fact. Still, as ranges of these grabbers are not significant and they mostly stand flat weekly picture has not chagned significantly. It seems that last three weeks EUR mostly stands indecision after strong turmoil events around Greece and data flow from US. May be EUR will choose some direction finally.
Once we’ve said that if EUR will take 1.08 lows it will erase chance on upside butterfly, and this has happened. At the same time take a look at the picture – market has created nothing but “222” Buy pattern.
Second issue is MPS1. Price has held above it. Minimum target that market should reach based on grabbers is former highs around 1.1450 level. If we suggest possible upside AB=CD then our monthly scenario with B&B pattern @ 1.18 does not look as impossible as previously.
Conversely, any setup could fail, and grabber is not an exception. Failure also will eliminate any concerns on “how EUR will reach 1.18” answer will be nohow. But as soon as setup is still valid we will work with it. It gives us important information that our invalidation point is 1.08 lows. If market will break them – our setup will be destroyed. The only thing that looks suspicious is the shape of action on lower time frame charts. Yes, we’ve got grabbers but the way how market moves does not show yet any thrusting upside action.
Daily
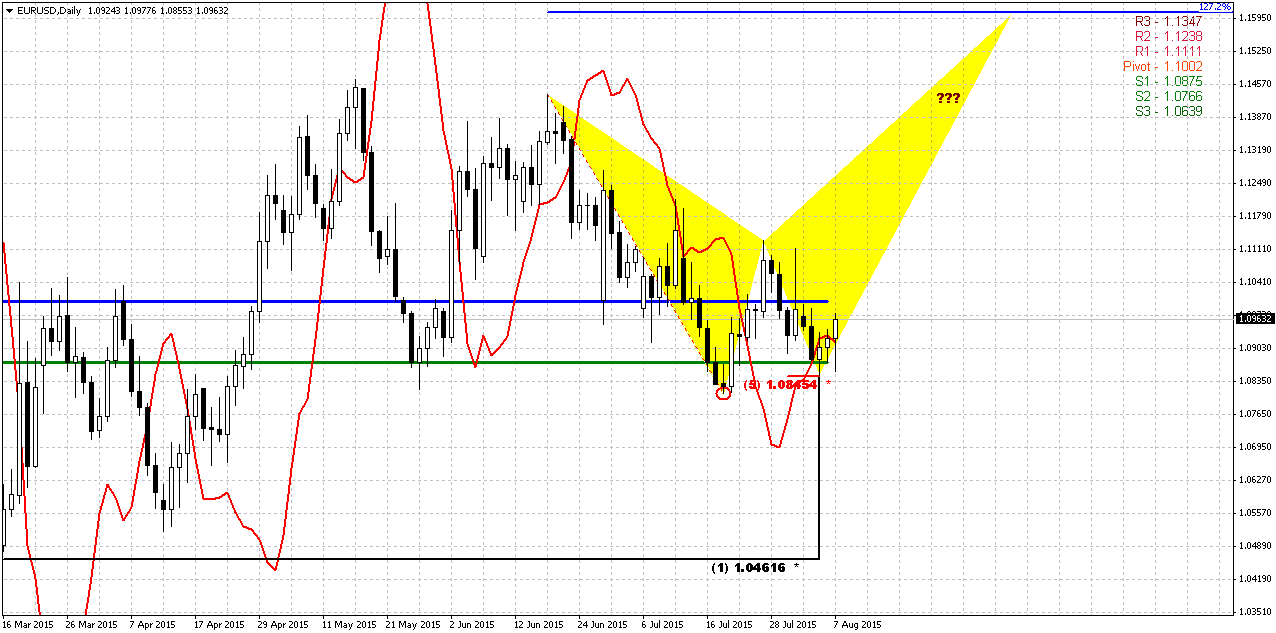
In the beginning I foresee your reasonable question why we’ve drawn upside butterfly, while we could draw bearish butterfly either. There are some reasons for that. First is trend is bullish here, market has held above WPS1 last week, and MPS1 two weeks ago. Second – we have potentially bullish patterns on weekly chart with target @1.1450+ and this approximately coincides with our butterfly shape.
In short-term perspective situation looks simple and it stands around 1.08. Standing above it EUR will keep chances on upside action, while moving below it will erase all grabbers on weekly chart, shift trends bearish in all time frames and open road at least to 1.05 lows or even to the next target – parity. But… recall we we’ve announced in fundamentals – market could shift to perspectives that stand beyond first rate hike that investors already could treat as “done thing”. From that point of view, current technical picture looks absolutely different.
Your choice is also simple. If you want – you could try to trade weekly grabbers. If you have bearish view – you need do nothing, and wait 1.08 area breakout. You just need to decide…
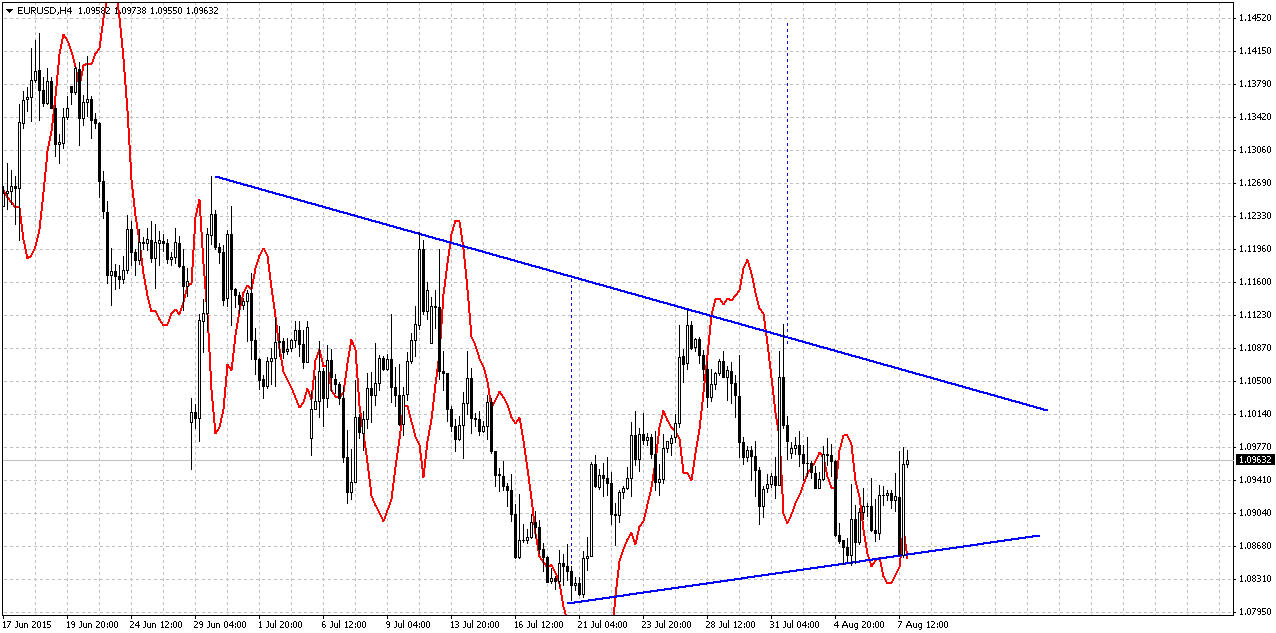
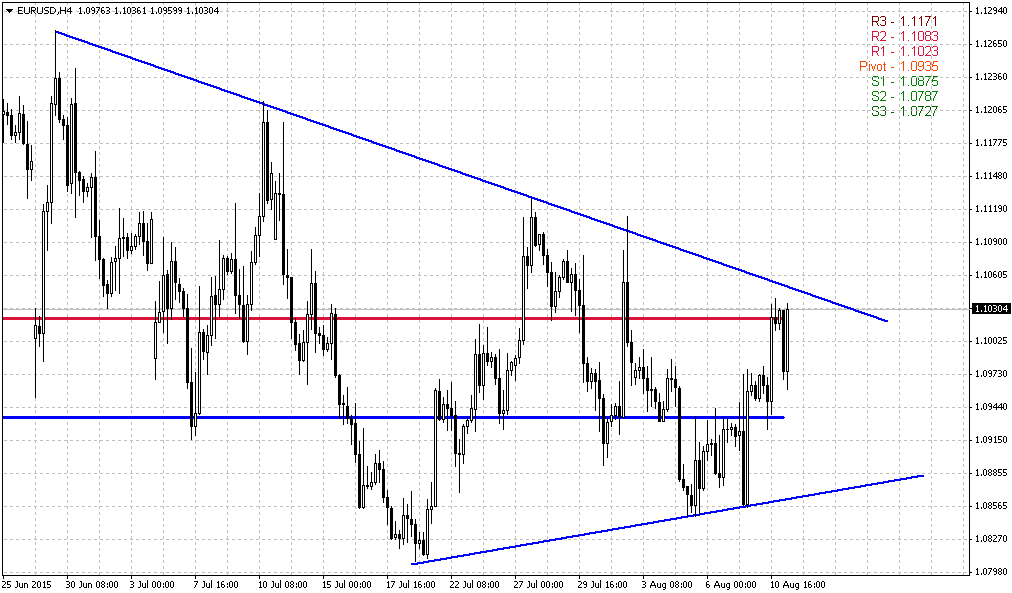
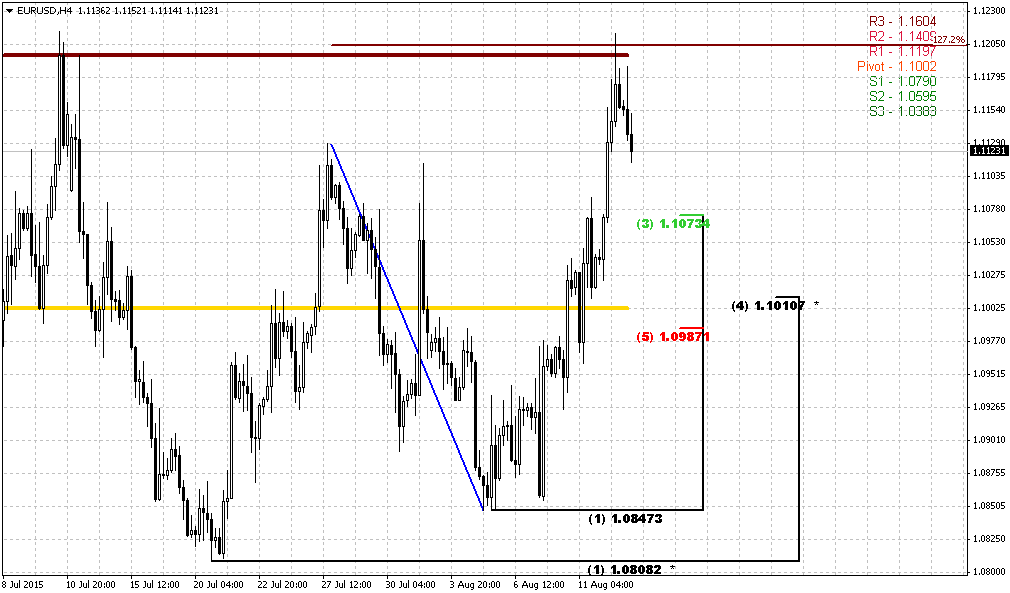
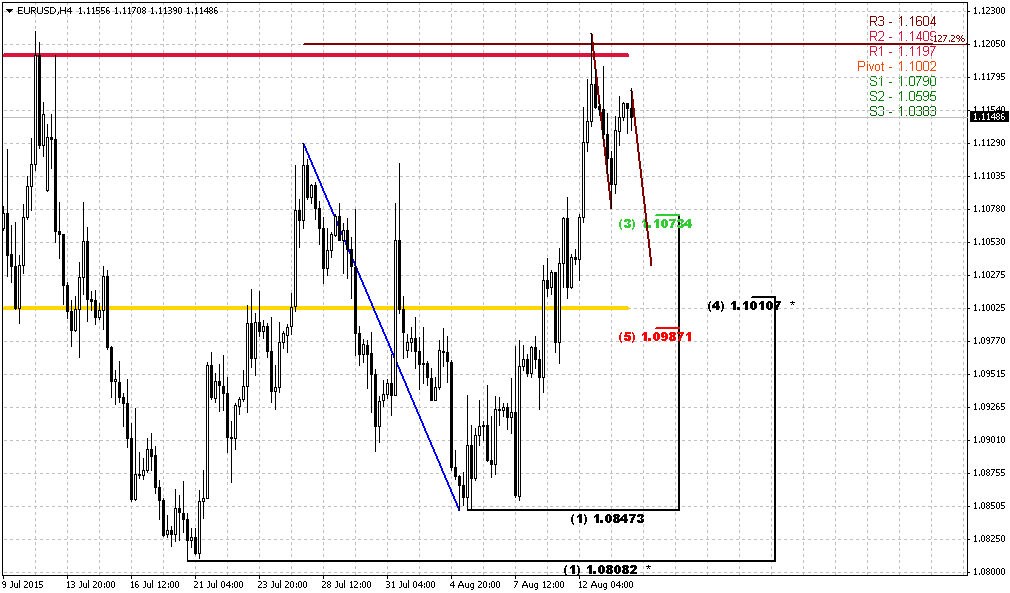
4-Hour
On first glance this picture does not show anything special, except may be bullish grabber at the bottom. Still, here we see that EUR has turned to different tendency. Previously it was in clear bearish action - lower highs, lower lows. But right now it has turned to triangle consolidation with higher lows. Potentially this keeps a lot of potential, including triangle breakout, appearing of butterfly “Sell” etc. But right now we’re mostly interested nearest perspective, what we could get, say, on Monday.
As market is not at oversold, has tested WPS1 last week, shows impressive upside action on Friday and just jumped out from support line – downward retracement probably should not be too significant.
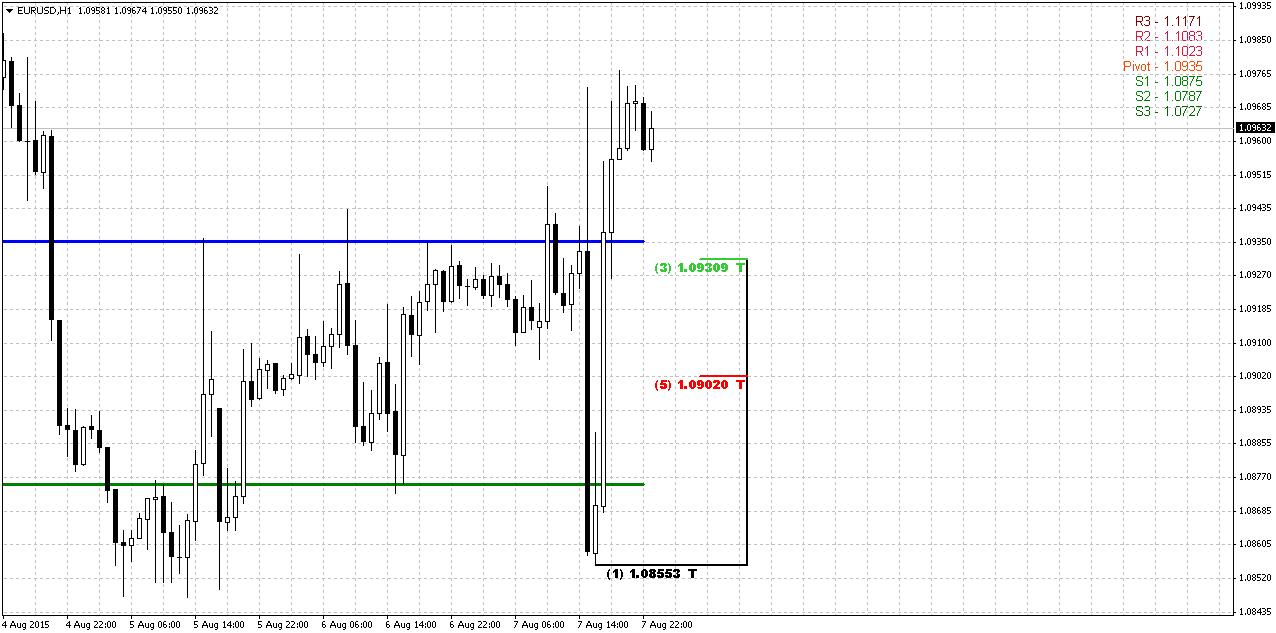
1-Hour
That’s why we probably will watch for First Fib support level around WPP – 1.0930. This is only for those who will decide to trade grabbers up.
Conclusion:
Despite strong bearish background and fundamentals market shows signs of possible upside retracement, initially to 1.1450, potentially to 1.18 area. Still, this retracement will be mostly tactical and not break long-term bearish trend and our expectation of parity by far.
In short-term perspective our major patterns are weekly grabbers. If they will fail – then upside action probably will not happen and market will continue move down but currently we just can’t ignore them especially in the light of the new trends.
The technical portion of Sive's analysis owes a great deal to Joe DiNapoli's methods, and uses a number of Joe's proprietary indicators. Please note that Sive's analysis is his own view of the market and is not endorsed by Joe DiNapoli or any related companies.
Reuters reports dollar slipped against a basket of currencies after touching near a four-month high on Friday, as investors pared bullish bets that a solid U.S. jobs report had pushed the Federal Reserve closer to raising interest rates this year.
A slide in longer-dated bond yields also weighed on the greenback, suggesting that because inflation remained low, the pace of the Fed's rate increases would be slow and the U.S. currency's upside potential likely limited.
But the outlook for the dollar remained generally positive on the prospect of higher rates, with most analysts expecting the central bank to begin the monetary tightening at its September policy-setting meeting.
The dollar earlier rose to a two-month peak versus the yen and near a five-month high against the Swiss franc, but by midday also had surrendered those gains.
"With the U.S. dollar rising well ahead of yield differentials, the chances are that a lot of the hawkish news is already in the price, which limits scope for further gains after the September FOMC (Federal Open Market Committee)," said Lena Komileva, chief economist and director at G+ Economics in London.
Analysts said reversals in the dollar's price action are normal when highly-anticipated U.S. economic data such as the non-farm payrolls report is released just before a weekend.
On Friday, data showed U.S. nonfarm payrolls increased 215,000 last month, slightly lower than market expectations for a rise of 223,000 jobs but still seen as consistent with a strong labor market. Upward revisions to the previous two months and a gain in average hourly earnings also were viewed positively by markets.
Following the jobs report, the swaps market was pricing in a 52 percent chance of a September rate hike, up from 47 percent before the data's release.
Christopher Vecchio, currency analyst at DailyFX in New York, said, however, that "given low headline inflation readings and a lack of break-neck speed in the labor market, the first hike in September (or October or December for that matter) is likely to be an isolated event."
Chinese exports tumbled 8.3 percent in July, their biggest drop in four months and far worse than expected, reinforcing expectations that Beijing will be forced to roll out more stimulus to support the world's second-largest economy.
Imports also fell heavily from a year earlier, in line with market forecasts but suggesting domestic demand might be too feeble to offset the weaker global demand for China's exports.
Economists had forecast exports to fall just 1 percent, after a 2.8 percent uptick in June, but the data on Saturday showed depressed demand from Europe and the first drop in exports to the United States, China's biggest market, since March.
Exports to the European Union fell 12.3 percent in July while those to the United States dropped 1.3 percent. Demand from Japan, another big trading partner, slid 13 percent.
"A recovery in external demand remains far off and economic growth will continue to rely on domestic demand, which implies policies should continue to be relaxed in the second half," wrote Qu Hongbin, China economist at global bank HSBC.
Imports fell 8.1 percent, according to the data from the General Administration of Customs. That compared with forecasts for an 8 percent drop, after a 6.1 percent decline in June, though these falls also reflected weaker commodity prices.
China recorded a trade surplus of $43.03 billion for the month, below forecasts of $53.25 billion.
The July trade data could further dim hopes for an economic turnaround in the second half of this year, after a few signs of stabilisation had emerged in June.
China's factory activity suffered its biggest contraction in two years in July as new orders fell.
On Friday the central bank published a report warning of further economic weakness, but argued the economy needed a retooled growth engine, instead of short-term stimulus.
Economists also blame a strong yuan for the export weakness, with ANZ Research estimating the currency's nominal effective exchange rate has risen by 13.5 percent since June 2014.
Analysts say Beijing has been keeping its yuan strong to wean its economy off low-end export manufacturing. A strong yuan policy also supports domestic buying power, helps Chinese firms to borrow and invest abroad, and encourages foreign firms and governments to increase their use of the currency.
"These factors suggest that China's exports will continue to face strong headwinds," Liu Ligang and Louis Lam said in an ANZ Research note on Saturday, adding that they doubted Beijing would hit its trade growth target of 6 percent for this year.
China's weak import figure partly reflects weak commodity prices paid to trading partners such as Australia, which ships coal and iron ore to China. Volume imports of most major commodities were higher than expected, as Chinese industry took advantage of the lower prices to restock on raw materials.
Coal deliveries in particular rose strongly in July, up 28.1 percent, though commodity analysts said that prospects for the market remained dim overall.
Stephen Koukoulas, managing director of Australian consultancy Markets Economics, said the fall in commodity prices was a major concern for the Australian and New Zealand economies, which both rely heavily on demand from China.
"Probably the volumes are ok but the prices that are being paid are hugely lower. We have got a real concern there for the future levels of the Aussie dollar," Koukoulas said.
So, guys, last week we’ve pointed our QIII 2015 view on what to expect on financial markets. Mostly there were two important moments. First is – we will not get rate hiking cycle in US but probably either single hike or dot increasing with solid distance between them. Second – global economy slows, that means low interest rates for long time and lack of inflation.
News above in general confirms our expectations by far. Other analysts also suggest that “…the first hike in September (or October or December for that matter) is likely to be an isolated event." So, how we should interpret recent reaction on NFP data? Was it positive? Yes. And why markets have turned in opposite direction? We could speak on two possible reasons. First one is simple. NFP data has not brought tremendous positive surprise and markets could think that rate hike will be postpone to later 2015 FED session but not in September. Second reason is more probable and this is well-known proverb “Buy on rumors Sell on fact”. After solid payrolls markets could think that first rate hike is almost done and worked out issue and start to take positions and think what will be after that. As we’ve said – we do not expect cycle of tighten policy, not do other investors. And they could start take profit from the long run and unwind short positions. In long-term perspective it does not mean that USD bullish trend is over (although this also could happen), but it could trigger meaningful retracement.
Last week CFTC data does not show big changes. Shorts-to-All speculative positions still stands around 70% and keeps door open as for rally as for further drop. Despite that EUR mostly has moved higher even on good NFP data – bears do not hurry to close shorts. Open interest shows shy growth as due longs as due short positions. That’s being said, CFTC data is not an assistant yet.
Open Interest:
Technicals
Monthly
Despite sentiment CFTC data that shows no shifts yet, we just can’t miss or ignore some signs on technical charts and it seems that they could be early bells of coming changes. Still, we see them mostly on lower charts by far. Here, on monthly picture difference between last week’ close and current week is just 20 pips. So here we can’t bring significantly new comments yet.
Trend is bearish on monthly chart, July action does not bring any additional information by far and does not clarify further direction. Based on character of recent activity on the market – recent 3-4 months are definitely a retracement, but it could develop differently. For example, market could return back to lows and then form DRPO Buy and trigger upside retracement or, say, it could move directly to 1.18 right now and form B&B “Sell”. Both scenarios are possible yet.
As we have estimated previously 1.05 is 1.27 extension of huge upside swing in 2005-2008 that also has created large & wide butterfly pattern. Recent action does not quite look like normal butterfly wing, but extension is valid and 1.05 is precisely 1.27 ratio. At the same time we have here another supportive targets, as most recent AB=CD, oversold and 1.27 of recent butterfly.
April has closed and confirmed nicely looking bullish engulfing pattern, although market still can’t trigger it, but it is still valid. We know that most probable target of this pattern is length of the bars counted upside. This will give us approximately 3/8 Fib resistance 1.1810 area. This retracement should be mostly tactical. We continue to expect downward continuation in long-term perspective.
Now about our recent talk on possible B&B or DRPO here. We’ve said that B&B seems more probable. We’ve got close above 3x3 DMA in June, but this barely has happened. July action stands flat and this is not sufficient to get B&B “Sell”. So chances on its appearing are melting as time is passing by. Still we will keep watching for DiNapoli directional patterns but probably they will appear not as fast as we have expected.
Despite whether upside retracement will happen or not our next long-term target stands the same – parity as 1.618 completion point of recent butterfly. Currently we should treat possible bounce up, even to 1.18 area, only as retracement within bear trend. But may be it fully will be triggered only after the fact of rate hike next month.
Weekly
Almost whole week EUR has shown signs of weakness. It was not able to utulize superb ECI data, was not able to hold above MPP and WPP. Only on Friday it has shown shy upside action. But this action has led to not obvious results. First – upside action has happened on good NFP numbers (we talked about it above), second – anyway, but market has formed another one, third in a row, bullish grabber on weekly chart. And we can’t ignore this fact. Still, as ranges of these grabbers are not significant and they mostly stand flat weekly picture has not chagned significantly. It seems that last three weeks EUR mostly stands indecision after strong turmoil events around Greece and data flow from US. May be EUR will choose some direction finally.
Once we’ve said that if EUR will take 1.08 lows it will erase chance on upside butterfly, and this has happened. At the same time take a look at the picture – market has created nothing but “222” Buy pattern.
Second issue is MPS1. Price has held above it. Minimum target that market should reach based on grabbers is former highs around 1.1450 level. If we suggest possible upside AB=CD then our monthly scenario with B&B pattern @ 1.18 does not look as impossible as previously.
Conversely, any setup could fail, and grabber is not an exception. Failure also will eliminate any concerns on “how EUR will reach 1.18” answer will be nohow. But as soon as setup is still valid we will work with it. It gives us important information that our invalidation point is 1.08 lows. If market will break them – our setup will be destroyed. The only thing that looks suspicious is the shape of action on lower time frame charts. Yes, we’ve got grabbers but the way how market moves does not show yet any thrusting upside action.
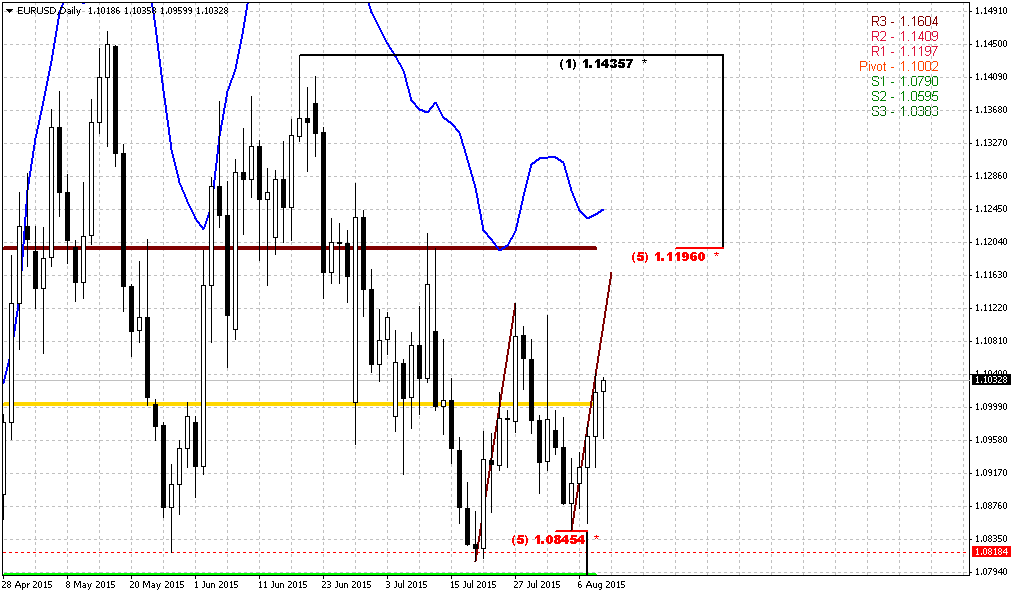
Daily
In the beginning I foresee your reasonable question why we’ve drawn upside butterfly, while we could draw bearish butterfly either. There are some reasons for that. First is trend is bullish here, market has held above WPS1 last week, and MPS1 two weeks ago. Second – we have potentially bullish patterns on weekly chart with target @1.1450+ and this approximately coincides with our butterfly shape.
In short-term perspective situation looks simple and it stands around 1.08. Standing above it EUR will keep chances on upside action, while moving below it will erase all grabbers on weekly chart, shift trends bearish in all time frames and open road at least to 1.05 lows or even to the next target – parity. But… recall we we’ve announced in fundamentals – market could shift to perspectives that stand beyond first rate hike that investors already could treat as “done thing”. From that point of view, current technical picture looks absolutely different.
Your choice is also simple. If you want – you could try to trade weekly grabbers. If you have bearish view – you need do nothing, and wait 1.08 area breakout. You just need to decide…
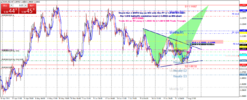
4-Hour
On first glance this picture does not show anything special, except may be bullish grabber at the bottom. Still, here we see that EUR has turned to different tendency. Previously it was in clear bearish action - lower highs, lower lows. But right now it has turned to triangle consolidation with higher lows. Potentially this keeps a lot of potential, including triangle breakout, appearing of butterfly “Sell” etc. But right now we’re mostly interested nearest perspective, what we could get, say, on Monday.
As market is not at oversold, has tested WPS1 last week, shows impressive upside action on Friday and just jumped out from support line – downward retracement probably should not be too significant.
1-Hour
That’s why we probably will watch for First Fib support level around WPP – 1.0930. This is only for those who will decide to trade grabbers up.
Conclusion:
Despite strong bearish background and fundamentals market shows signs of possible upside retracement, initially to 1.1450, potentially to 1.18 area. Still, this retracement will be mostly tactical and not break long-term bearish trend and our expectation of parity by far.
In short-term perspective our major patterns are weekly grabbers. If they will fail – then upside action probably will not happen and market will continue move down but currently we just can’t ignore them especially in the light of the new trends.
The technical portion of Sive's analysis owes a great deal to Joe DiNapoli's methods, and uses a number of Joe's proprietary indicators. Please note that Sive's analysis is his own view of the market and is not endorsed by Joe DiNapoli or any related companies.
") ......and very honestly, I started writing a post for my "Weekend Rumbling on FX, Economy, Politics, Etc, Etc…" but after reading your thread, realized that you have already covered all and much more of what's on my mind
......and very honestly, I started writing a post for my "Weekend Rumbling on FX, Economy, Politics, Etc, Etc…" but after reading your thread, realized that you have already covered all and much more of what's on my mind