Triantus Shango
Sergeant Major
- Messages
- 1,371
i feel like a blind man groping in the dark! 
i feel like a blind man groping in the dark!
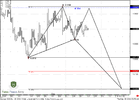
I think probably market will take out previous low on H4 around 1.33 if we take consideration on current trend if market still below 3x3 and all pivots when bar close.
Thanks and Best Regards.
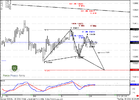
30 min chart- possible DRPO or B&B? What worries me is that spike up to 1.3397, but still no close above 3x3... I will watch closely price action in next 2-3hours
30 min chart- possible DRPO or B&B? What worries me is that spike up to 1.3397, but still no close above 3x3... I will watch closely price action in next 2-3hours
Yes probably...lets see...for now, I still think market will take out 1.333 based on 4 hour chart..
Thanks and Best Regards
and i am back!!
yesterday was truly the trade from hell... well not as bad as i used to do it in the beginning but still.... stop was too tight. i got stopped out by 1 pip and gave back 50% of what i made the previous day! talk about frustration.
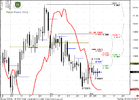
also i was obviously wrong as regards the 3-drive buy pattern. nothing makes sense anymore.
sive, if you are reading this, could you please enlighten me.
cheers to all, let it be pip day today.
Sorry if I've missed something and didn't answer somewhere.