Sive Morten
Special Consultant to the FPA
- Messages
- 18,685
Monthly
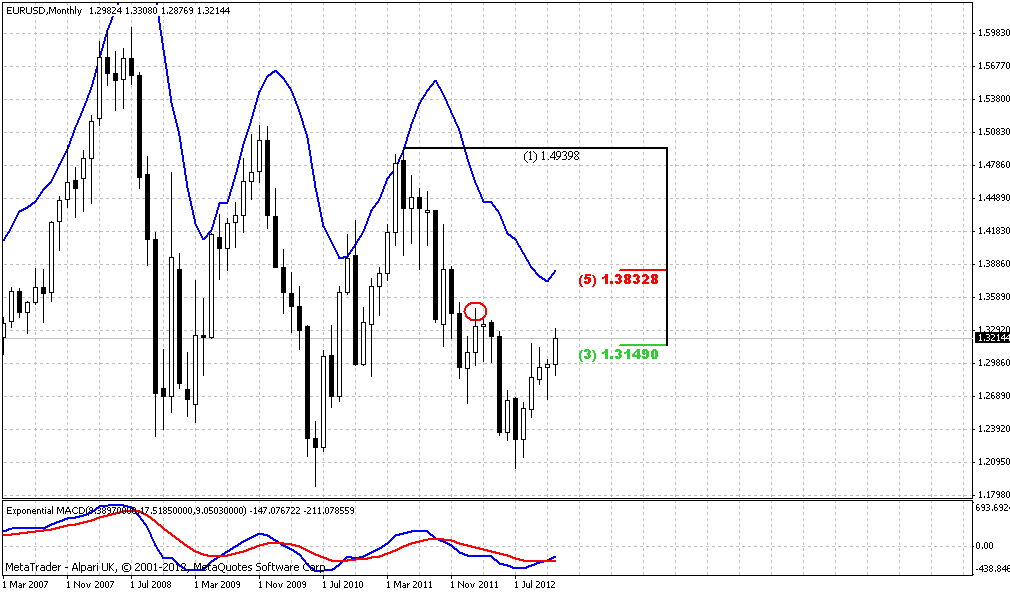
On monthly chart market has closed slightly higher than on previous week, so it’s very difficult to add something to previous analysis – trend holds bullish, as well as price action. Market now stands slightly higher than former K-resistance area and 1.3150 level is an upper border of it.
There are two moments to watch for on monthly chart, but both of them are rather extended perspective. First is the length of current swing up. If it will exceed previous swing down, marked by red circle, then it will be solid challenge on further upward continuation. Second is – next potential target 1.3833 – major 5/8 Fib resistance and AB=CD Agreement (better looks at weekly time frame) and monthly overbought.
Weekly
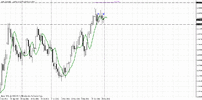
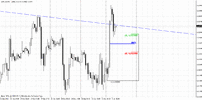
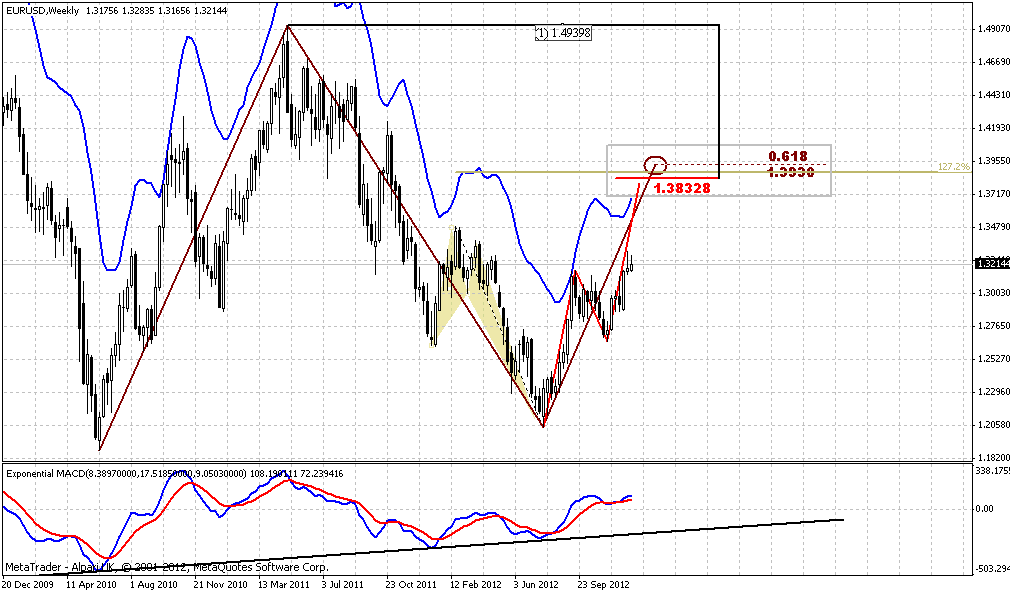
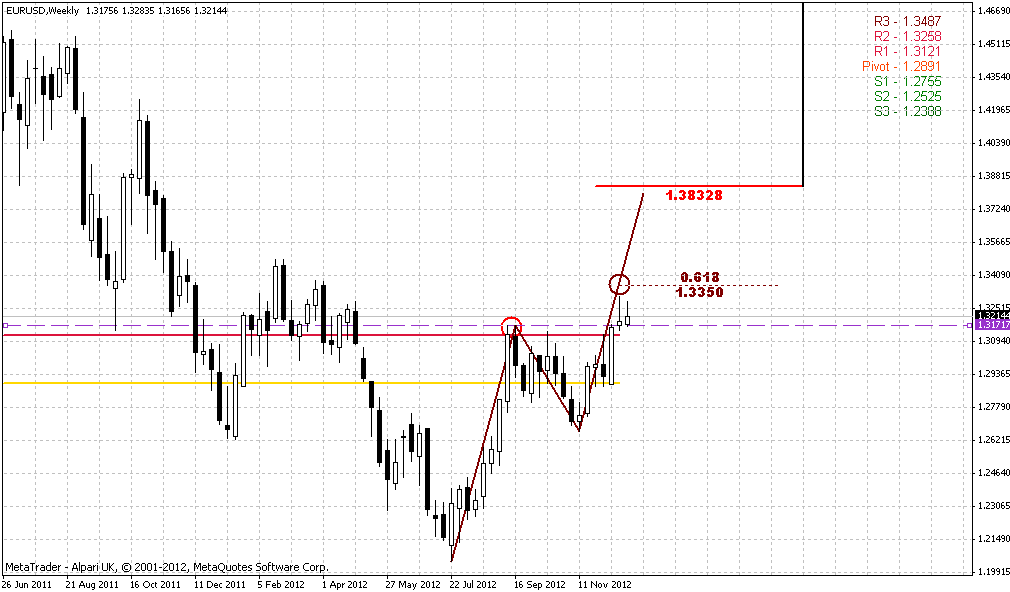
The first weekly chart is more related to monthly analysis, since lets us clearer understand the value of 1.3830 major 5/8 resistance. Trend is bullish here, price action also looks bullish – market is forming upward AB-CD with shallow BC leg, recall the recent breakout through 25x5 and its retesting. As I’ve mentioned above, on weekly chart it is clear looking Agreement around 1.3830 area. Here I’ve found another big AB-CD pattern that creates another Agreement with this 5/8 resistance level and has 0.618 extension at 1.3930. Now add to this stuff weekly oversold and 1.27 extension of former Butterfly “Buy” and we’ll get absolutely outstanding resistance. Definitely this is the next destination on the way up.
On second chart, let’s take a closer look at most recent action. Although we’ve expected clearer bullish price action on passed week – market has not shown it. Recent week could be treated as indecision action and it’s not a surprise – holidays, fiscal cliff in US and thin market. All these moments have led to inside trading week, but… This week was above MPR1 and what is more important – above 1.3172 highs. Yes, second week in a row market holds above broken 1.3172 highs, that’s why, probably current indecision has bullish savor from technical standpoint.
From fundamental standpoint – market just wait how US debt ceil riddle will be resolved. I’ve said already on forum, that we hardly can add something meaningful – everybody knows the core of the problem, but its solution holds in back corridors and third house. Will it make sense to gamble about it? I don’t know. Usually defaults come unexpectedly, but now everybody knows about this problem. My humble opinion stands for agreement but by hard way. I mean, they will come to agreement on debt and no default will happen, but after long debates and argues, and probably Mr. T. Geithner still will have to find $200 Bln. to finance debt growth for 2 months.
Daily
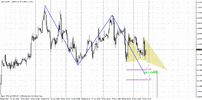
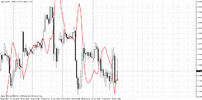
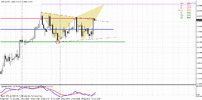
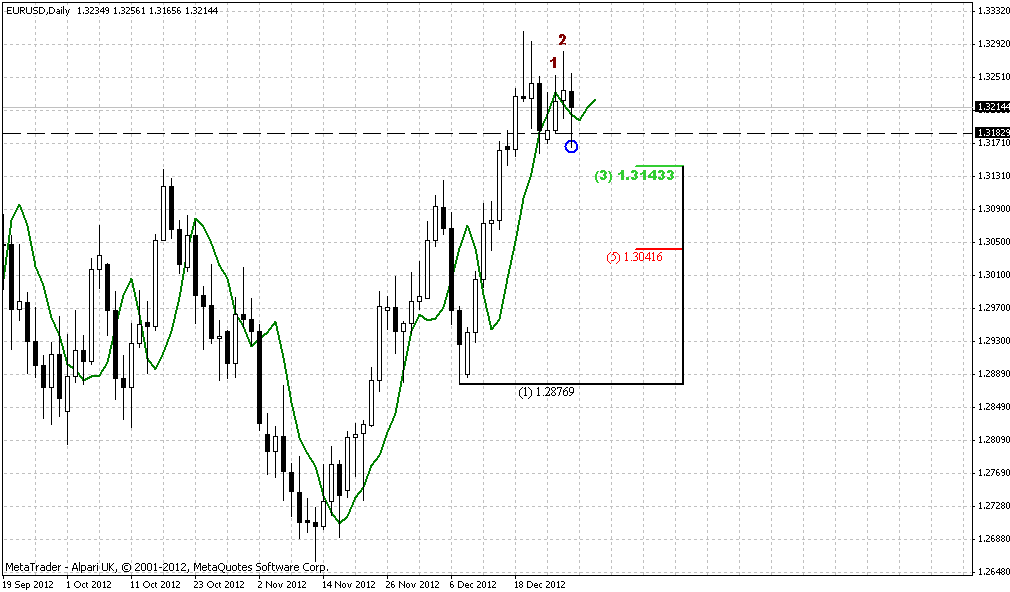
As it looked nice in the beginning of the week as it has ended poor at the end of it. By yesterday’s price action market has erased our stop grabbers – I’ve marked them by “1” and “2” just to not add MACD Predictor line here. Still, we have a pattern that still suggests upward move to 1.3350 – Butterfly “Sell”.
As you can see on the chart, we do not have DRPO “Sell” yet, since there was second close below 3x3 DMA. And finally, why we still expect some upward splash – is daily AB=CD pattern with 1.3350 destination point. So, despite how awful it was on intraday charts – probably there are still not bad chances to see 1.3350 upward continuation, since all major patterns were not cancelled yet.
4-hour
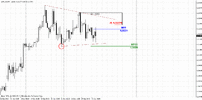
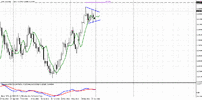
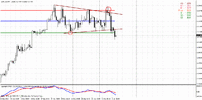
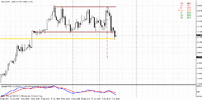
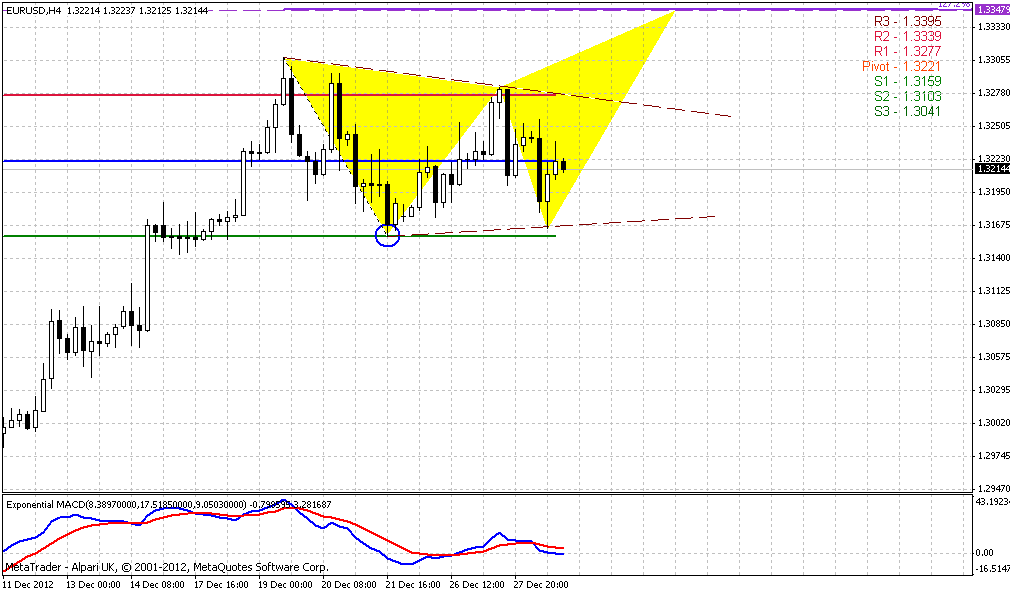
Here is nice consolidation that potentially could lead either to Butterfly or to triangle. As we suggest possibility for DRPO “Sell” on daily – both patterns are suitable for it. Still taking a complex view on price action with a consideration of 1.3350 target area, butterfly has more chances from that standpoint, since price usually gravitates to completion of AB-CD’s. I want to get butterfly as well, since hitting of 1.3350 AB=CD target by Butterfly and following DRPO “Sell” could create absolutely perfect picture.
1-hour
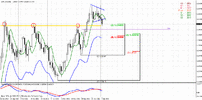
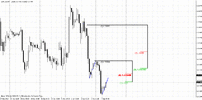
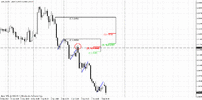
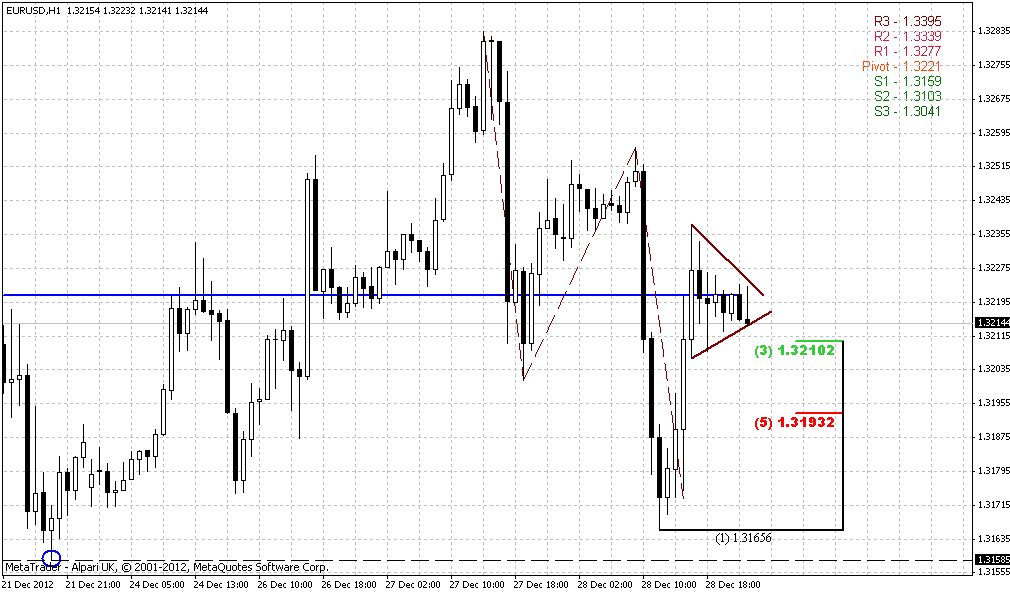
This chart is most significant for us in short-term perspective, since we have to decide how to build up our strategy with minimum risk. As you can see, hourly chart is a matter of dispute. It could be justified as for short entry as for long, depending on from side to watch on it. Thus, bears could argue that market has broken support line (we’ve discussed in on Friday), formed just awful black candles and now this is some sort of “kiss goodbye” of this trend line after reaching AB=CD pattern target. Hence, here is nice entry point to enter short, since price can continue lower to 1.27 or 1.618 of this AB-CD. Why this is not correct? This is nice trading plan as well.
What we have on bullish side? Actually is not much, at least in term of available reasons to enter long. Here we have only single issue – analysis of 4-hour and daily time frame, as we suggest that market will gravitate to 1.3350 area, and butterfly “sell. Why we should take into consideration bullish scenario? Mostly by two reasons – first is, we stand very close to its invalidation point. If butterfly will fail – it will clear everything. Second is, because bullish scenario is not absolutely obvious. May be this is not very reasonable argument, but this makes sense sometimes when less obvious setups actually work.
Besides, we do not have much choice to deal with bullish scenario. We have only recent swing to use for entry: 2 Fib supports, pennant pattern and 1.31585 invalidation point of this scenario. All financial markets now feel the pressure of fiscal uncertainty; it slops out nervousness on markets. In such environment it should be clear that any scenario has to be treated with suspicion and no scenario is flawless.
Thus, I will not to persuade you. From technical perspective upward move has greater probability and probably will choose this direction, but it means little in current environment. So, be flexible and sensible for any price action that will be contrary to your expectations and strategy, despite how logical it will be.
The technical portion of Sive's analysis owes a great deal to Joe DiNapoli's methods, and uses a number of Joe's proprietary indicators. Please note that Sive's analysis is his own view of the market and is not endorsed by Joe DiNapoli or any related companies.
On monthly chart market has closed slightly higher than on previous week, so it’s very difficult to add something to previous analysis – trend holds bullish, as well as price action. Market now stands slightly higher than former K-resistance area and 1.3150 level is an upper border of it.
There are two moments to watch for on monthly chart, but both of them are rather extended perspective. First is the length of current swing up. If it will exceed previous swing down, marked by red circle, then it will be solid challenge on further upward continuation. Second is – next potential target 1.3833 – major 5/8 Fib resistance and AB=CD Agreement (better looks at weekly time frame) and monthly overbought.

Weekly
The first weekly chart is more related to monthly analysis, since lets us clearer understand the value of 1.3830 major 5/8 resistance. Trend is bullish here, price action also looks bullish – market is forming upward AB-CD with shallow BC leg, recall the recent breakout through 25x5 and its retesting. As I’ve mentioned above, on weekly chart it is clear looking Agreement around 1.3830 area. Here I’ve found another big AB-CD pattern that creates another Agreement with this 5/8 resistance level and has 0.618 extension at 1.3930. Now add to this stuff weekly oversold and 1.27 extension of former Butterfly “Buy” and we’ll get absolutely outstanding resistance. Definitely this is the next destination on the way up.

On second chart, let’s take a closer look at most recent action. Although we’ve expected clearer bullish price action on passed week – market has not shown it. Recent week could be treated as indecision action and it’s not a surprise – holidays, fiscal cliff in US and thin market. All these moments have led to inside trading week, but… This week was above MPR1 and what is more important – above 1.3172 highs. Yes, second week in a row market holds above broken 1.3172 highs, that’s why, probably current indecision has bullish savor from technical standpoint.
From fundamental standpoint – market just wait how US debt ceil riddle will be resolved. I’ve said already on forum, that we hardly can add something meaningful – everybody knows the core of the problem, but its solution holds in back corridors and third house. Will it make sense to gamble about it? I don’t know. Usually defaults come unexpectedly, but now everybody knows about this problem. My humble opinion stands for agreement but by hard way. I mean, they will come to agreement on debt and no default will happen, but after long debates and argues, and probably Mr. T. Geithner still will have to find $200 Bln. to finance debt growth for 2 months.

Daily
As it looked nice in the beginning of the week as it has ended poor at the end of it. By yesterday’s price action market has erased our stop grabbers – I’ve marked them by “1” and “2” just to not add MACD Predictor line here. Still, we have a pattern that still suggests upward move to 1.3350 – Butterfly “Sell”.
As you can see on the chart, we do not have DRPO “Sell” yet, since there was second close below 3x3 DMA. And finally, why we still expect some upward splash – is daily AB=CD pattern with 1.3350 destination point. So, despite how awful it was on intraday charts – probably there are still not bad chances to see 1.3350 upward continuation, since all major patterns were not cancelled yet.

4-hour
Here is nice consolidation that potentially could lead either to Butterfly or to triangle. As we suggest possibility for DRPO “Sell” on daily – both patterns are suitable for it. Still taking a complex view on price action with a consideration of 1.3350 target area, butterfly has more chances from that standpoint, since price usually gravitates to completion of AB-CD’s. I want to get butterfly as well, since hitting of 1.3350 AB=CD target by Butterfly and following DRPO “Sell” could create absolutely perfect picture.

1-hour
This chart is most significant for us in short-term perspective, since we have to decide how to build up our strategy with minimum risk. As you can see, hourly chart is a matter of dispute. It could be justified as for short entry as for long, depending on from side to watch on it. Thus, bears could argue that market has broken support line (we’ve discussed in on Friday), formed just awful black candles and now this is some sort of “kiss goodbye” of this trend line after reaching AB=CD pattern target. Hence, here is nice entry point to enter short, since price can continue lower to 1.27 or 1.618 of this AB-CD. Why this is not correct? This is nice trading plan as well.
What we have on bullish side? Actually is not much, at least in term of available reasons to enter long. Here we have only single issue – analysis of 4-hour and daily time frame, as we suggest that market will gravitate to 1.3350 area, and butterfly “sell. Why we should take into consideration bullish scenario? Mostly by two reasons – first is, we stand very close to its invalidation point. If butterfly will fail – it will clear everything. Second is, because bullish scenario is not absolutely obvious. May be this is not very reasonable argument, but this makes sense sometimes when less obvious setups actually work.
Besides, we do not have much choice to deal with bullish scenario. We have only recent swing to use for entry: 2 Fib supports, pennant pattern and 1.31585 invalidation point of this scenario. All financial markets now feel the pressure of fiscal uncertainty; it slops out nervousness on markets. In such environment it should be clear that any scenario has to be treated with suspicion and no scenario is flawless.
Thus, I will not to persuade you. From technical perspective upward move has greater probability and probably will choose this direction, but it means little in current environment. So, be flexible and sensible for any price action that will be contrary to your expectations and strategy, despite how logical it will be.

The technical portion of Sive's analysis owes a great deal to Joe DiNapoli's methods, and uses a number of Joe's proprietary indicators. Please note that Sive's analysis is his own view of the market and is not endorsed by Joe DiNapoli or any related companies.
