FOREX PRO Weekly February 04-08, 2013

Sive,
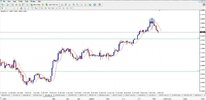
following you for a while and always surprised by the accuracy of your analysis but never really entered the game. Now i take a new start by following your explanations, first success friday with your cable insight just closed too early(mid daily support S2-S3) as i was out (need to install some tracking tool).
 
Thanks Sive.... I especially appreciate your observation about Cable on Friday. I made some money on Friday based on that....It was sweet Friday for me
 
Hi Sive,

The Euro dollar index may have a road block in its path. The weekly 200 EMA.

This may help to pause the E/U rally and may even give some pullback.
EURX4hr.jpg

Also, the USD index might hit some support in the form of a neckline on a H&S pattern.

USDXweekly.jpg
 
Hi Sive,
Thanks for your analysis in Euro and gold! I have a question regarding Yen pairs and usd/yen in particular! From your experience, how do you see this extraordinary move in the pair? I see the fundamental reason behind it, but from a technical point of view this has been a straight up move for the last 3 months without a retracement. I only see some possible B&B sell on 99day USD/JPY chart(see chart atached). Your input is much appreciated! Thank you!View attachment 8244

Hi Venelin. As you have mentioned correctly - this is fundamentals that drive Yen now. Precisely speaking - drastical changing in fiscal policy. Japan moves from accumulation to spending. First of all, I will ask you question - you try to make 3-month B&B trade - where you will place stop?
Second, fundamental issue will decrease probability of success. It could even lead to "V" shape reversal. So, think twice - does it make sense to enter the trade on 3-m chart, take significant risk with fundamentals against you. 3-month chart I suppose is mostly driven by fundamentals.
May be it's better to join some patterns, if they will come, on lower time frames? And trade step by step if retracement suddenly happens.
This is a bit personal question, since tecnically it could be B&B. But I prefer to stick with reasonable trades from risk point of view. I will better do 3 trades on daily with definite patterns rather than 1 trade on weekly chart. But this depends on trading style.
This is my humble view...
 
Hi Sive,

I have been treating the 4-hr pattern on EURUSD as a diamond with a target of 1.3458. Do you have any comment on this?
 

Attachments

  • EURUSD.jpg
    EURUSD.jpg
    98.9 KB · Views: 19
Gbpusd

Might we look for a double rep buy on the GBPUSD, Daily, if we get a close above the 3x3 (in red)? With a target of around 1.59?
 

Attachments

  • GBPUSD.jpg
    GBPUSD.jpg
    125.4 KB · Views: 17
Hey Sive,

I have a couple of questions regarding entry tactics.

I was just wondering if it is suitable to apply Minesweeper A entry tactic for current price action? We can use 4H K-Support as the support for current retracement and wait until hourly trend turns bullish and look to see if support actually exists and only after that, apply nearest Fib support to enter long. I understand market now is about ~ 20 pips below 4H K-Support but if I remember correctly, you have told us K-areas are usually more of a "zone" than actual pips-to-pips support or resistance so would it be okay to say that 4H K-Support still somewhat in play currently?

Does this make sense? Am I using this tactic correctly? And would it work for current price action?

Lastly, I just want to make sure I understand this correctly. Minesweeper B is a more conservative tactic than Minesweeper A. Is this correct? For both Minesweepers, you have to wait and see that there is actually support (or resistance) but for Minesweeper B, is it safe to say that it is more conservative because you wait for a longer period of time for market to confirm price action and then to find K-areas according to such price action?

Whereas for Minesweeper A, all you have to do is look for some sort of support (or resistance) in a larger TF and then lower your TF to actually see if support actually exists and then after that, just wait for lower TF to confirm bullish trend and then enter at 3/8 support (or retracement)?

Thanks, Sive!

Best,
Brandon
k.png
 
Hi Sive,

I think price might even retrace further, possibly down to the weekly 200 EMA.

This was a huge level of previous S/R as can be seen from price action there.

Also, this would be about a 50% pullback from the huge January candle.

EU4hr.jpg
 
Back
Top