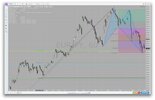
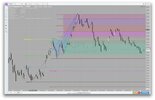
venelin, guys, i can't help it--you've got to see this: a textbook case on e/j. i've attached H1 and M1.
on H1: look at the butterfly buy--it ends right at D extension 2.24 (of the AB=CD structure) where we also find a K-area and thus have an agreement.
now, i don't mean this is a texbook buy butterfly: the reversal, actually the retracement, only lasted about 90 pips. price is still in the potential reversal zone, so who knows? maybe next week it will retrace all the way to 125.91. but that's not the point.
the point is how nicely the butterfly completes around the D point and when you move to M1 and watch what happens around there you can see all the signs indicating a buy. you could have made at least 90 pips on that move even though the butterfly buy on H1 might become invalid if price keeps on dropping.
now move over to M1 and look for the reversal starting at that same price level (around 123.41/51). and now look at another textbook example of a bat sell completed right at D = ext. 2.24. and from there the price disregards the first K-area (between the first yellow and green lines) and continues all the way to the 61.8 retrace fib of the larger New York move from 123.41 (D point on H1) to 124.48.
now that is beautiful!
")