Sive Morten
Special Consultant to the FPA
- Messages
- 18,743
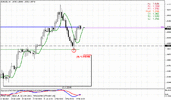
Monthly
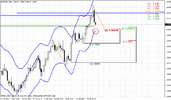
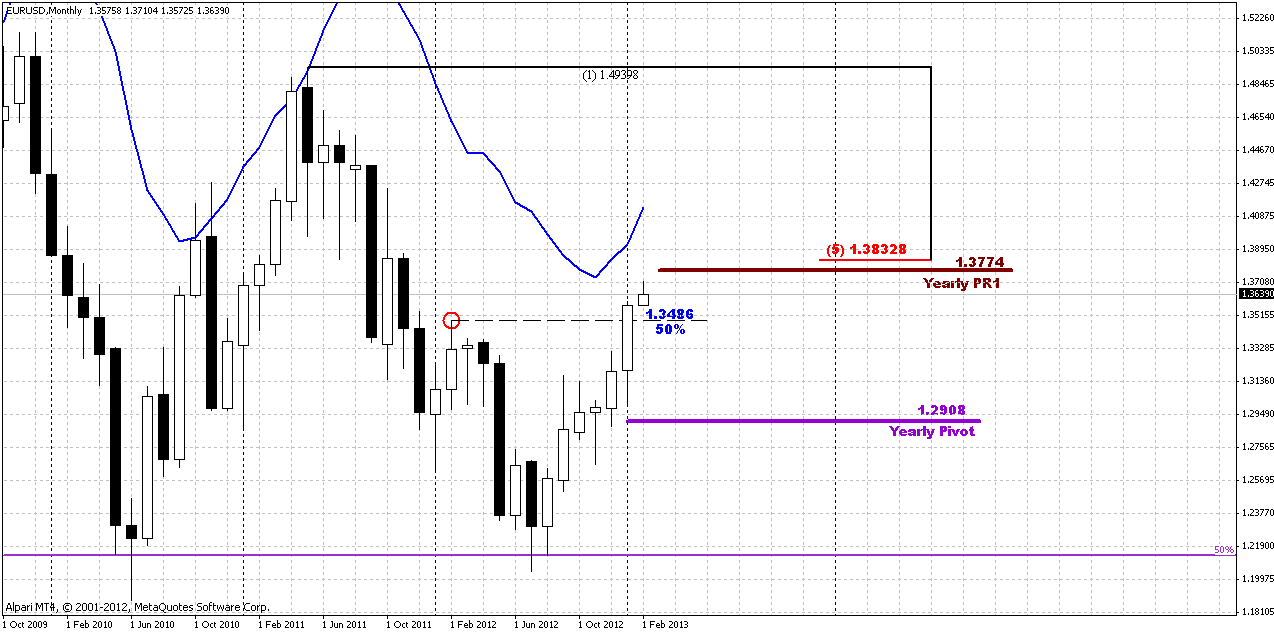
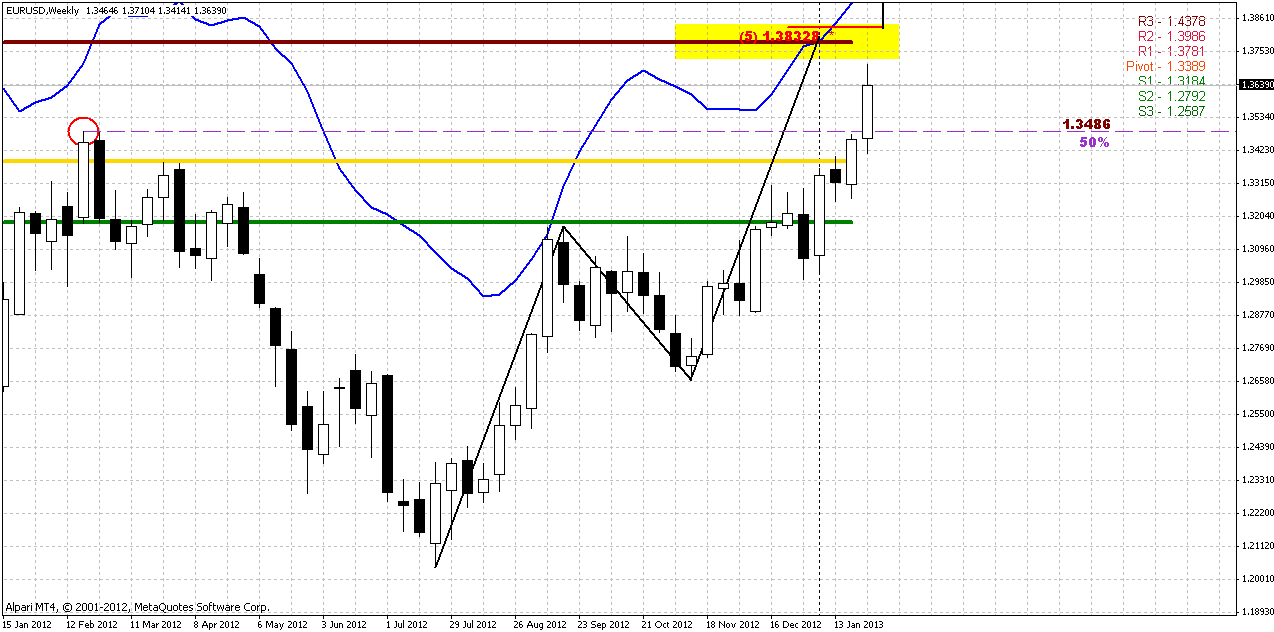
Monthly chart shows significant changes in a long-term setup. On previous week our focus was 1.35 area since it is significant by many reasons. This area is 50% monthly resistance from previous long swing down and that is the top of previous downward swing. As a rule, when market pretends on reversal – first sign of it is greater upward swing compares to previous downswing, i.e. when market breaks “lower highs, lower lows” tendency. That is what we see now. What is also very significant is 1.3486 – is a high of 2012. Now we see that price stands above it. Trend holds bullish here, we see no barriers from overbought – market has enough room to proceed higher and, what is more important, no resistances till our next destination area – 1.3830 major 5/8 monthly resistance.
At the same time, I would like to share another thought with you. 1.3774 is yearly pivot resistance 1. It stands in agreement with major Fib resistance. What do we know about Pivot Resistance 1? When market stands in long-term bear trend, PR1 should hold upward retracement if bearish trend and bear domination is still intact, right? So – we’ll see. The point is, if market will fail around 1.3830 and move below 1.3486 again – that’s the road to yearly pivot first – recall, it hasn’t been tested yet. However this is a bit extended view. On current week, we probably will dive into problem – how to catch the train to 1.3830...
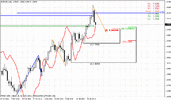
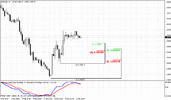
Weekly
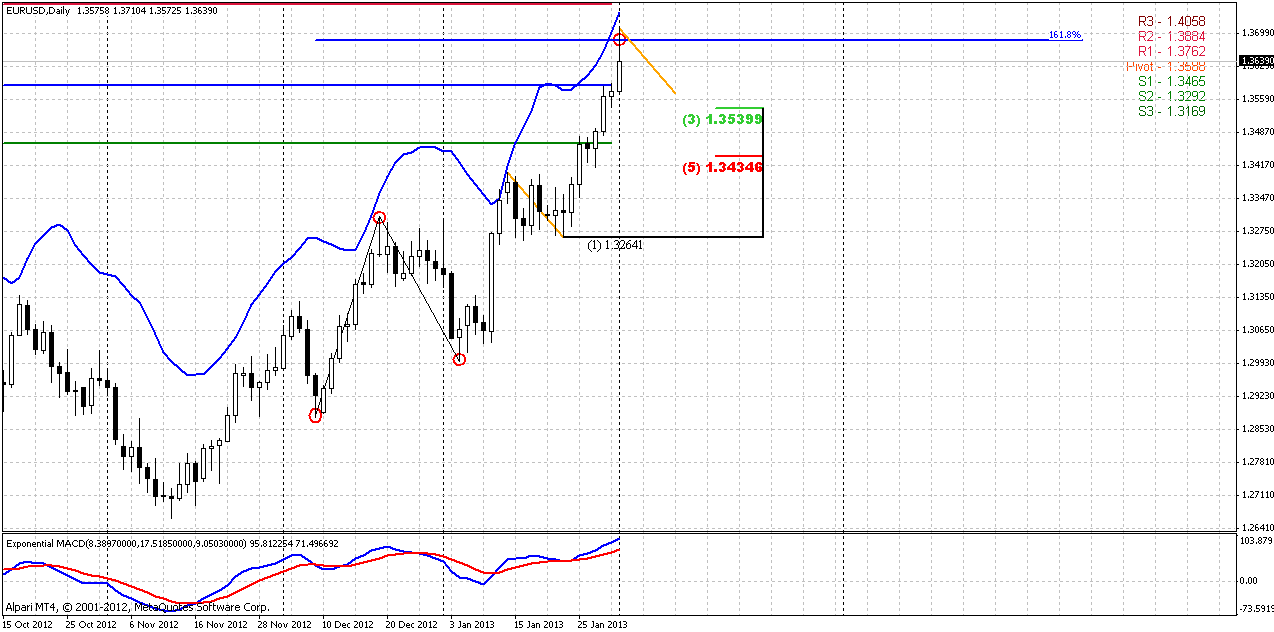
Here we see almost the same content as on monthly chart, but with some valuable add-ons. Trend here is bullish as well; market also has room for upward continuation, since it’s not overbought currently. We have in-progress AB=CD, that has flatter CD leg. Usually it leads to stronger resistance at completion point and deeper retracement as respect of AB-CD pattern. But this is not the whole story. Now we have new monthly pivot levels, and MPR1 of February coincides with AB-CD target and with Yearly PR1. That level 1.3780-1.3830 could become really hard rock resistance. Still, we have approximately 200 pips more to go, we just need to go on shore from Titanic in time.
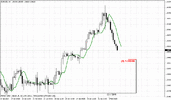
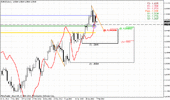
Daily
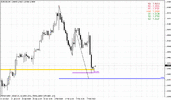
Daily trend is bullish as well, but market has hit overbought here right at 1.618 extension of AB-CD pattern, so here pullback is possible, that we treat as opportunity to join 1.3830 move. In general, EUR is a good-trending currency. It means that as soon as it has caught the trend – it rare shows deep retracement. Usually they are 3/8 from daily swings or even only intraday 3/8 levels. Currently trend on EUR looks nice, trends are bullish on all time frames, we do not have any bearish patterns or directional signals. Hence all that we could do now on EUR is to trade a trend by catching deeps to buy into. Harmonic swings shows that market could show retracement to 1.3560 area – not even quite 3/8 but slightly deeper than coming WPP=1.3588. Other words, it could be just WPP testing.
If we measure deeper swing down, that is BC leg of our AB=CD pattern and count it down from recent high – we will get retracement to 5/8 level – 1.3435. This looks reasonable from perspectives of overbought condition – usually pullback is greater. So, we have only two possible solutions – either to find intraday pattern that will tell us what level to choose, or, simpler way – apply scale entry.
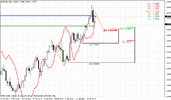
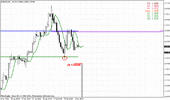
4-hour
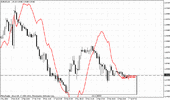
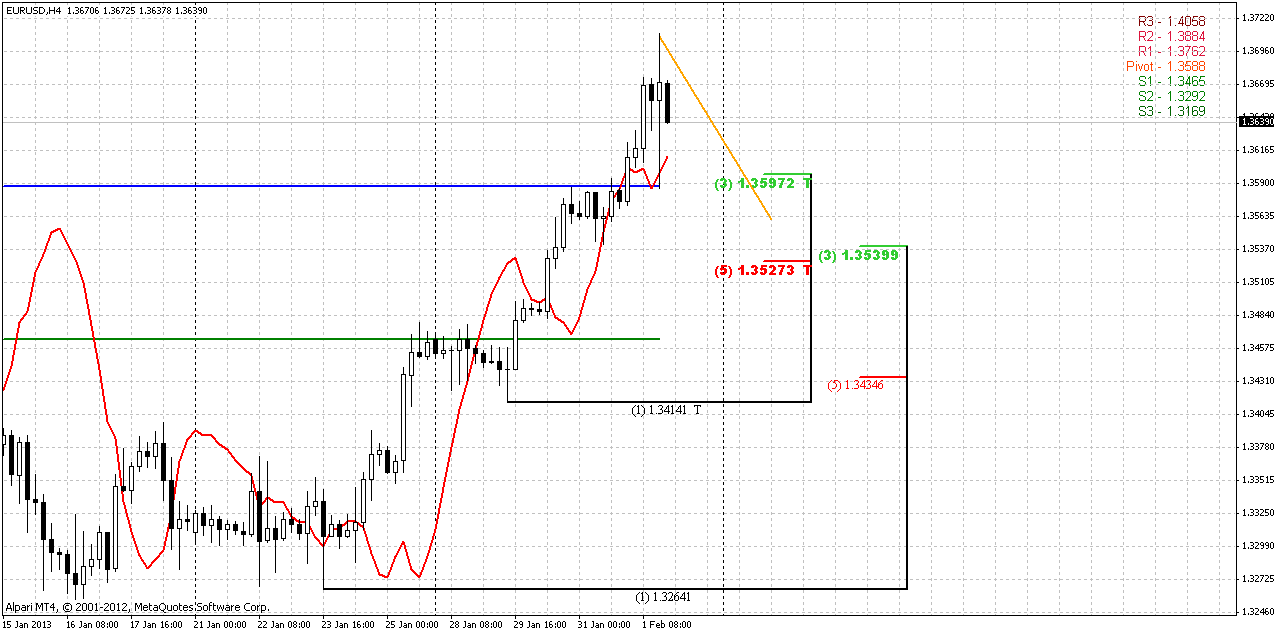
Well, here see nothing definite as well – no patterns, directionals, nothing. Here we have high wave candlestick that indicates indecision, although it is mostly the product of NFP release volatility. Could we speak about stop grabber? I’m not sure, because first it was move down and after that market has taken out previous highs – so it is simulteniously pattern and it’s completion. Anyway I wouldn’t count on it.
So, all that we have is Counfluence support around daily 3/8 level and harmonic swing down. Probably on Monday or Tuesday we will be able to get some pattern, some AB=CD that could indicate where to step in, but here are the same thoughts – around WPP and K-support area.
1-hour
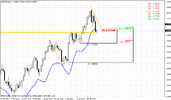
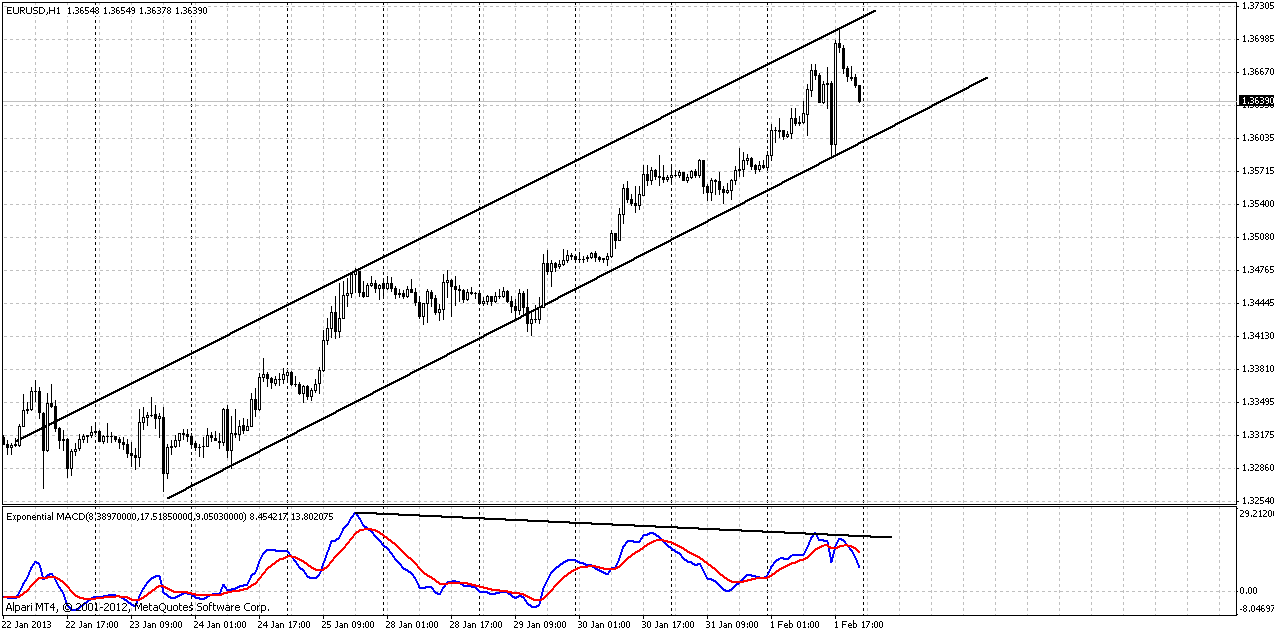
Well, here I see only this upward channel that accompanied by divergence on MACD. May be we will be able to get some small AB-CD down as it was during previous retracement. Anyway our trouble moment – if market will move below WPP and K-support on 4-hour chart. In this case will be better to hold on and avoid enter rashly.
Conclusion:
Although we can count on some further upward continuation to 1.3780-1.3830 area, market is approaching to an area of hard testing of bullish ambitions. It will be significant resistance cluster that includes yearly Pivot resistance 1, MPR1, major 5/8 Fib support and weekly AB=CD target. Also on coming week WPR1 stands also near this level.
That’s why market could be very unstable between previous 1.35 significant level and coming strong resistance. Still, trends are bullish as well as price action, market is not at overbought (only on daily) and has uncompleted weekly AB=CD that it should gravitate to. That’s why it is possible to join upward move at some deep. But due the same reasons – this deep should not be too extended. I prefer to see retracement only to WPP and 4-hour K-resistance area. If market will fail there – better to wait and not enter long. May be we will find some other setups on other currencies in this case, as we did on previous week with Cable…
The technical portion of Sive's analysis owes a great deal to Joe DiNapoli's methods, and uses a number of Joe's proprietary indicators. Please note that Sive's analysis is his own view of the market and is not endorsed by Joe DiNapoli or any related companies.
Monthly chart shows significant changes in a long-term setup. On previous week our focus was 1.35 area since it is significant by many reasons. This area is 50% monthly resistance from previous long swing down and that is the top of previous downward swing. As a rule, when market pretends on reversal – first sign of it is greater upward swing compares to previous downswing, i.e. when market breaks “lower highs, lower lows” tendency. That is what we see now. What is also very significant is 1.3486 – is a high of 2012. Now we see that price stands above it. Trend holds bullish here, we see no barriers from overbought – market has enough room to proceed higher and, what is more important, no resistances till our next destination area – 1.3830 major 5/8 monthly resistance.
At the same time, I would like to share another thought with you. 1.3774 is yearly pivot resistance 1. It stands in agreement with major Fib resistance. What do we know about Pivot Resistance 1? When market stands in long-term bear trend, PR1 should hold upward retracement if bearish trend and bear domination is still intact, right? So – we’ll see. The point is, if market will fail around 1.3830 and move below 1.3486 again – that’s the road to yearly pivot first – recall, it hasn’t been tested yet. However this is a bit extended view. On current week, we probably will dive into problem – how to catch the train to 1.3830...
Weekly
Here we see almost the same content as on monthly chart, but with some valuable add-ons. Trend here is bullish as well; market also has room for upward continuation, since it’s not overbought currently. We have in-progress AB=CD, that has flatter CD leg. Usually it leads to stronger resistance at completion point and deeper retracement as respect of AB-CD pattern. But this is not the whole story. Now we have new monthly pivot levels, and MPR1 of February coincides with AB-CD target and with Yearly PR1. That level 1.3780-1.3830 could become really hard rock resistance. Still, we have approximately 200 pips more to go, we just need to go on shore from Titanic in time.
Daily
Daily trend is bullish as well, but market has hit overbought here right at 1.618 extension of AB-CD pattern, so here pullback is possible, that we treat as opportunity to join 1.3830 move. In general, EUR is a good-trending currency. It means that as soon as it has caught the trend – it rare shows deep retracement. Usually they are 3/8 from daily swings or even only intraday 3/8 levels. Currently trend on EUR looks nice, trends are bullish on all time frames, we do not have any bearish patterns or directional signals. Hence all that we could do now on EUR is to trade a trend by catching deeps to buy into. Harmonic swings shows that market could show retracement to 1.3560 area – not even quite 3/8 but slightly deeper than coming WPP=1.3588. Other words, it could be just WPP testing.
If we measure deeper swing down, that is BC leg of our AB=CD pattern and count it down from recent high – we will get retracement to 5/8 level – 1.3435. This looks reasonable from perspectives of overbought condition – usually pullback is greater. So, we have only two possible solutions – either to find intraday pattern that will tell us what level to choose, or, simpler way – apply scale entry.
4-hour
Well, here see nothing definite as well – no patterns, directionals, nothing. Here we have high wave candlestick that indicates indecision, although it is mostly the product of NFP release volatility. Could we speak about stop grabber? I’m not sure, because first it was move down and after that market has taken out previous highs – so it is simulteniously pattern and it’s completion. Anyway I wouldn’t count on it.
So, all that we have is Counfluence support around daily 3/8 level and harmonic swing down. Probably on Monday or Tuesday we will be able to get some pattern, some AB=CD that could indicate where to step in, but here are the same thoughts – around WPP and K-support area.
1-hour
Well, here I see only this upward channel that accompanied by divergence on MACD. May be we will be able to get some small AB-CD down as it was during previous retracement. Anyway our trouble moment – if market will move below WPP and K-support on 4-hour chart. In this case will be better to hold on and avoid enter rashly.
Conclusion:
Although we can count on some further upward continuation to 1.3780-1.3830 area, market is approaching to an area of hard testing of bullish ambitions. It will be significant resistance cluster that includes yearly Pivot resistance 1, MPR1, major 5/8 Fib support and weekly AB=CD target. Also on coming week WPR1 stands also near this level.
That’s why market could be very unstable between previous 1.35 significant level and coming strong resistance. Still, trends are bullish as well as price action, market is not at overbought (only on daily) and has uncompleted weekly AB=CD that it should gravitate to. That’s why it is possible to join upward move at some deep. But due the same reasons – this deep should not be too extended. I prefer to see retracement only to WPP and 4-hour K-resistance area. If market will fail there – better to wait and not enter long. May be we will find some other setups on other currencies in this case, as we did on previous week with Cable…
The technical portion of Sive's analysis owes a great deal to Joe DiNapoli's methods, and uses a number of Joe's proprietary indicators. Please note that Sive's analysis is his own view of the market and is not endorsed by Joe DiNapoli or any related companies.