Sive Morten
Special Consultant to the FPA
- Messages
- 18,690
Monthly
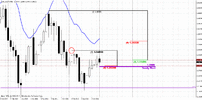
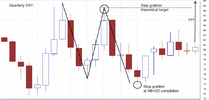
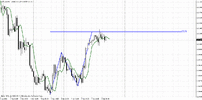
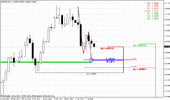
Here we do not have significant changes. January is an inside month yet. Trend holds bullish and looks like market is still struggling with Confluence resistance area. Here is just single valuable add-on – yearly pivot point at 1.2908. It’s significant, since it has relation to yearly sentiment and because market will gravitate to it within a year. Very often pivots are traded in the beginning of the period. Thus, it is very typical for S&P 500 index. Anyway we have to keep an eye on two moments. First is – keep in mind that market should touch 1.2908 area, second – watch how market will behave around it, the same as we deal with WPP and MPP. Market now stands rather close to this level, and I will not be surprised, if we will see it’s testing within current month. Besides, I have some suspicions about current upward action here. If you will compare it’s angle – you’ll see that it is slower than previous upward action, price action doesn’t look as a thrust as well. So, I suspect that it might be just retracement, especially if will take a look again at quarterly chart of Dollar index – see inlay picture. Recall – this is our long-term forecast and based on it we had stop grabber (I do not have MACDP on DXY chart) right at completion point of AB=CD. Theoretically it should lead DXY above 89 highs that is relatively correspond with 1.15-1.16 level on EUR/USD. As we see on DXY chart, stop grabber was not cancelled, although the move us is quite slow, market has hit 84 level – that is 0.618 extension of AB-CD upward pattern. I do not argue, may be this is a bit far-fetched idea, but numbers stand as they are.
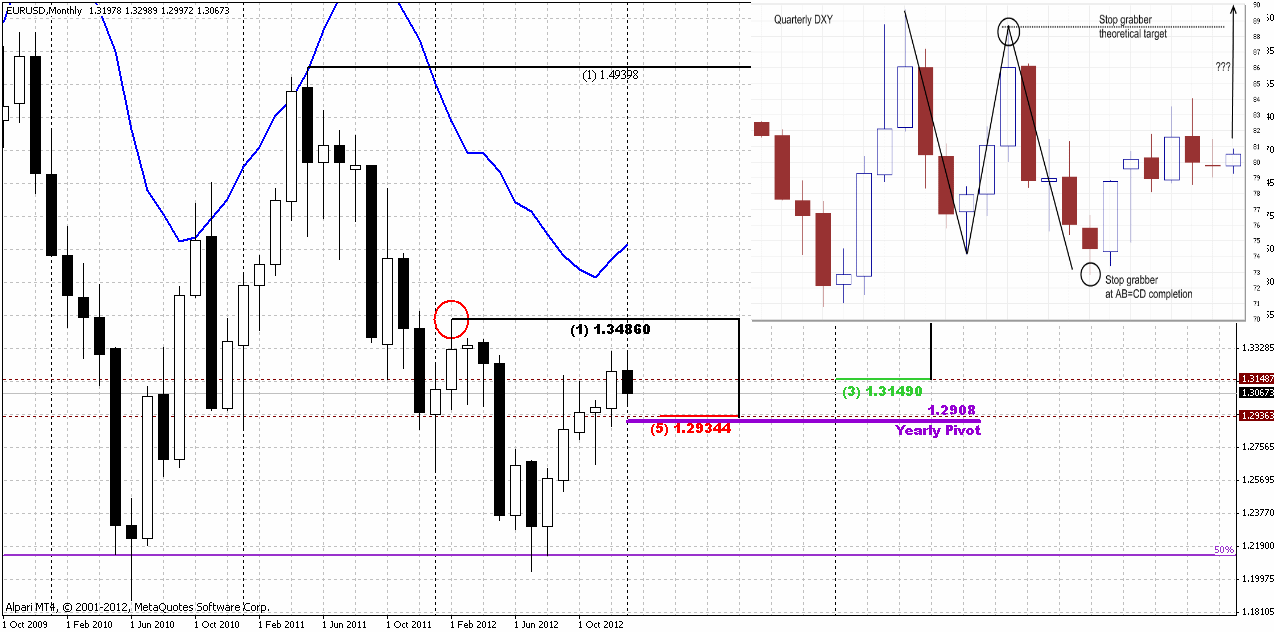
I also attach separately chart for DXY
Weekly
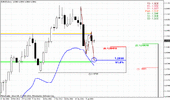
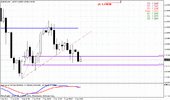
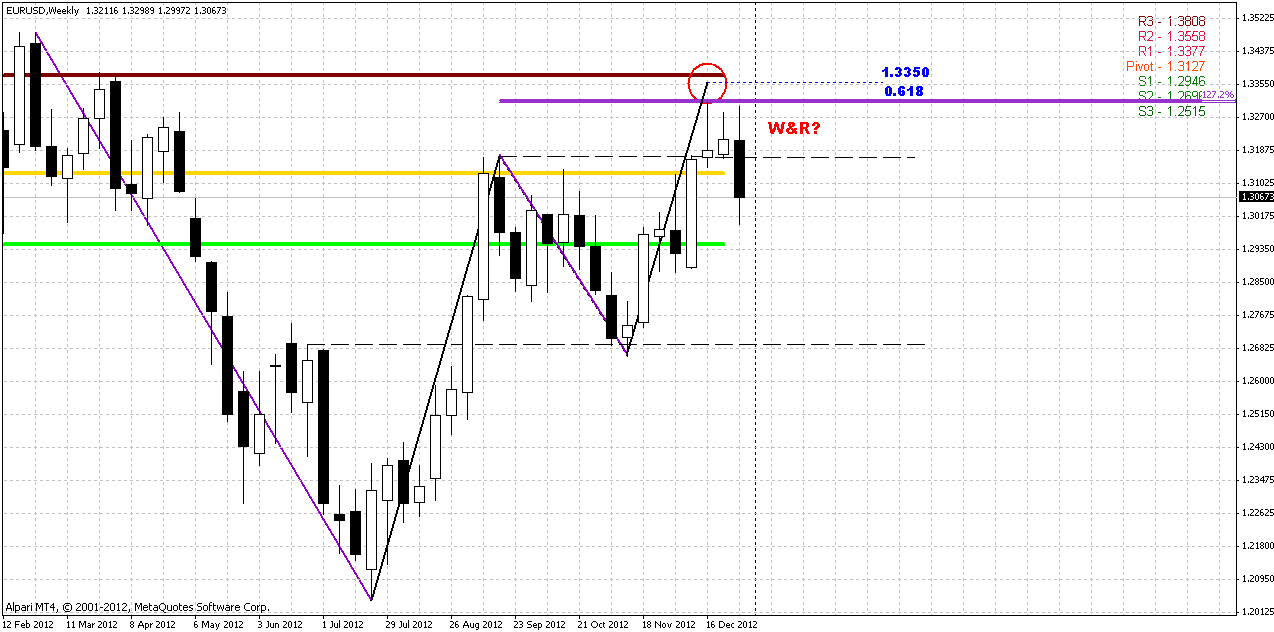
Understanding where we are in a big picture ever more pressingly. Action on weekly chart – what was that? At first glance, as we’ve said, market has destroyed all bullish setups that were prepared within significant period of time by it. That hardly could happen just occasionally. I mean unnatural return back inside of the range prior of reaching 0.618 target of AB-CD pattern, although it has happened right from significant resistance area – double of 1.27 extensions of different previous swings. This looks like Wash&Rinse of the previous top. Market now stands below MPP and price has shown move down after two flat indecision weeks, the latter of which was simultaneously an inside week.
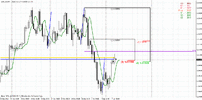
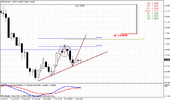
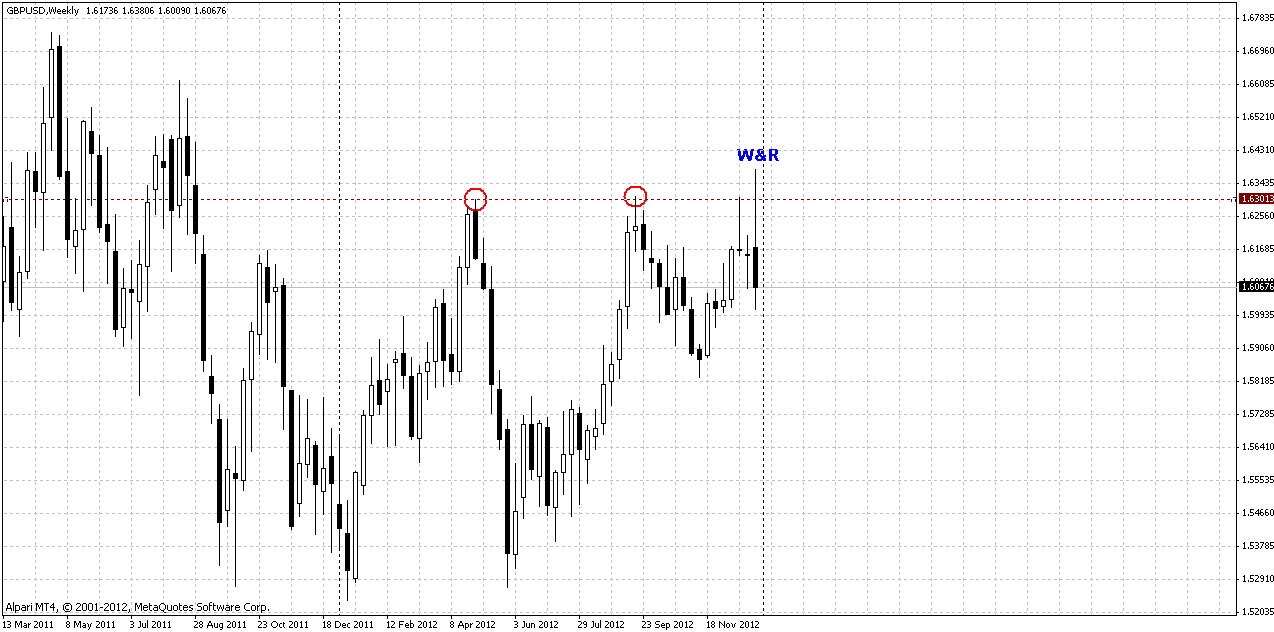
If we will take a look at GBP chart – here it looks even more decisive. Here is on just clear W&R but trend has turned bearish as well on weekly chart:
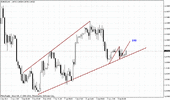
But take a look at another chart:
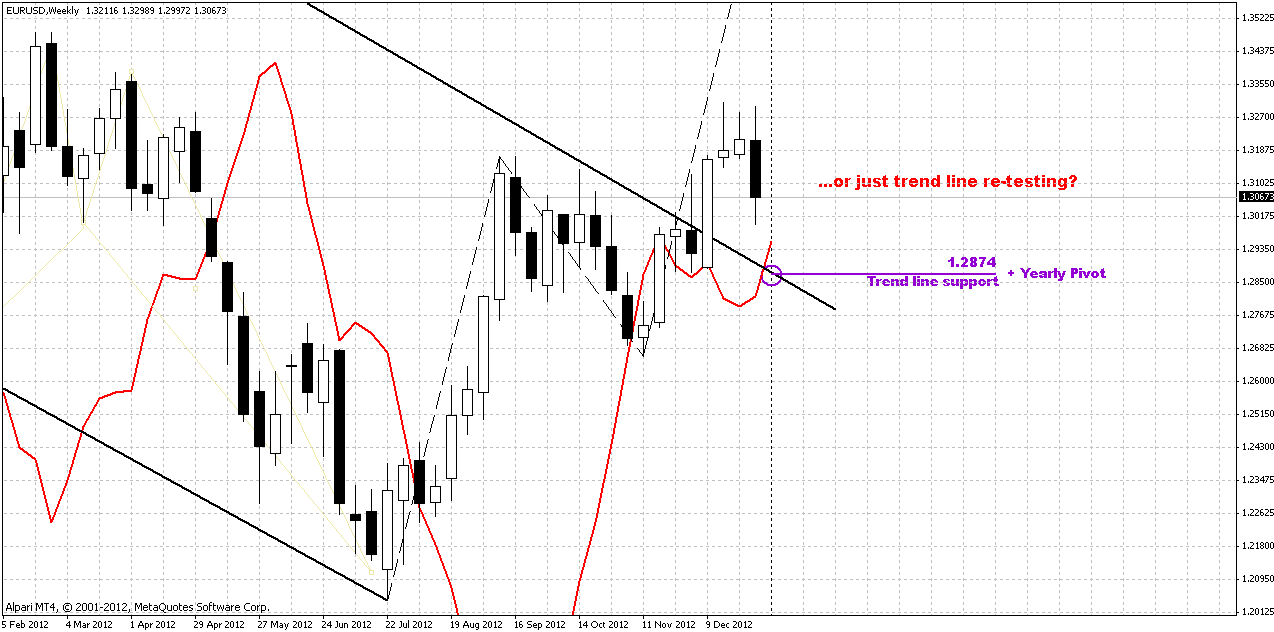
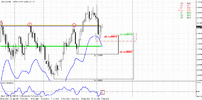
Why it can’t become just re-testing of trend line that by the way, stands in the same are as Yearly Pivot on coming week? Here we have MPS1 as well around 1.2946 level.
Although in medium-term perspective it looks blurring, fortunately both of these scenarios suggest downward action in short term period. Now we need to find good and safe entry opportunity that could give us the chance to protect our position with breakeven stop with nice probability.
Daily
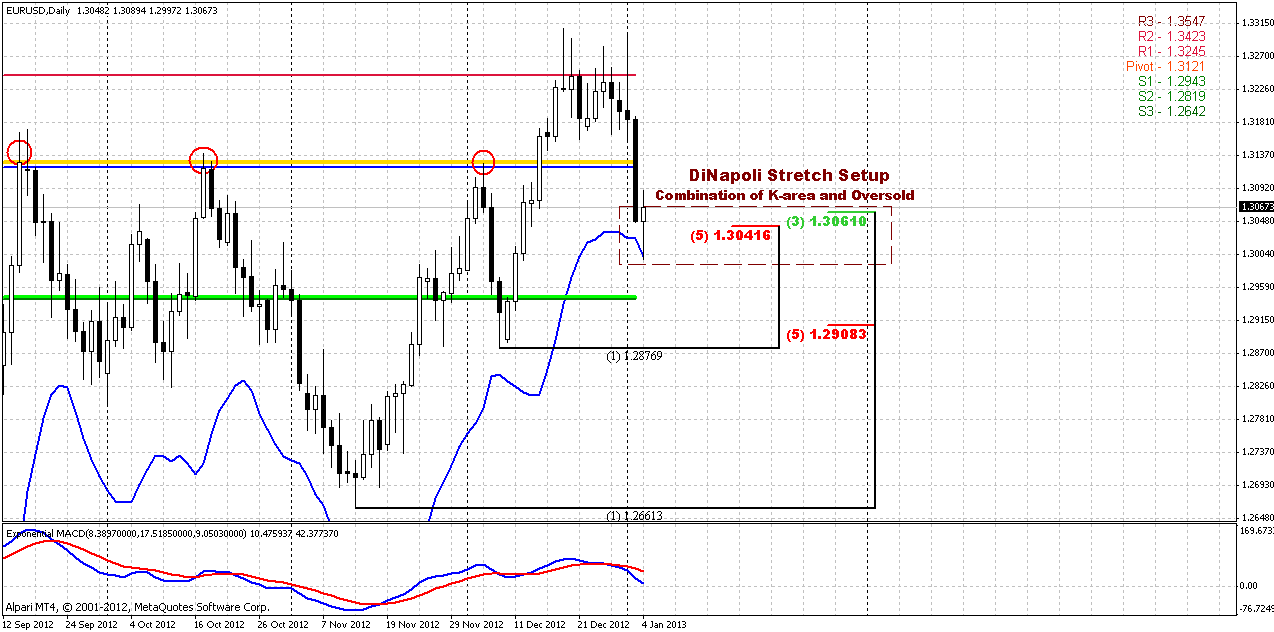
Our yesterday’s stake on pause in downward action has worked, but that is just a details. In general we have DiNapoli bullish directional pattern setup that calls as “Stretch”. This is a combination of oversold and strong support area – in our case this is daily Confluence support. Stretch is a tricky pattern by many reasons. First is because it based on retracement action rather than thrusting one, since it leads market to bounce to correct unpleasant oversold condition. That in turn, leads to difficulties with Stretch’s target estimation. Third is – stretch is counter trend pattern. That’s why to deal with it – is really tough task, it demands experience and wide open eyes to exit leave it in time. Due to all these properties, Stretch could lead to situation when it will reach the target, but you will not get profit, or even will finish with loss. How it could be? Since Stretch is based on oversold, it treated that it has completed when oversold condition will fade out. But oversold and overbought are dynamic parameters, thus, oversold could be eliminated, but price will stand flat or even continue move down but with less pace. In this case you will be in loss… So, make our own choice – to deal with it or not. Here I will use it only as a pattern that points on possible bounce up.
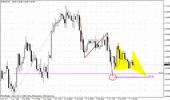
Thus, we see that bounce is in progress, but how deep it could be? If we suggest that this is just a bounce, and we have reasons to think it in this way – then I prefer to see pullback only to 1.3120-1.3150 area. Take a look how close monthly and weekly pivots will be on coming week. They coincide with each other. Thus, it’s logical to see testing of WPP and re-testing of MPP. That will be the natural support/resistance line as well. Simultaneously this is weekly sentiment breakeven point – moving above it will it market out of the range again. Other words, we can be absolutely calm from bearish point of view, till 1.3150 area. If market will exceed it, I will not easily enter on short side.
4-hour
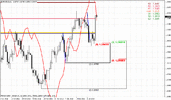
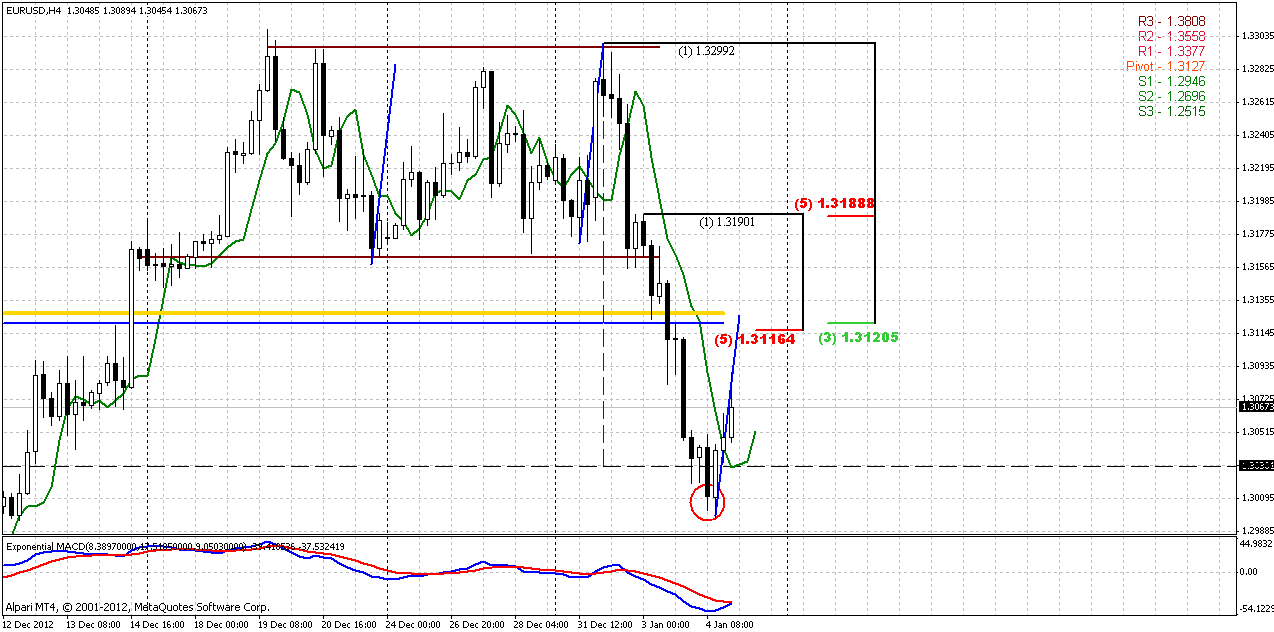
It’s very informative chart. Market has formed perfect bullish engulfing pattern right at rectangle’s breakout classical destination point – these old tricks still work… Now, we see that 1.3130 area is not just pivot agreement but 4-hour Confluence resistance as well, so market doesn’t leave us any choice. This level will be extremely important and perfect for searching of bearish entry possibility. Upward breakout of this level itself will indicate that bears feel bad. Also I use harmonic swings as well here – take a look, it shows at the same level.
Currently it’s very difficult to predict – will it be B&B “Sell”, I hope it will, although we already have 2 closes above 3x3. For perfect pattern, price should reach resistance within 1 candle. If we will get jump up at open, for instance, but if it will be AB=CD instead, I will not upset too much. One thing that we need to get here is gradual move to resistance, retracement-kind action.
1-hour
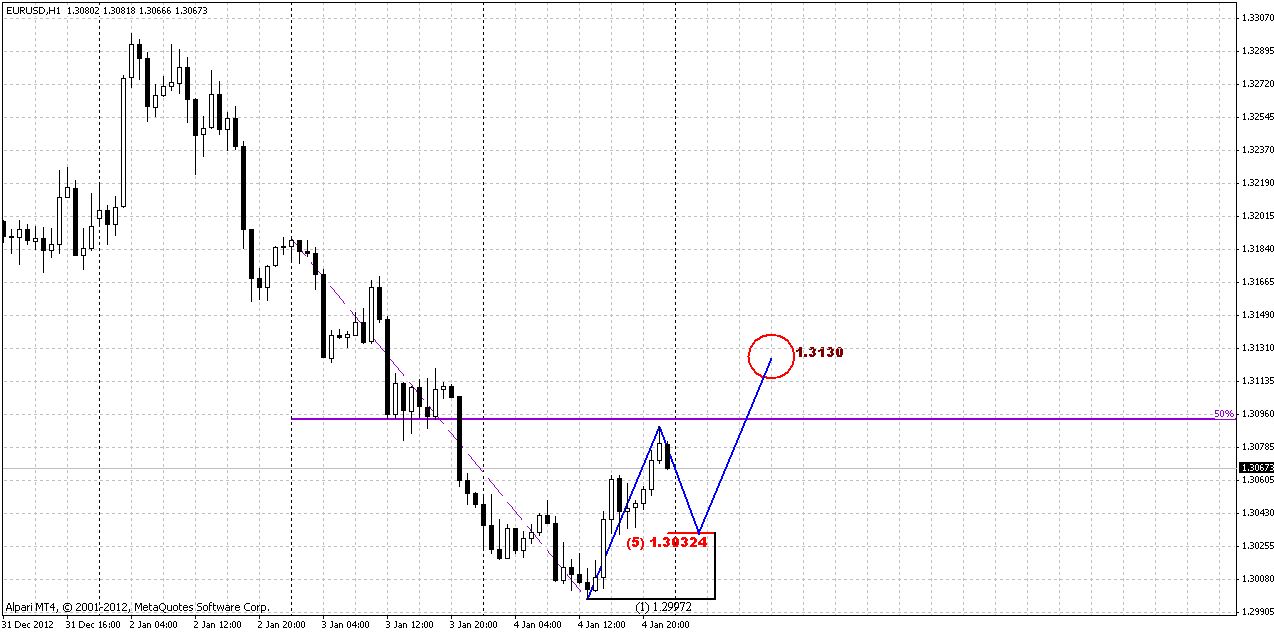
Since we already have context for B&B “Sell” on 4-hour chart, it could happen so, that it will work but this will not cancel potential move to 1.3130 area. Here is the chart how it could happen. Take a look, that now market stands at 50% resistance of most recent swing down and has two closes above 3x3 DMA – that is context for B&B. the minimum target of this pattern is 0.618 support of whole back move – this is 1.3030 area. Hence, if market will complete B&B pattern and later will form AB=CD – it will lead us precisely to our 1.3130 strong resistance area… Do not treat this as guide to action, this is just an assumption and attempt to combine different scenarios.
Conclusion:
In a big picture I suppose that we stand at the eve of great clarification. Something is happening here on EUR/USD, but it is still covered by market volatility and unclear signs. Still, we have Dollar index, JPY action, Gold AB=CD completion on weekly chart, GBP W&R. Looks like something is changing, and at first glance, it turns in favor of USD.
Still our focus is daily trading, and here is relatively simple setup. Market should hold below 1.3110-1.3140 resistance with retracement-kind action. This will lead us to short entry. If market will move above this area – do not enter short, wait for further clarification.
The technical portion of Sive's analysis owes a great deal to Joe DiNapoli's methods, and uses a number of Joe's proprietary indicators. Please note that Sive's analysis is his own view of the market and is not endorsed by Joe DiNapoli or any related companies.
Here we do not have significant changes. January is an inside month yet. Trend holds bullish and looks like market is still struggling with Confluence resistance area. Here is just single valuable add-on – yearly pivot point at 1.2908. It’s significant, since it has relation to yearly sentiment and because market will gravitate to it within a year. Very often pivots are traded in the beginning of the period. Thus, it is very typical for S&P 500 index. Anyway we have to keep an eye on two moments. First is – keep in mind that market should touch 1.2908 area, second – watch how market will behave around it, the same as we deal with WPP and MPP. Market now stands rather close to this level, and I will not be surprised, if we will see it’s testing within current month. Besides, I have some suspicions about current upward action here. If you will compare it’s angle – you’ll see that it is slower than previous upward action, price action doesn’t look as a thrust as well. So, I suspect that it might be just retracement, especially if will take a look again at quarterly chart of Dollar index – see inlay picture. Recall – this is our long-term forecast and based on it we had stop grabber (I do not have MACDP on DXY chart) right at completion point of AB=CD. Theoretically it should lead DXY above 89 highs that is relatively correspond with 1.15-1.16 level on EUR/USD. As we see on DXY chart, stop grabber was not cancelled, although the move us is quite slow, market has hit 84 level – that is 0.618 extension of AB-CD upward pattern. I do not argue, may be this is a bit far-fetched idea, but numbers stand as they are.

I also attach separately chart for DXY
Weekly
Understanding where we are in a big picture ever more pressingly. Action on weekly chart – what was that? At first glance, as we’ve said, market has destroyed all bullish setups that were prepared within significant period of time by it. That hardly could happen just occasionally. I mean unnatural return back inside of the range prior of reaching 0.618 target of AB-CD pattern, although it has happened right from significant resistance area – double of 1.27 extensions of different previous swings. This looks like Wash&Rinse of the previous top. Market now stands below MPP and price has shown move down after two flat indecision weeks, the latter of which was simultaneously an inside week.

If we will take a look at GBP chart – here it looks even more decisive. Here is on just clear W&R but trend has turned bearish as well on weekly chart:

But take a look at another chart:

Why it can’t become just re-testing of trend line that by the way, stands in the same are as Yearly Pivot on coming week? Here we have MPS1 as well around 1.2946 level.
Although in medium-term perspective it looks blurring, fortunately both of these scenarios suggest downward action in short term period. Now we need to find good and safe entry opportunity that could give us the chance to protect our position with breakeven stop with nice probability.
Daily
Our yesterday’s stake on pause in downward action has worked, but that is just a details. In general we have DiNapoli bullish directional pattern setup that calls as “Stretch”. This is a combination of oversold and strong support area – in our case this is daily Confluence support. Stretch is a tricky pattern by many reasons. First is because it based on retracement action rather than thrusting one, since it leads market to bounce to correct unpleasant oversold condition. That in turn, leads to difficulties with Stretch’s target estimation. Third is – stretch is counter trend pattern. That’s why to deal with it – is really tough task, it demands experience and wide open eyes to exit leave it in time. Due to all these properties, Stretch could lead to situation when it will reach the target, but you will not get profit, or even will finish with loss. How it could be? Since Stretch is based on oversold, it treated that it has completed when oversold condition will fade out. But oversold and overbought are dynamic parameters, thus, oversold could be eliminated, but price will stand flat or even continue move down but with less pace. In this case you will be in loss… So, make our own choice – to deal with it or not. Here I will use it only as a pattern that points on possible bounce up.
Thus, we see that bounce is in progress, but how deep it could be? If we suggest that this is just a bounce, and we have reasons to think it in this way – then I prefer to see pullback only to 1.3120-1.3150 area. Take a look how close monthly and weekly pivots will be on coming week. They coincide with each other. Thus, it’s logical to see testing of WPP and re-testing of MPP. That will be the natural support/resistance line as well. Simultaneously this is weekly sentiment breakeven point – moving above it will it market out of the range again. Other words, we can be absolutely calm from bearish point of view, till 1.3150 area. If market will exceed it, I will not easily enter on short side.

4-hour
It’s very informative chart. Market has formed perfect bullish engulfing pattern right at rectangle’s breakout classical destination point – these old tricks still work… Now, we see that 1.3130 area is not just pivot agreement but 4-hour Confluence resistance as well, so market doesn’t leave us any choice. This level will be extremely important and perfect for searching of bearish entry possibility. Upward breakout of this level itself will indicate that bears feel bad. Also I use harmonic swings as well here – take a look, it shows at the same level.
Currently it’s very difficult to predict – will it be B&B “Sell”, I hope it will, although we already have 2 closes above 3x3. For perfect pattern, price should reach resistance within 1 candle. If we will get jump up at open, for instance, but if it will be AB=CD instead, I will not upset too much. One thing that we need to get here is gradual move to resistance, retracement-kind action.

1-hour
Since we already have context for B&B “Sell” on 4-hour chart, it could happen so, that it will work but this will not cancel potential move to 1.3130 area. Here is the chart how it could happen. Take a look, that now market stands at 50% resistance of most recent swing down and has two closes above 3x3 DMA – that is context for B&B. the minimum target of this pattern is 0.618 support of whole back move – this is 1.3030 area. Hence, if market will complete B&B pattern and later will form AB=CD – it will lead us precisely to our 1.3130 strong resistance area… Do not treat this as guide to action, this is just an assumption and attempt to combine different scenarios.

Conclusion:
In a big picture I suppose that we stand at the eve of great clarification. Something is happening here on EUR/USD, but it is still covered by market volatility and unclear signs. Still, we have Dollar index, JPY action, Gold AB=CD completion on weekly chart, GBP W&R. Looks like something is changing, and at first glance, it turns in favor of USD.
Still our focus is daily trading, and here is relatively simple setup. Market should hold below 1.3110-1.3140 resistance with retracement-kind action. This will lead us to short entry. If market will move above this area – do not enter short, wait for further clarification.
The technical portion of Sive's analysis owes a great deal to Joe DiNapoli's methods, and uses a number of Joe's proprietary indicators. Please note that Sive's analysis is his own view of the market and is not endorsed by Joe DiNapoli or any related companies.
