Sive Morten
Special Consultant to the FPA
- Messages
- 18,673
Fundamentals
So first July week is over. Despite it was short due Independence Day in US, we've got some important information for our long-term setups as on EUR as on GBP. Everything is twisted around recent statistics, because right now it depends on numbers whether we right or wrong.
Let's start with GBP first, as it is more simple situation around it. Last week we put extended discussion on UK fundamentals and updated our long-term view on GBP. Although major points of our conception are valid, we brought some new details. In particular, investors do not believe to BoE and have different, more dovish view, despite BoE comments. This week we've got fresh data which supports our long-term bearish view. Next week UK will release GDP numbers for June that also promise to be important.
As Reuters reports - Sterling and gilt yields fell on Wednesday as economic data reinforced money markets’ view that the Bank of England would join its central bank counterparts in cutting interest rates to shore up a worsening economic outlook.
The U.K. composite purchasing managers’ index fell to 49.7 in June from 50.9 in May, slipping into contraction territory for the first time since mid-2016 due to gloomy manufacturing and construction PMIs. Services PMI just stayed around 50, coming in below-forecast
The data “underpins the type of concerns that (Mark) Carney is projecting,” said Jane Foley, senior forex strategist at Rabobank.
“The 90 level (in euro-sterling) looks a little more vulnerable than it did before,” said Foley, noting the level had been unsuccessfully tested recently. “Psychologically, 90 for euro-sterling is very important.”
UK government bond yields fell sharply on Tuesday after BoE Governor Mark Carney flagged uncertainties stemming from trade disputes and Britain’s departure from the European Union.
Markets interpreted the comments as dovish, pushing 10-year British government bond yields under the BOE policy rate of 0.75% for the first time in a decade. Participants have nearly priced in a 25 basis-points rate cut in the next 12 months.
In another sign of market concern, two-year yields fell below the five-year one for the first time since August 2008, a curve inversion that can herald an economic downturn.
“It looks like the BoE is lining up a more realistic view on Brexit. If Brexit is delayed again it looks like Carney is potentially teeing up a rate cut,” said Colin Asher, senior economist at Mizuho.
Markets also remain concerned over Britain’s chances of striking a Brexit withdrawal deal with the EU before the Oct. 31 departure deadline.
The governing Conservative Party is due to name either Boris Johnson or Jeremy Hunt as its new leader on July 23, but analysts say whoever then becomes prime minister is unlikely to have enough time to renegotiate a deal with Europe before the Halloween deadline.
The new prime minister would also have to deal with Ursula von der Leyen, the German nominee to become European Commission president. Von der Leyen has been scathing about the referendum campaign run by Brexit-leaning UK politicians.
“It looks like she isn’t going to give an inch in respect to” the new British prime minister trying to renegotiate a deal with Europe, said Rabobank’s Foley.
So, it seems that Brexit negotiations could go harder if Von der Leyen will become EC President. All these new perfectly match to our long-term puzzle and keeps long-term bearish view valid.
Now let's turn to our second topic - change in Fed policy, recent NFP data and EUR/USD.
The U.S. dollar gained against a basket of currencies to its highest levels in 2-1/2 weeks on Friday after data showed that U.S. job growth rebounded strongly in June.
Non-farm payrolls increased by 224,000 jobs last month, the most in five months, and well above the 160,000 jobs forecast by economists.
The strong gains came after job growth slowed sharply in May. The economy created 11,000 fewer jobs in April and May than previously reported, the government said on Friday.
“You look at the U.S. number for today and there’s quite a bit of sticker shock with that,” said Bipan Rai, North America head of fx strategy at CIBC Capital Markets in Toronto. “We think the sticker shock and thin liquidity is enough to drive the dollar a little bit firmer for today.”
The data came as many traders and investors were away, a day after the July 4 holiday and ahead of the weekend.
Moderate wage gains in June, however, added to evidence that the economy is slowing while the increase in jobs was not enough to offset weakness in May.
“You did get a massive upside surprise but again that’s coming after a month in which you had a massive downside miss,” Rai said. “If you take the two numbers together you are still averaging at a clip that’s slower than prior years’ growth.”
Average hourly earnings rose 6 cents, or 0.2%, after gaining 0.3% in May. That kept the annual increase in wages at 3.1% for a second straight month.
The dollar has weakened from a two-year high reached in May on growing expectations that the Federal Reserve is closer to cutting interest rates.
U.S. economic growth continued “at a solid pace” in the first half of the year though it likely weakened in recent months as higher tariffs depressed global trade and business investment weakened, the Fed said on Friday in its semi-annual report to Congress.
The euro also came under pressure on Friday after data showed that German industrial orders fell far more than expected in May, and the Economy Ministry warned that this sector of Europe’s largest economy was likely to remain weak in the coming months.
A relentless slide in European government bond yields has forced investors to look for higher-yielding assets elsewhere, which is holding back a sustained euro rally against the greenback.
The data that we've got perfectly match to our concern on Fed policy, that we've discussed two weeks ago. Guys, if 160K net NFP and 3.1% of wage inflation is bad data - what would you call as good data? The story repeats as market again was waiting for 0.1% inflation more than it was. This happens again and again and every time TV tells that data misses expectations and this explains that it is bad. We still think that this is absurd.
Now market prepares to IIQ GDP report in July and next Fed meeting on 31st of July. Next week seems as not very important but we will get FOMC meeting of last June session and different US inflation data. So, it also is interesting.
Finally, last week we've said, it is interesting what Fathom thinks on our suggestion that US economy is not in recession and Fed should not cut the rate by purely economical reasons. Here is what they think:
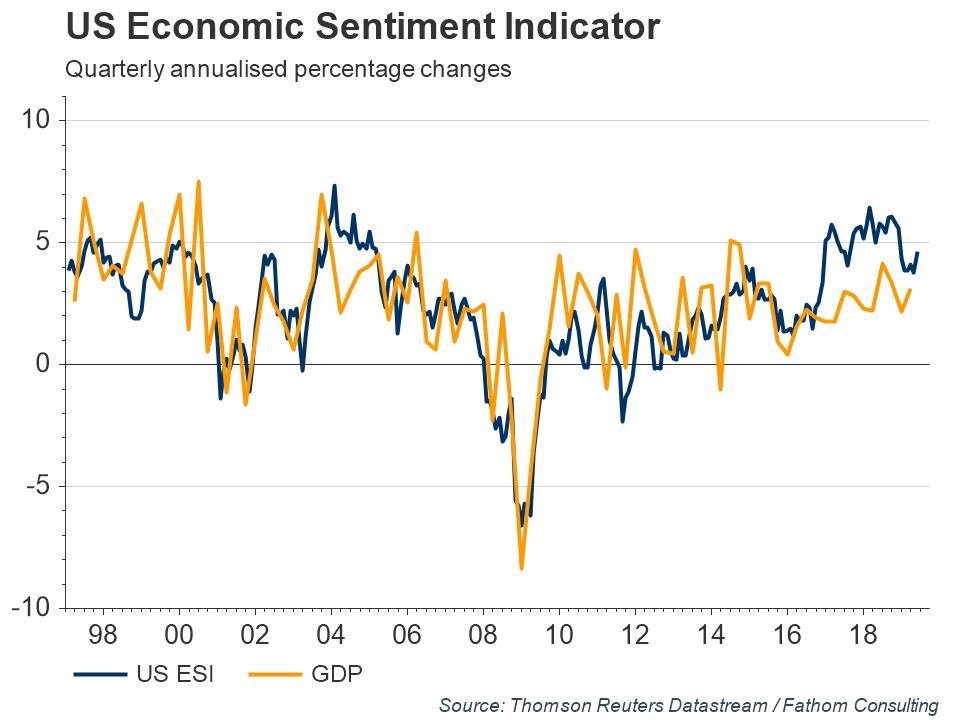
We think that investors are overestimating the probability of the Fed cutting rates this year (one 25 basis point cut now seems possible, although not three as priced in by the market) — last week’s ESI reading supports that view. Admittedly, inflationary pressures have remained somewhat subdued and we think that GDP growth is set to slow from an annualised pace of 3.1% in Q1, but we do not think that it will slow enough to warrant a rate cut, or to spur the Fed into imminent action, as many investors seem to expect.
So, Fathom takes careful position. In general, it agrees with our doubts but in longer-term perspective. Indeed, according to CME Fed watch tool, market shows 95% expectation of rate cut in July. As it stands too few time till the Fed meeting, it is difficult to take opposite opinion and state that Fed will not cut the rate. It is even more difficult, knowing that Fed tries to follow the market when it is possible. But, still I think that flat decision in July is still possible as no objective reasons stands for rate cut now.
In longer-term perspective we see clear signs of USD undervalue as market is priced-in too dovish Fed policy. Thus, NFP test has passed and I would treat it's result as supportive to our view rather than contradictive. But major tests are still ahead - GDP and Fed meeting.
Technicals
Monthly
As you understand, quiet standing brings nothing new to our technical view, especially on longer-term charts. We hope that coming IIQ GDP in July and Fed meeting will shake the market a bit.
Monthly chart creates no new range and stands inside one that was formed in the beginning of the month. So the intrigue still stands around major support where price stands right now.
Our nearest culmination point is Fed July meeting which should clarify whether we right or wrong in our hypothesis. Our plan (according to fundamental issues) tends to idea of downside breakout.
As we've said last week, changes are still look insignificant, trend stands bearish. Monthly chart is rather large and any upside action will have retracement feature, until 1.26 area breakout. The first meaningful resistance here stands around YPP of 1.1740 area, which approximately agrees with 3/8 Fib resistance.

Weekly
Our longer-term patterns here stand the same as no major breakouts have happened.
As investors hew to Fed policy, we keep scenario with potential bullish reversal pattern on weekly chart, first time we introduced few weeks ago. This is reverse H&S pattern. As road to the head's bottom was choppy as upside road to neckline also could be choppy.
The specific of H&S pattern is its dual character. It keeps door open for both scenarios. Upside scenario is based on reverse H&S while downside scenario could be confirmed by its failure, which happens around Right arm bottom.
Meantime, we've got clear Evening star pattern. As markets still have two weeks till major events, EUR could spend this time working with this pattern. It suggests downside continuation, which usually takes the shape of AB=CD pattern on daily/4H chart.

Daily
This week EUR confirms our doubts of upside continuation as market's behavior doesn't match to common bullish market action. As a result, price has dropped below all major intraday support levels, including our major K-support and Agreement around 1.1280 area. This makes difficult to treat current market as bullish.
The only bullish hope that we could find here is harmony. Price shape to the left and right shows mirror action, and recent drop repeats mirror action to the left. So, keeping this choppiness EUR theoretically could keep upside direction. But, as you understand this is not sufficient background.
Thus, next week we think we could try to play weekly candlestick pattern. Now EUR stands at major daily support, MPS1 and near daily oversold. Since market was relatively thin this week, the next one should start with upside bounce:

Intraday
We have two levels that are suitable for short entry. First one is K-support around WPP 1.1277-1.1284, and second one is 5/8 resistance around WPR1 and 1.1330 level. Right now we do not have yet any reversal patterns on 1H chart.
On Monday morning EUR could drop a bit more first, just to complete OP target and then start retracement up. It is not forbidden, as usual, taking any long trade, if you see good background, but scale of this trade is too small for periods of our updates. Thus, we mostly keep an eye on daily/4H setups and here our context is bearish. We intend to use possible upside bounce for short entry but do not trade it.

Conclusion:
Recent NFP data supports our doubts on Fed dovish policy and shows that market undervalues USD, pricing in too dovish Fed policy.
Now EUR has two weeks of "free action" till major events and we could focus on tactical setup, which is weekly bearish candlestick pattern.
The technical portion of Sive's analysis owes a great deal to Joe DiNapoli's methods, and uses a number of Joe's proprietary indicators. Please note that Sive's analysis is his own view of the market and is not endorsed by Joe DiNapoli or any related companies.
So first July week is over. Despite it was short due Independence Day in US, we've got some important information for our long-term setups as on EUR as on GBP. Everything is twisted around recent statistics, because right now it depends on numbers whether we right or wrong.
Let's start with GBP first, as it is more simple situation around it. Last week we put extended discussion on UK fundamentals and updated our long-term view on GBP. Although major points of our conception are valid, we brought some new details. In particular, investors do not believe to BoE and have different, more dovish view, despite BoE comments. This week we've got fresh data which supports our long-term bearish view. Next week UK will release GDP numbers for June that also promise to be important.
As Reuters reports - Sterling and gilt yields fell on Wednesday as economic data reinforced money markets’ view that the Bank of England would join its central bank counterparts in cutting interest rates to shore up a worsening economic outlook.
The U.K. composite purchasing managers’ index fell to 49.7 in June from 50.9 in May, slipping into contraction territory for the first time since mid-2016 due to gloomy manufacturing and construction PMIs. Services PMI just stayed around 50, coming in below-forecast
The data “underpins the type of concerns that (Mark) Carney is projecting,” said Jane Foley, senior forex strategist at Rabobank.
“The 90 level (in euro-sterling) looks a little more vulnerable than it did before,” said Foley, noting the level had been unsuccessfully tested recently. “Psychologically, 90 for euro-sterling is very important.”
UK government bond yields fell sharply on Tuesday after BoE Governor Mark Carney flagged uncertainties stemming from trade disputes and Britain’s departure from the European Union.
Markets interpreted the comments as dovish, pushing 10-year British government bond yields under the BOE policy rate of 0.75% for the first time in a decade. Participants have nearly priced in a 25 basis-points rate cut in the next 12 months.
In another sign of market concern, two-year yields fell below the five-year one for the first time since August 2008, a curve inversion that can herald an economic downturn.
“It looks like the BoE is lining up a more realistic view on Brexit. If Brexit is delayed again it looks like Carney is potentially teeing up a rate cut,” said Colin Asher, senior economist at Mizuho.
Markets also remain concerned over Britain’s chances of striking a Brexit withdrawal deal with the EU before the Oct. 31 departure deadline.
The governing Conservative Party is due to name either Boris Johnson or Jeremy Hunt as its new leader on July 23, but analysts say whoever then becomes prime minister is unlikely to have enough time to renegotiate a deal with Europe before the Halloween deadline.
The new prime minister would also have to deal with Ursula von der Leyen, the German nominee to become European Commission president. Von der Leyen has been scathing about the referendum campaign run by Brexit-leaning UK politicians.
“It looks like she isn’t going to give an inch in respect to” the new British prime minister trying to renegotiate a deal with Europe, said Rabobank’s Foley.
So, it seems that Brexit negotiations could go harder if Von der Leyen will become EC President. All these new perfectly match to our long-term puzzle and keeps long-term bearish view valid.
Now let's turn to our second topic - change in Fed policy, recent NFP data and EUR/USD.
The U.S. dollar gained against a basket of currencies to its highest levels in 2-1/2 weeks on Friday after data showed that U.S. job growth rebounded strongly in June.
Non-farm payrolls increased by 224,000 jobs last month, the most in five months, and well above the 160,000 jobs forecast by economists.
The strong gains came after job growth slowed sharply in May. The economy created 11,000 fewer jobs in April and May than previously reported, the government said on Friday.
“You look at the U.S. number for today and there’s quite a bit of sticker shock with that,” said Bipan Rai, North America head of fx strategy at CIBC Capital Markets in Toronto. “We think the sticker shock and thin liquidity is enough to drive the dollar a little bit firmer for today.”
The data came as many traders and investors were away, a day after the July 4 holiday and ahead of the weekend.
Moderate wage gains in June, however, added to evidence that the economy is slowing while the increase in jobs was not enough to offset weakness in May.
“You did get a massive upside surprise but again that’s coming after a month in which you had a massive downside miss,” Rai said. “If you take the two numbers together you are still averaging at a clip that’s slower than prior years’ growth.”
Average hourly earnings rose 6 cents, or 0.2%, after gaining 0.3% in May. That kept the annual increase in wages at 3.1% for a second straight month.
The dollar has weakened from a two-year high reached in May on growing expectations that the Federal Reserve is closer to cutting interest rates.
U.S. economic growth continued “at a solid pace” in the first half of the year though it likely weakened in recent months as higher tariffs depressed global trade and business investment weakened, the Fed said on Friday in its semi-annual report to Congress.
The euro also came under pressure on Friday after data showed that German industrial orders fell far more than expected in May, and the Economy Ministry warned that this sector of Europe’s largest economy was likely to remain weak in the coming months.
A relentless slide in European government bond yields has forced investors to look for higher-yielding assets elsewhere, which is holding back a sustained euro rally against the greenback.
The data that we've got perfectly match to our concern on Fed policy, that we've discussed two weeks ago. Guys, if 160K net NFP and 3.1% of wage inflation is bad data - what would you call as good data? The story repeats as market again was waiting for 0.1% inflation more than it was. This happens again and again and every time TV tells that data misses expectations and this explains that it is bad. We still think that this is absurd.
Now market prepares to IIQ GDP report in July and next Fed meeting on 31st of July. Next week seems as not very important but we will get FOMC meeting of last June session and different US inflation data. So, it also is interesting.
Finally, last week we've said, it is interesting what Fathom thinks on our suggestion that US economy is not in recession and Fed should not cut the rate by purely economical reasons. Here is what they think:
We think that investors are overestimating the probability of the Fed cutting rates this year (one 25 basis point cut now seems possible, although not three as priced in by the market) — last week’s ESI reading supports that view. Admittedly, inflationary pressures have remained somewhat subdued and we think that GDP growth is set to slow from an annualised pace of 3.1% in Q1, but we do not think that it will slow enough to warrant a rate cut, or to spur the Fed into imminent action, as many investors seem to expect.
So, Fathom takes careful position. In general, it agrees with our doubts but in longer-term perspective. Indeed, according to CME Fed watch tool, market shows 95% expectation of rate cut in July. As it stands too few time till the Fed meeting, it is difficult to take opposite opinion and state that Fed will not cut the rate. It is even more difficult, knowing that Fed tries to follow the market when it is possible. But, still I think that flat decision in July is still possible as no objective reasons stands for rate cut now.
In longer-term perspective we see clear signs of USD undervalue as market is priced-in too dovish Fed policy. Thus, NFP test has passed and I would treat it's result as supportive to our view rather than contradictive. But major tests are still ahead - GDP and Fed meeting.
Technicals
Monthly
As you understand, quiet standing brings nothing new to our technical view, especially on longer-term charts. We hope that coming IIQ GDP in July and Fed meeting will shake the market a bit.
Monthly chart creates no new range and stands inside one that was formed in the beginning of the month. So the intrigue still stands around major support where price stands right now.
Our nearest culmination point is Fed July meeting which should clarify whether we right or wrong in our hypothesis. Our plan (according to fundamental issues) tends to idea of downside breakout.
As we've said last week, changes are still look insignificant, trend stands bearish. Monthly chart is rather large and any upside action will have retracement feature, until 1.26 area breakout. The first meaningful resistance here stands around YPP of 1.1740 area, which approximately agrees with 3/8 Fib resistance.
Weekly
Our longer-term patterns here stand the same as no major breakouts have happened.
As investors hew to Fed policy, we keep scenario with potential bullish reversal pattern on weekly chart, first time we introduced few weeks ago. This is reverse H&S pattern. As road to the head's bottom was choppy as upside road to neckline also could be choppy.
The specific of H&S pattern is its dual character. It keeps door open for both scenarios. Upside scenario is based on reverse H&S while downside scenario could be confirmed by its failure, which happens around Right arm bottom.
Meantime, we've got clear Evening star pattern. As markets still have two weeks till major events, EUR could spend this time working with this pattern. It suggests downside continuation, which usually takes the shape of AB=CD pattern on daily/4H chart.
Daily
This week EUR confirms our doubts of upside continuation as market's behavior doesn't match to common bullish market action. As a result, price has dropped below all major intraday support levels, including our major K-support and Agreement around 1.1280 area. This makes difficult to treat current market as bullish.
The only bullish hope that we could find here is harmony. Price shape to the left and right shows mirror action, and recent drop repeats mirror action to the left. So, keeping this choppiness EUR theoretically could keep upside direction. But, as you understand this is not sufficient background.
Thus, next week we think we could try to play weekly candlestick pattern. Now EUR stands at major daily support, MPS1 and near daily oversold. Since market was relatively thin this week, the next one should start with upside bounce:
Intraday
We have two levels that are suitable for short entry. First one is K-support around WPP 1.1277-1.1284, and second one is 5/8 resistance around WPR1 and 1.1330 level. Right now we do not have yet any reversal patterns on 1H chart.
On Monday morning EUR could drop a bit more first, just to complete OP target and then start retracement up. It is not forbidden, as usual, taking any long trade, if you see good background, but scale of this trade is too small for periods of our updates. Thus, we mostly keep an eye on daily/4H setups and here our context is bearish. We intend to use possible upside bounce for short entry but do not trade it.
Conclusion:
Recent NFP data supports our doubts on Fed dovish policy and shows that market undervalues USD, pricing in too dovish Fed policy.
Now EUR has two weeks of "free action" till major events and we could focus on tactical setup, which is weekly bearish candlestick pattern.
The technical portion of Sive's analysis owes a great deal to Joe DiNapoli's methods, and uses a number of Joe's proprietary indicators. Please note that Sive's analysis is his own view of the market and is not endorsed by Joe DiNapoli or any related companies.