Sive Morten
Special Consultant to the FPA
- Messages
- 18,673
EUR/USD Daily Update, Tue 12, July 2011
Good morning,
I prepare update a bit earlier, since tommorow I will not have access to computer. Next update will be 13th, I hope, but could be posted with some delay, since I will travel a bit.
So, looks like we judge about direciton correct in our weekly reserach - down.
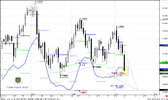
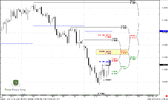
Our bias for trading is bearish. But market stands just above 1.3934 AB=CD target and at daily oversold.
This is not good idea to enter short right now. I prefer to see some pullback in such cases. Second, we do not need nearest Fib resistance to enter, since market is at oversold.
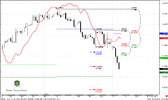
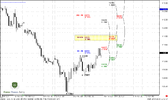
on 4-hour chart we see nice area to watch at - 1.42 4-hour Confluence resistance. Stop could be placed above 1.4328 - 0.618 resistance and weekly pivot.
Target stands the same - 1.37 area. You can see on daily time frame, that 3 different targets point at it - potential Butterfly Buy, larger AB-CD and the same recent 1.272 extension of CD leg of AB=CD.
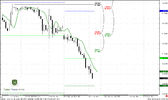
On hourly chart there is nice thrust down, so keep an eye on 1.3940 area - there could be DRPO "Buy", Butterfly "Buy" or something - any pattern, that could trigger the retracement up.
That's being said, trading plan for tomorrow as follows - our context for trading is bearish, no questions.
But market at oversold and 1.0 target, so it's better ot wait some pullback. Probably 1.42 area will be nice for that.
If you scalp trader - keep an eye on hourly time frame around 1.3940 area. You may make a short-term Buy trade, but this is risky enough since it will be against the trend and only context for it will be oversold.
Good morning,
I prepare update a bit earlier, since tommorow I will not have access to computer. Next update will be 13th, I hope, but could be posted with some delay, since I will travel a bit.
So, looks like we judge about direciton correct in our weekly reserach - down.
Our bias for trading is bearish. But market stands just above 1.3934 AB=CD target and at daily oversold.
This is not good idea to enter short right now. I prefer to see some pullback in such cases. Second, we do not need nearest Fib resistance to enter, since market is at oversold.
on 4-hour chart we see nice area to watch at - 1.42 4-hour Confluence resistance. Stop could be placed above 1.4328 - 0.618 resistance and weekly pivot.
Target stands the same - 1.37 area. You can see on daily time frame, that 3 different targets point at it - potential Butterfly Buy, larger AB-CD and the same recent 1.272 extension of CD leg of AB=CD.
On hourly chart there is nice thrust down, so keep an eye on 1.3940 area - there could be DRPO "Buy", Butterfly "Buy" or something - any pattern, that could trigger the retracement up.
That's being said, trading plan for tomorrow as follows - our context for trading is bearish, no questions.
But market at oversold and 1.0 target, so it's better ot wait some pullback. Probably 1.42 area will be nice for that.
If you scalp trader - keep an eye on hourly time frame around 1.3940 area. You may make a short-term Buy trade, but this is risky enough since it will be against the trend and only context for it will be oversold.