Sive Morten
Special Consultant to the FPA
- Messages
- 18,673
Monthly
As Reuters reports, U.S. dollar was stable against the yen and the euro on Friday as Portugal’s largest bank sought to reassure investors about its financial stability. Banco Espirito Santo said on Thursday night that loan losses to the troubled empire of its founding family would not put the bank at risk of running short of capital. That eased some concerns. The dollar weakened to nearly two-month lows against the yen on Thursday as investors worried about contagion and sought out safe haven investments. “It put concerns in the market about European growth and the bank sector,” said Mark McCormick, a macro strategist at Credit Agricole in New York. “A lot of the concerns were idiosyncratic.”
Thursday's market move was a shift for some traders, with a return to "risk on" and "risk off" sentiment taking over from monetary policy. "We have been taking our cue from the bond market, now we’re looking at equities," said Boris Schlossberg, managing director in FX strategy at BK Asset Management in New York.
The U.S. dollar has been largely range bound against the euro and the yen in recent months, struggling to gain strength as the Federal Reserve maintains a steady, relatively dovish tone and looks for further growth before indicating an interest rate hike is on the horizon.
Minutes from the U.S. central bank’s June meeting, released on Wednesday, offered no new insight into Fed policy. The next focus will be testimony by Fed Chair Janet Yellen to Congress on Tuesday.
With the Fed and the European Central Bank seen as unlikely to announce any shifts in policy in the near term, investors continue to seek out higher-yielding investments in alternative countries.
“The theme is really short the dollar, short the euro and a lot of carry, especially in emerging markets and higher-yielding G10,” said McCormick.
The Canadian dollar, meanwhile, weakened on Friday after data showed the country unexpectedly shed 9,400 jobs in June, with the unemployment rate rising to 7.1 percent from May's 7.0 percent. The loonie fell 0.78 percent against the U.S. dollar to C$1.0729.
The Australian dollar also fell after Reserve Bank of Australia Governor Glenn Stevens warned in The Australian newspaper that the Aussie currency was likely too strong, and at risk of weakness from a potential U.S. interest rate increase.
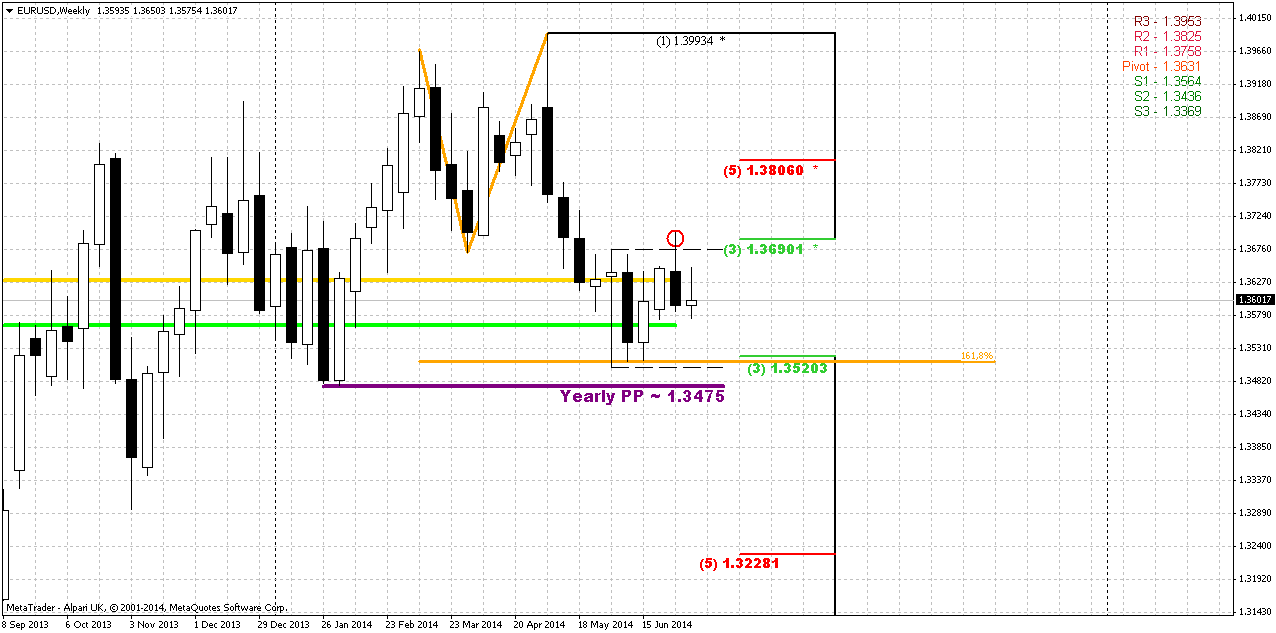
Technical
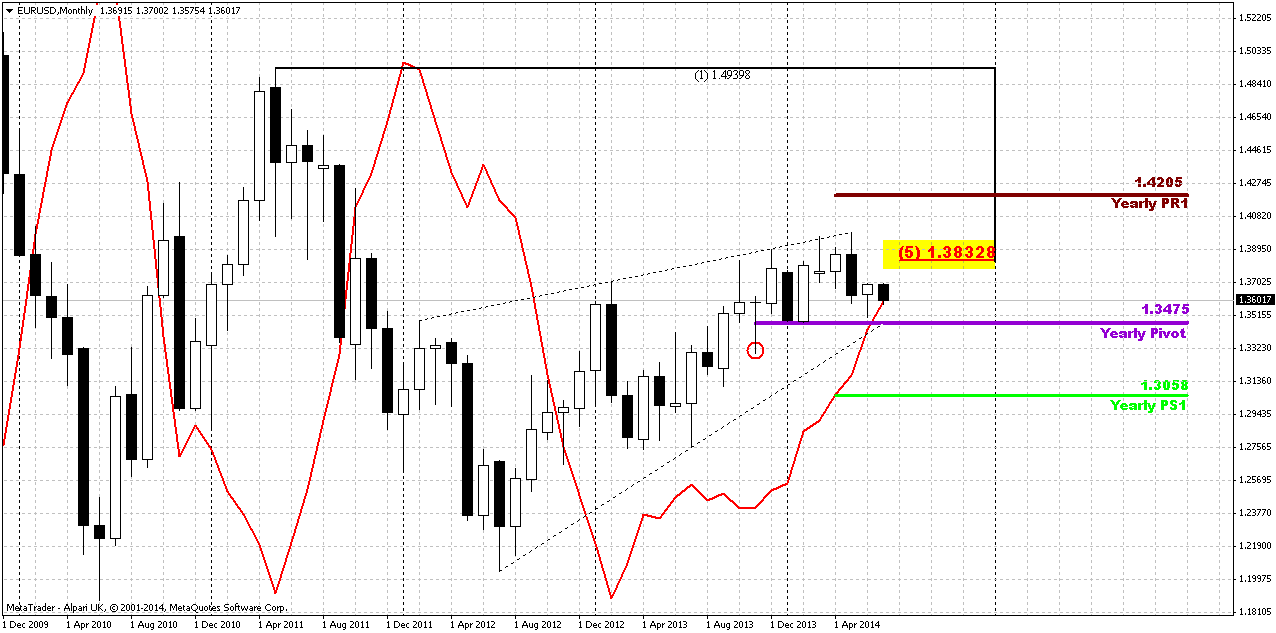
In recent time downward action has slowed significantly. As you can see within recent 2-3 weeks monthly picture hardly changes at all. Recently market has returned right back down to YPP area and flirts around it since then. EUR now stands at very significant moment. It has closely approached to Yearly Pivot point and monthly MACDP. If we will get lucky, we could get clarification in July for extended period. Thus, appearing of bullish grabber right at YPP level definitely will tell us that market should exceed 1.40 level and probably even could reach YPR1~1.42 area. Conversely, failure at YPP will be great challenge on further downward action. We didn’t get grabber on June, but right now market already has touched MACDP and now it is a question of 2 weeks, whether we will get it or not. Currently price stands above MACDP and this is a grabber, but it has not confirmed yet.
We’re speaking about both scenarios, because right now fundamental comments do not show any agreement in investors’ opinion concerning EUR. Some analysts even think that until US applies dovish policy EUR depreciation will be limited despite how dovish ECB is. Analysts suggest that Fed will keep rates low for longer period then they hint on. And as we’ve mentioned in fundamental part, investors expect that this riddle will be clarified in July. In fact, recent data on US economy was really positive and analysts talk about expectation to get prompts on earlier rate hiking in second part of 2015 instead of 2016. But in recent time Fed very often dissapoints investors and rethorical question why this couldn’t happen again? From that point of view it seems possible, especially if we recall Bernanke statements on private dinners, where he said that Fed will keep rates low longer than investors would like it. Thus, monthly grabber could be some kind of prophecy for this event. Actually we do not much care whether Fed will push USD up or down. We will be winners anyway, since we mostly need action in any direction and this probably will happen.
Technically market stands in tight range since 2014. Thus, 1.33-1.3850 is an area of “indecision”. While market stands inside of it we can talk about neither upward breakout nor downward reversal. At least, reversal identification could be done with yearly pivot – if market will move below it, this could be early sign of changing sentiment. But, as you can see, nothing among this issues have happened yet.
That’s being said, market stands around crucial area and July could clarify what will happen next. All we need on monthly chart is patience...
Weekly
Nothing drastical has happened on previous week. Trading range was small and almost inside one for previous week. We continue to look at current situation from perspective of big candle that holds following price action within 5 weeks. When market forms long candle it usually holds following price action for some time, because market needs to accustom to new range. At the same time this will increase potential energy of breakout. After flat placing market breaks with additional power. Also we said that we will point on bearish trend only if market will move below YPP and take out lows of hammer pattern. This also will mean that monthly trend shifts bearish.
Two issues that we’ve mentioned previously are still valid. They do not add encourage to the bulls, but at the same time they are not scary bearish.. First one is a failure upward breakout of hammer’s range. Usually when market tries to take out top of some long candle and fails – this leads to action in oposite direction. At least, market will reach the low of this candle, but also it could pass twice length of this bar to the downside. Second – price stands below MPP. This tells about bearish sentiment. At the same time 1.3564 is MPS1 that probably will hold market for some time and due to across-waiting of important Fed comments hardly we should count on action deeper than 1.3520 support.
Finally, MPS1 could become more significant tool than it seems now. If price will hold above it – this will be first hint on hidden bullish long-term reversal and could become a sign that Fed really could give weaker comments on possible rate policy. Other words it will be more dovish than investors would like it to be.
I saw it very often when technical patterns leading fundamental events. Even our recent update on CAD – we said on DRPO “Buy” and bounce up from support even on previous week, but unemployment data was released only yesterday and this has happened.
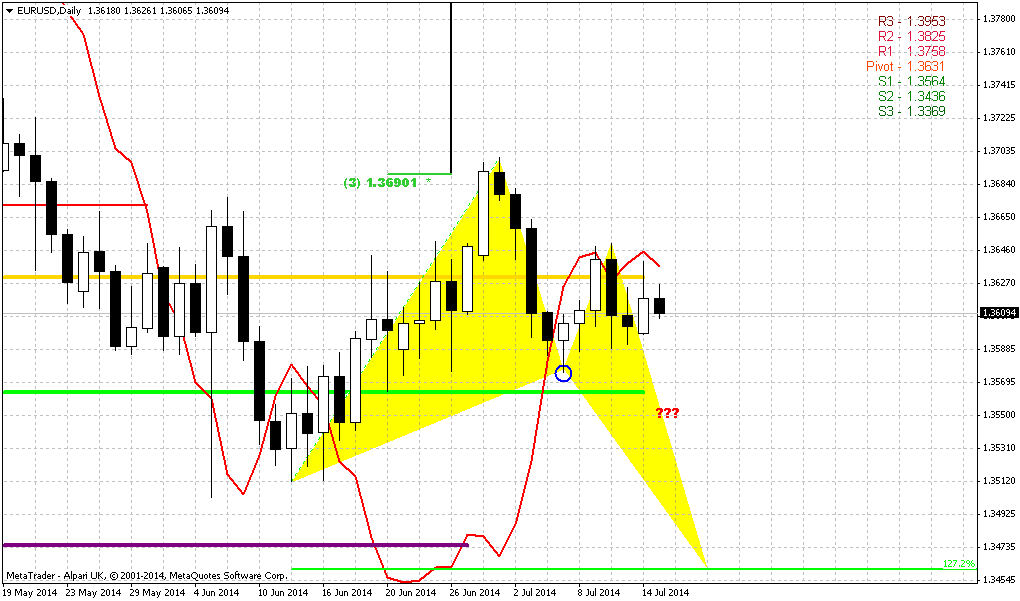
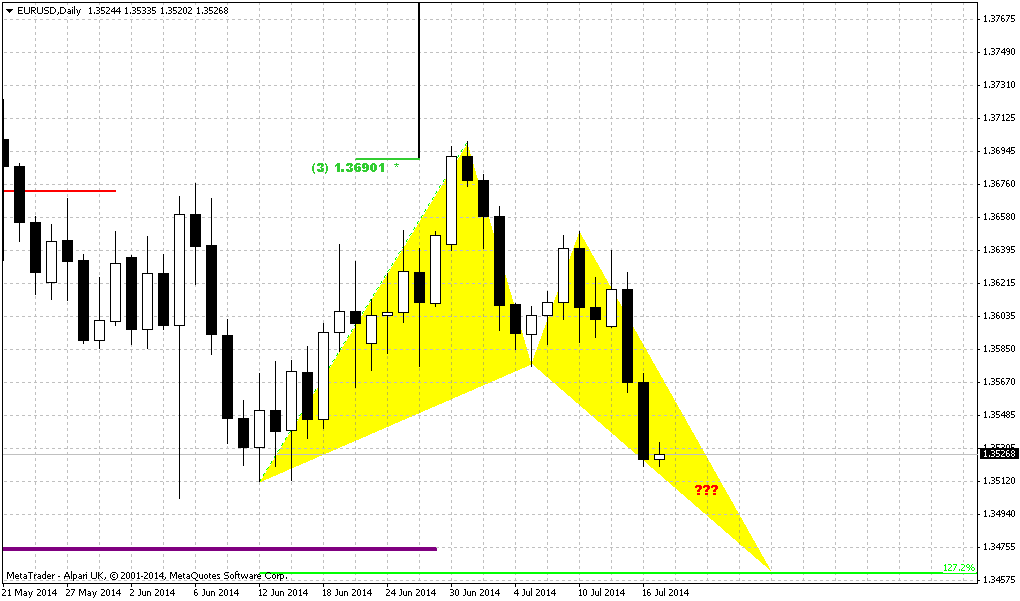
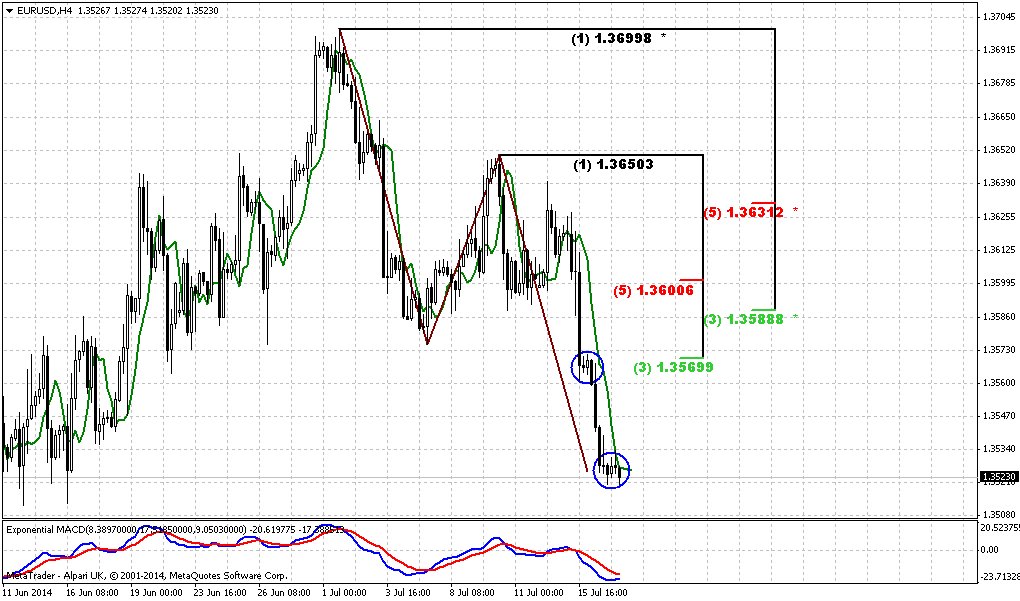
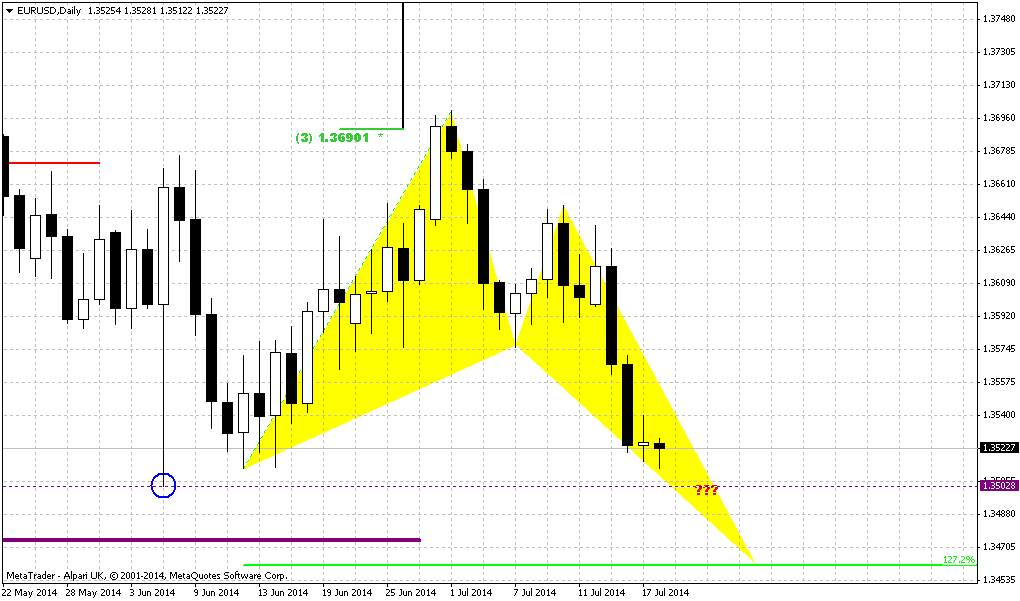
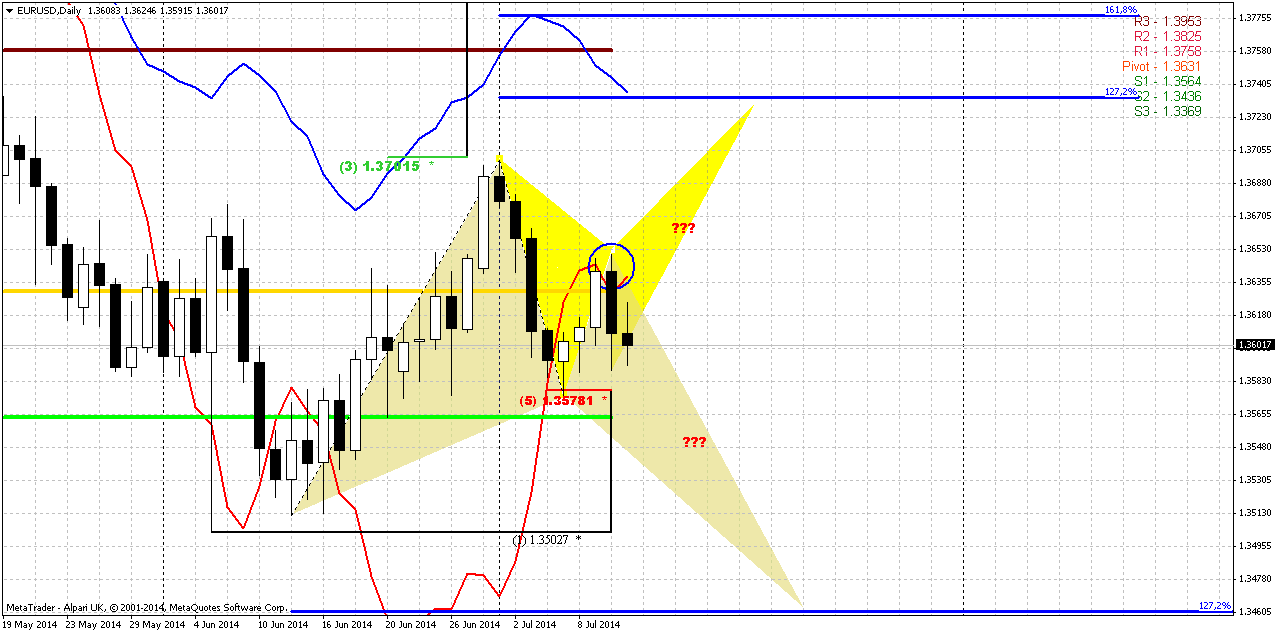
Daily
Here, on daily chart I’ve drawn many possible scenarios and picture looks frustrating at first glance. Let’s discuss it and try to come to some single trading plan. Let’s start from upward butterfly. Its invalidation point stands at 1.3575 low. If market will move below it – this butterfly will fail. At my taste, technical picture promises not many chances on upward continuation. Previously we’ve mentioned failure upward breakout on weekly chart and standing below MPP. Another thought here is based on upward AB=CD pattern with flat CD leg. AB is our long hammer candle. By recent upward action to 1.3750 price has reached 100% extension of this pattern. Its shape does not promise upward continuation. Right now market already has reached ultimate retracement level – 5/8 from whole AB=CD move. If this pattern is still valid price should hold above this level. But recent action has formed bearish stop grabber that suggests erasing of this butterfly pattern. Besides, recent action looks not very encouraging for upward continuation.
Now what about downward butterfly… In fact butterfly is an ultimate pattern and it is not necessary that market will reach its final ultimate target. We could see at least 2 other targets. First is a smallest one – just grabber target at MPS1. Second – downward AB=CD that we will discuss on 4-hour chart.
So what the sequence of our steps on daily chart? First of all we will keep an eye on 1.3575 and 1.3650 levels. Because they are mutually excluding points. Depending on which one market will take out will give us hint on further direction. Second step is searching possibility for taking position with dominating direction.
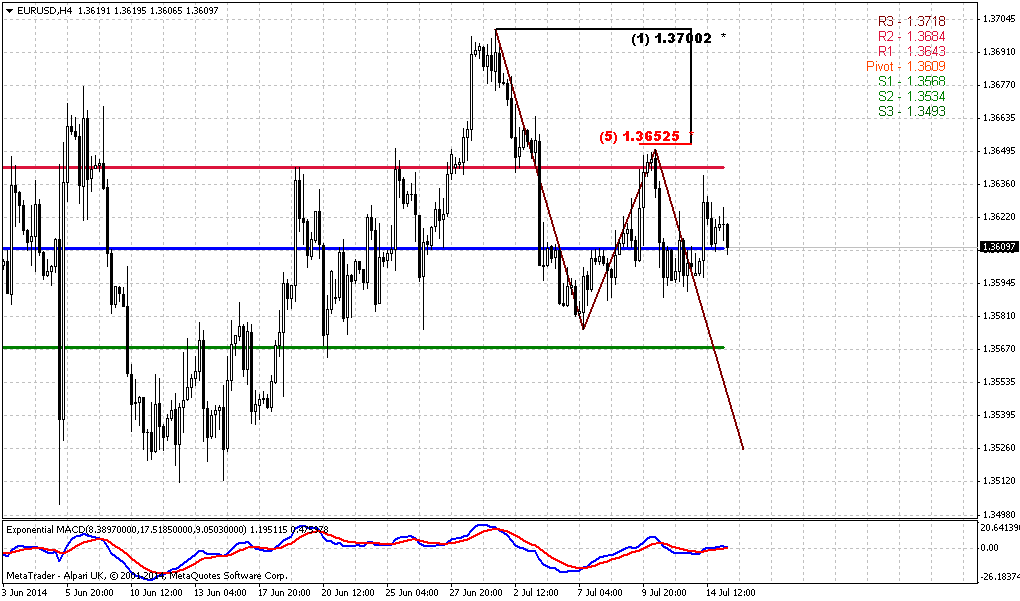
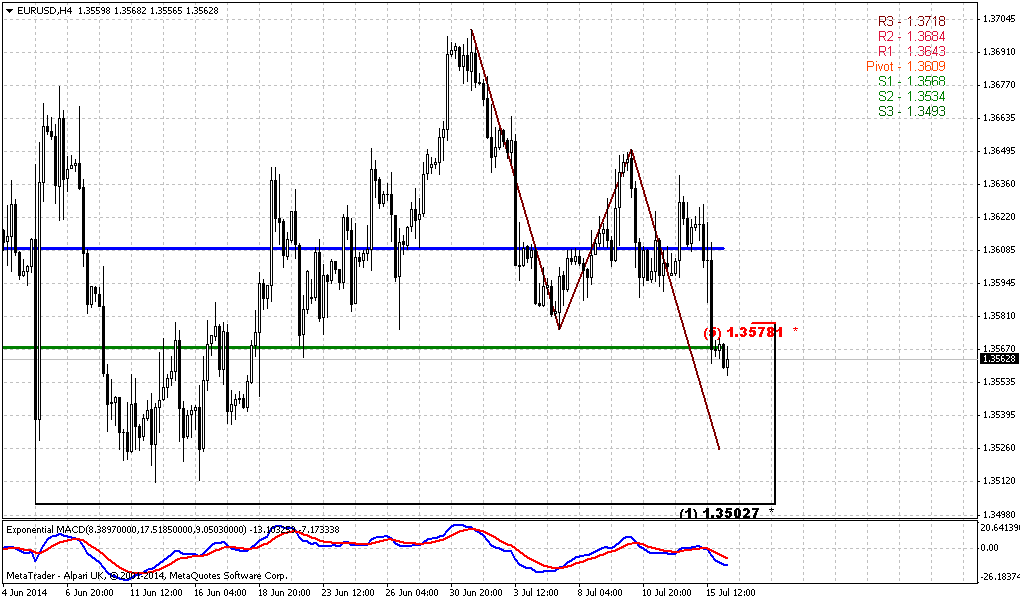
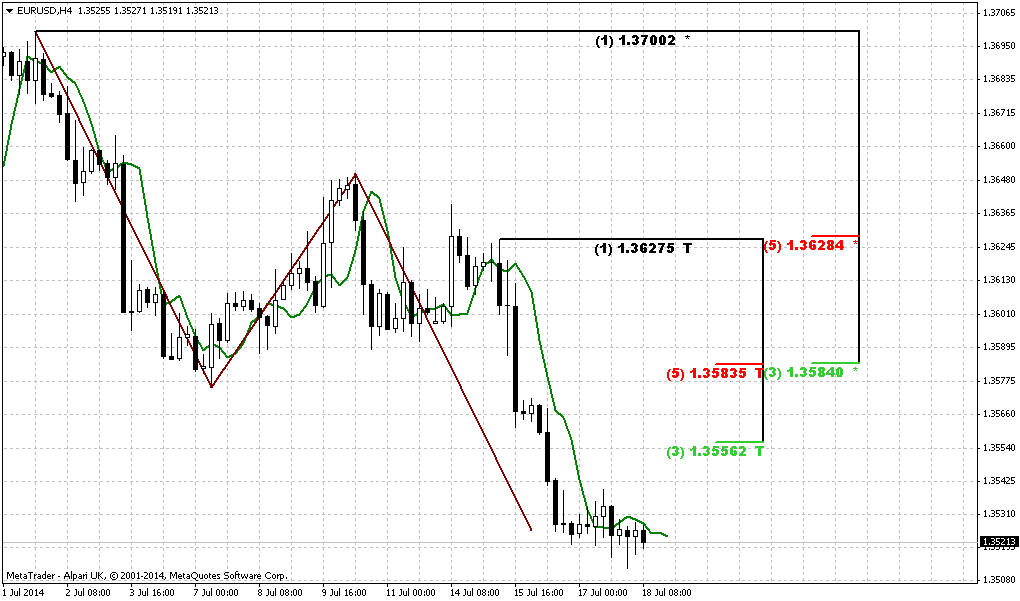
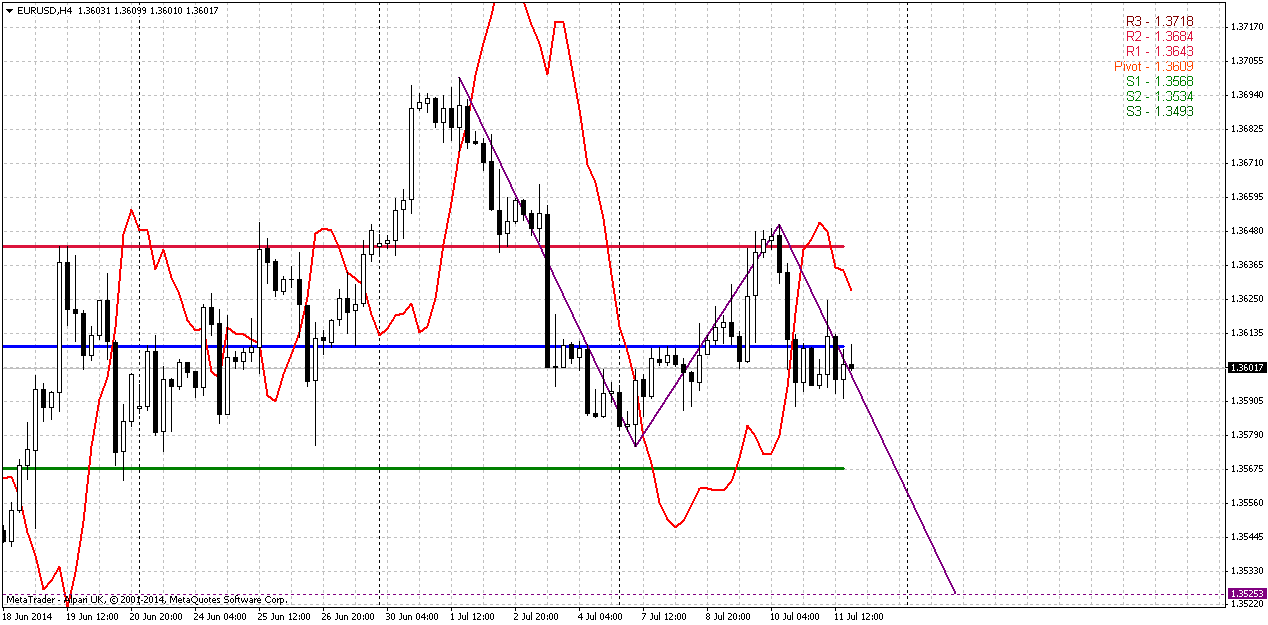
4-hour
Here trend is bearish. This chart just shows another possible pattern that has a bit closer target than daily butterfly – AB=CD right at 1.3525. On previous week EUR was not able to move above WPP and on coming week market will open right around it. If we take a look at recent action then we will see that downward action looks stronger. First is solid thrust down, attempt of EUR to accelerate with BC retracement was fastly destroyed and vanished by downaward acceleration. From fundamental point of view – we will have to keep an eye on Retail sales and PPI data that should be released on coming week.
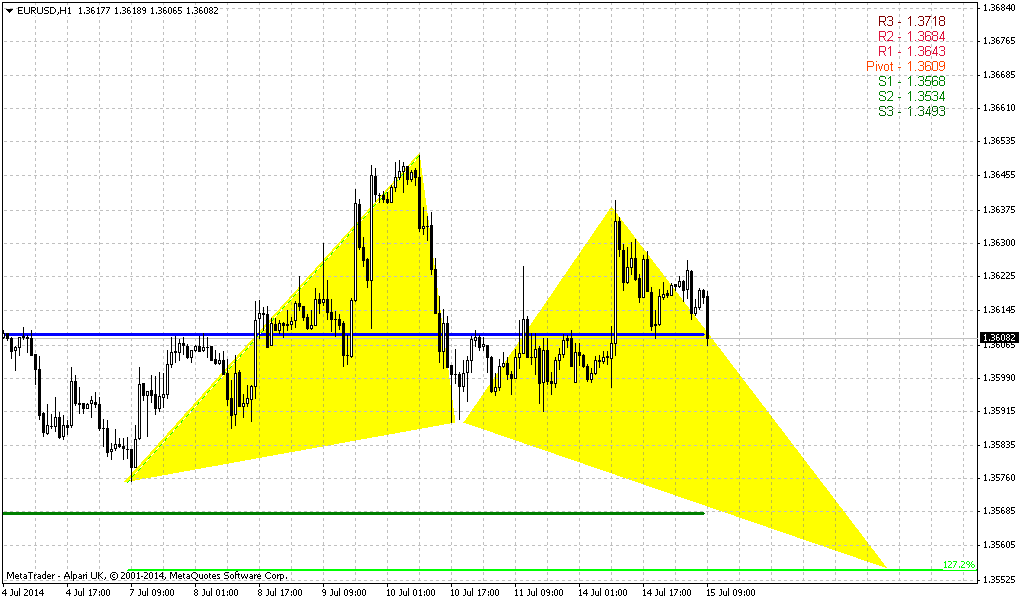
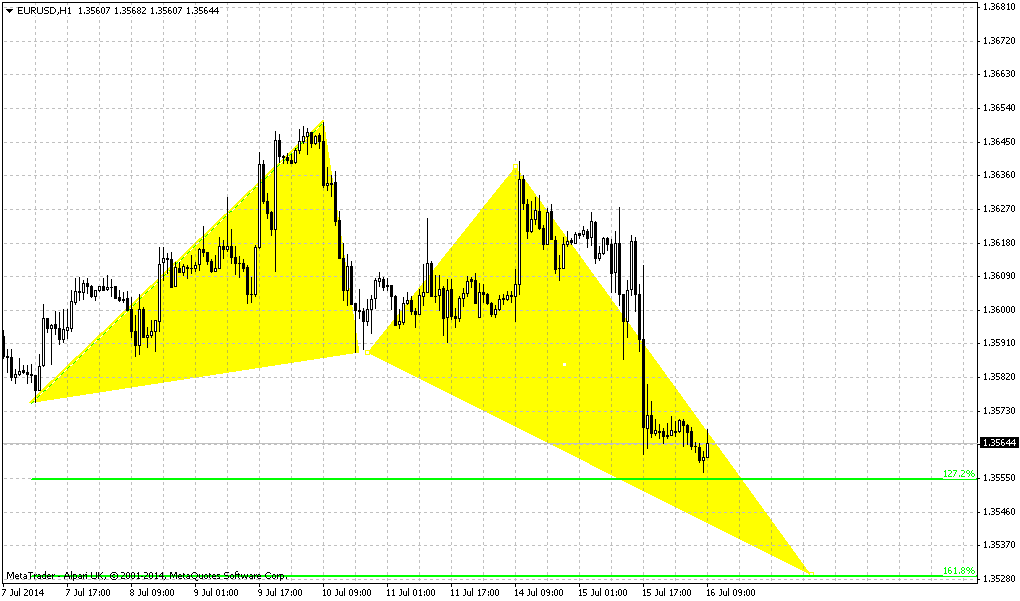
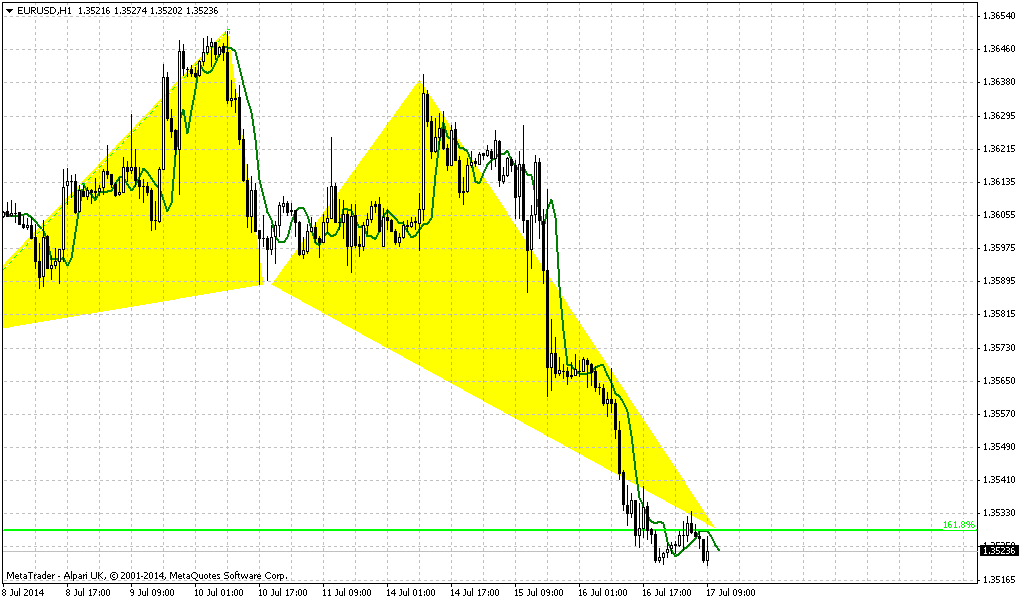
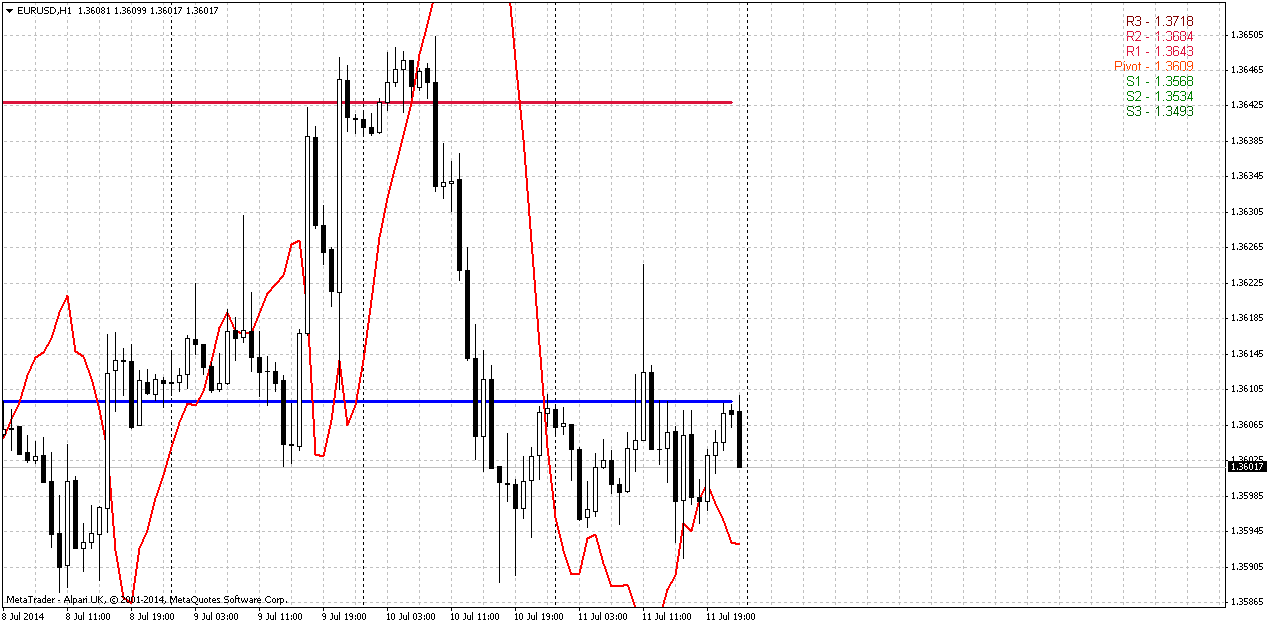
1-hour
On hourly chart we do not have any patterns, but it is interesting to look at recent consolidation, that market stands in for the whole week. Any minor upward bounce was cancelled by oposite fast downward action. Trend holds bullish, but this could be the sign of bearish dynamic pressure, since price does not show upward action here.
Conclusion:
While price stands in 1.33-1.38 area we can’t speak either on upward or downward breakout. To change really big picture market has to show breakout out of it. Still, market right now stands around crucial area – combination of YPP and monthly MACDP. Appearing of bullish grabber in July could resolve the riddle on further action or at least give us clear pattern on long-term chart.
Conversely moving below YPP will shift monthly trend bearish as well and could lead to further EUR depreciation. Currently impact of fundamental data is limited, since right now it is not data per se impacts market but how Fed treats it. Thus, investors mostly will be focused on inflation data on July and Fed reaction on it during July meeting.
In short-term perspective at least theoretically upward action is possible, but many issues tell that downward action will be dominating. At the same time we can’t clearly tell yet what particular target market will hit. First one is MPS1 it stands very close, second – AB=CD and most extended is butterfly target.
It will be mystic if situation will resolve dramatically. The point is FOMC meeting will be on 30th of July. What will happen, if inflation data will be supportive for USD, investors will start gradually take short position on EUR/USD and on last day Fed will disappoint investors. In this case we could get as achieving of our downward targets as confirmation of bullish grabber on monthly right no 30th of July. It sounds incredible, but who knows…
The technical portion of Sive's analysis owes a great deal to Joe DiNapoli's methods, and uses a number of Joe's proprietary indicators. Please note that Sive's analysis is his own view of the market and is not endorsed by Joe DiNapoli or any related companies.
As Reuters reports, U.S. dollar was stable against the yen and the euro on Friday as Portugal’s largest bank sought to reassure investors about its financial stability. Banco Espirito Santo said on Thursday night that loan losses to the troubled empire of its founding family would not put the bank at risk of running short of capital. That eased some concerns. The dollar weakened to nearly two-month lows against the yen on Thursday as investors worried about contagion and sought out safe haven investments. “It put concerns in the market about European growth and the bank sector,” said Mark McCormick, a macro strategist at Credit Agricole in New York. “A lot of the concerns were idiosyncratic.”
Thursday's market move was a shift for some traders, with a return to "risk on" and "risk off" sentiment taking over from monetary policy. "We have been taking our cue from the bond market, now we’re looking at equities," said Boris Schlossberg, managing director in FX strategy at BK Asset Management in New York.
The U.S. dollar has been largely range bound against the euro and the yen in recent months, struggling to gain strength as the Federal Reserve maintains a steady, relatively dovish tone and looks for further growth before indicating an interest rate hike is on the horizon.
Minutes from the U.S. central bank’s June meeting, released on Wednesday, offered no new insight into Fed policy. The next focus will be testimony by Fed Chair Janet Yellen to Congress on Tuesday.
With the Fed and the European Central Bank seen as unlikely to announce any shifts in policy in the near term, investors continue to seek out higher-yielding investments in alternative countries.
“The theme is really short the dollar, short the euro and a lot of carry, especially in emerging markets and higher-yielding G10,” said McCormick.
The Canadian dollar, meanwhile, weakened on Friday after data showed the country unexpectedly shed 9,400 jobs in June, with the unemployment rate rising to 7.1 percent from May's 7.0 percent. The loonie fell 0.78 percent against the U.S. dollar to C$1.0729.
The Australian dollar also fell after Reserve Bank of Australia Governor Glenn Stevens warned in The Australian newspaper that the Aussie currency was likely too strong, and at risk of weakness from a potential U.S. interest rate increase.
Technical
In recent time downward action has slowed significantly. As you can see within recent 2-3 weeks monthly picture hardly changes at all. Recently market has returned right back down to YPP area and flirts around it since then. EUR now stands at very significant moment. It has closely approached to Yearly Pivot point and monthly MACDP. If we will get lucky, we could get clarification in July for extended period. Thus, appearing of bullish grabber right at YPP level definitely will tell us that market should exceed 1.40 level and probably even could reach YPR1~1.42 area. Conversely, failure at YPP will be great challenge on further downward action. We didn’t get grabber on June, but right now market already has touched MACDP and now it is a question of 2 weeks, whether we will get it or not. Currently price stands above MACDP and this is a grabber, but it has not confirmed yet.
We’re speaking about both scenarios, because right now fundamental comments do not show any agreement in investors’ opinion concerning EUR. Some analysts even think that until US applies dovish policy EUR depreciation will be limited despite how dovish ECB is. Analysts suggest that Fed will keep rates low for longer period then they hint on. And as we’ve mentioned in fundamental part, investors expect that this riddle will be clarified in July. In fact, recent data on US economy was really positive and analysts talk about expectation to get prompts on earlier rate hiking in second part of 2015 instead of 2016. But in recent time Fed very often dissapoints investors and rethorical question why this couldn’t happen again? From that point of view it seems possible, especially if we recall Bernanke statements on private dinners, where he said that Fed will keep rates low longer than investors would like it. Thus, monthly grabber could be some kind of prophecy for this event. Actually we do not much care whether Fed will push USD up or down. We will be winners anyway, since we mostly need action in any direction and this probably will happen.
Technically market stands in tight range since 2014. Thus, 1.33-1.3850 is an area of “indecision”. While market stands inside of it we can talk about neither upward breakout nor downward reversal. At least, reversal identification could be done with yearly pivot – if market will move below it, this could be early sign of changing sentiment. But, as you can see, nothing among this issues have happened yet.
That’s being said, market stands around crucial area and July could clarify what will happen next. All we need on monthly chart is patience...
Weekly
Nothing drastical has happened on previous week. Trading range was small and almost inside one for previous week. We continue to look at current situation from perspective of big candle that holds following price action within 5 weeks. When market forms long candle it usually holds following price action for some time, because market needs to accustom to new range. At the same time this will increase potential energy of breakout. After flat placing market breaks with additional power. Also we said that we will point on bearish trend only if market will move below YPP and take out lows of hammer pattern. This also will mean that monthly trend shifts bearish.
Two issues that we’ve mentioned previously are still valid. They do not add encourage to the bulls, but at the same time they are not scary bearish.. First one is a failure upward breakout of hammer’s range. Usually when market tries to take out top of some long candle and fails – this leads to action in oposite direction. At least, market will reach the low of this candle, but also it could pass twice length of this bar to the downside. Second – price stands below MPP. This tells about bearish sentiment. At the same time 1.3564 is MPS1 that probably will hold market for some time and due to across-waiting of important Fed comments hardly we should count on action deeper than 1.3520 support.
Finally, MPS1 could become more significant tool than it seems now. If price will hold above it – this will be first hint on hidden bullish long-term reversal and could become a sign that Fed really could give weaker comments on possible rate policy. Other words it will be more dovish than investors would like it to be.
I saw it very often when technical patterns leading fundamental events. Even our recent update on CAD – we said on DRPO “Buy” and bounce up from support even on previous week, but unemployment data was released only yesterday and this has happened.
Daily
Here, on daily chart I’ve drawn many possible scenarios and picture looks frustrating at first glance. Let’s discuss it and try to come to some single trading plan. Let’s start from upward butterfly. Its invalidation point stands at 1.3575 low. If market will move below it – this butterfly will fail. At my taste, technical picture promises not many chances on upward continuation. Previously we’ve mentioned failure upward breakout on weekly chart and standing below MPP. Another thought here is based on upward AB=CD pattern with flat CD leg. AB is our long hammer candle. By recent upward action to 1.3750 price has reached 100% extension of this pattern. Its shape does not promise upward continuation. Right now market already has reached ultimate retracement level – 5/8 from whole AB=CD move. If this pattern is still valid price should hold above this level. But recent action has formed bearish stop grabber that suggests erasing of this butterfly pattern. Besides, recent action looks not very encouraging for upward continuation.
Now what about downward butterfly… In fact butterfly is an ultimate pattern and it is not necessary that market will reach its final ultimate target. We could see at least 2 other targets. First is a smallest one – just grabber target at MPS1. Second – downward AB=CD that we will discuss on 4-hour chart.
So what the sequence of our steps on daily chart? First of all we will keep an eye on 1.3575 and 1.3650 levels. Because they are mutually excluding points. Depending on which one market will take out will give us hint on further direction. Second step is searching possibility for taking position with dominating direction.
4-hour
Here trend is bearish. This chart just shows another possible pattern that has a bit closer target than daily butterfly – AB=CD right at 1.3525. On previous week EUR was not able to move above WPP and on coming week market will open right around it. If we take a look at recent action then we will see that downward action looks stronger. First is solid thrust down, attempt of EUR to accelerate with BC retracement was fastly destroyed and vanished by downaward acceleration. From fundamental point of view – we will have to keep an eye on Retail sales and PPI data that should be released on coming week.
1-hour
On hourly chart we do not have any patterns, but it is interesting to look at recent consolidation, that market stands in for the whole week. Any minor upward bounce was cancelled by oposite fast downward action. Trend holds bullish, but this could be the sign of bearish dynamic pressure, since price does not show upward action here.
Conclusion:
While price stands in 1.33-1.38 area we can’t speak either on upward or downward breakout. To change really big picture market has to show breakout out of it. Still, market right now stands around crucial area – combination of YPP and monthly MACDP. Appearing of bullish grabber in July could resolve the riddle on further action or at least give us clear pattern on long-term chart.
Conversely moving below YPP will shift monthly trend bearish as well and could lead to further EUR depreciation. Currently impact of fundamental data is limited, since right now it is not data per se impacts market but how Fed treats it. Thus, investors mostly will be focused on inflation data on July and Fed reaction on it during July meeting.
In short-term perspective at least theoretically upward action is possible, but many issues tell that downward action will be dominating. At the same time we can’t clearly tell yet what particular target market will hit. First one is MPS1 it stands very close, second – AB=CD and most extended is butterfly target.
It will be mystic if situation will resolve dramatically. The point is FOMC meeting will be on 30th of July. What will happen, if inflation data will be supportive for USD, investors will start gradually take short position on EUR/USD and on last day Fed will disappoint investors. In this case we could get as achieving of our downward targets as confirmation of bullish grabber on monthly right no 30th of July. It sounds incredible, but who knows…
The technical portion of Sive's analysis owes a great deal to Joe DiNapoli's methods, and uses a number of Joe's proprietary indicators. Please note that Sive's analysis is his own view of the market and is not endorsed by Joe DiNapoli or any related companies.