- Forex, Gold, BTC Market Analysis | Trading Signals
- Sive Morten- Currencies, Gold, Bitcoin Daily Video
You are using an out of date browser. It may not display this or other websites correctly.
You should upgrade or use an alternative browser.
You should upgrade or use an alternative browser.
FOREX PRO WEEKLY June 09-13, 2014
- Thread starter Sive Morten
- Start date
Sive Morten
Special Consultant to the FPA
- Messages
- 18,706
Hi Sive,
Could we assume that the Double Top target has been completed already, considering the modern approach to trading DTs/DBs that you describe in Forex Course:
"- Second approach – use tops and low between them as ABC pattern for Fib extension ratio, then, the approximate initial target of Double top will be 1.618 extension to the downside, the same with double bottom;"
The C is lower than A, but we still get some sort of 1.618 AB-CD look alike to the downside.
If yes, then any move to the upside should not be treated as DT failure, should it?
Thanks in advance
Hi Anton,
Experience tells that application of 1.618 AB-CD ratio instead of double distance better works on H&S pattern. If DT/DB works - it usually shows 2-times action in direction of breakout. The problem though is that DT/DB patterns rare appear and work on Forex and EUR is not an exception.
Concerning AB-CD with "C" point that higher than A. This is an old question and there was a hot discussion on DiNapoli forum. Shortly speaking, DiNapoli experts have come to conclusion that we should treat extensions of such kind of AB-CD's not as a target but as support/resistance levels. Hence, in our case, if you apply AB-CD to DT tops and C point is singificantly higher than A - you will get 1.618 support but not objective point per se. To be honest here is rather thin edge between this objects, because nobody forbids you to use this 1.618 support as the target, right?
But the major difference stands around further action. When market hits some support - the chances on upward reversal are weaker comparing to reaching of 1.618 extension target. Second, 1.618 support levels can't create an Agreement with Fib levels. But this is mostly advanced issues and nuances.
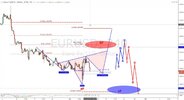
So, what I would like to say... My opinion is upward return above DRPO target and holding there probably will be treated as DT failure and lead market to the tops again, and even to 2-times upward action ultimately.
Hello 2 all!
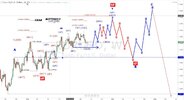
Tried to find pattern which would lead to new HH from current low, or very close to it, but could not find it, yet, except if we will get more than a month of sideways...I have 2 possible patterns, both due North after possible short short...I read this leg down as DZZ and I would appeciate if 1,3476 low would be taken first..COT has turned bearish, strongly...
Have a nice rest of Sunday and good trading in coming week!
Hi Minimax,
I've got medium-term picture, you expect downward development in nearest future. BTW, interesting that your destination point stands very close to Yearly Pivot Support 1.
And do you have shorter perspective pics? I mean daily. I would watch on it. It is always interesting how DiNapoli and classical patterns involve in EW forecasts.
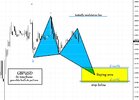
This looks like a nice 3 drive sell setting up on USD/JPY H4 chart. Each retrace was to 50% and then extended to 100%. This would give a target/entry point around 103.40
Hi Michael,
Hm... In general this does not stand against hour big butterfly expectation. May be, we just need to control ratios between drives. If pattern will hold it, may we indeed will get 3-Drive that trigger some intraday retracement.
Hi Sive
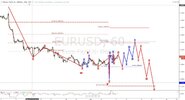
Here is my shorter term picture made yesterday. As seen I expect H&S to downside first then inverted one which might or not comes out,projected target 50% (or more) of whole leg to fulfill Flat conditions but could be less or more if Ending diagonal is in play. Would not be surprised with very fast moves up & down and with only W&R of current low, if 50 pips is W&R on H1/H4, but on weekly I expect no seen swings.
When I draw 5 waves structure is not neccessary 5 waves seen, that is an impulse and as such could be done in a single candle.

Lolly Tripathy
Sergeant Major
- Messages
- 515
Thank you sive sir..our plan is going very well.. 
Thanks minimax for ur great work..
wish you all many green pips
Thanks minimax for ur great work..
wish you all many green pips
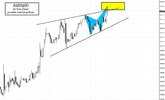
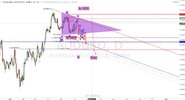
aussie hit 78.6 and I expect move down into 3ED or shorter E of triangle..minimum retrace for E is 23% but I expect much lower, currently looks like 0,922
This makes me thinking euro could proceed lower but looking across the board also could mean that euro could become biggest gainer for next few weeks..
Take care and good trading!
This makes me thinking euro could proceed lower but looking across the board also could mean that euro could become biggest gainer for next few weeks..
Take care and good trading!

Lolly Tripathy
Sergeant Major
- Messages
- 515
Lolly Tripathy
Sergeant Major
- Messages
- 515
Audusd
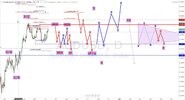
made new clearer picture, so as drawn
- my favourite count is that we are still in correction, Flat exactly, with waves a & b & 1ED in place; shape of current move (2ED) could become more complicated at 0,93283 peak and develop as Triple ZZ with one more push up; 0,9408 should remain in tact; waves 3/4/5 should unfold as Diverging ED; 0,90801 should remain in tact
- price breaks 0,94081; this count is wxy where w&x are in place and we are in bFlat to the up side; how high can not say but potentialy all over to 0,954 zone where also Butterfly D zone is; depth of retrace is unpedictable atm but at least below 0,94081
- price breaks 0,94081, wave 4 is already in place at 0,92013; move up will unfold as motive wave, currently can not predict the shape but expect Converging ED
- we have Truncated 5th (???), do not think so...
- price action will form Contracting triangle where waves ABCD is done and we are in E; also nice one; atm we should drop down to 0,922 zone..
I think these are all options..
Good trading!

Similar threads
- Replies
- 5
- Views
- 186
- Replies
- 7
- Views
- 210
- Replies
- 5
- Views
- 214
- Replies
- 14
- Views
- 300
- Replies
- 4
- Views
- 912
- Forex, Gold, BTC Market Analysis | Trading Signals
- Sive Morten- Currencies, Gold, Bitcoin Daily Video
