- Forex, Gold, BTC Market Analysis | Trading Signals
- Sive Morten- Currencies, Gold, Bitcoin Daily Video
You are using an out of date browser. It may not display this or other websites correctly.
You should upgrade or use an alternative browser.
You should upgrade or use an alternative browser.
FOREX PRO Weekly March 19 - 23, 2012
- Thread starter Sive Morten
- Start date
Triantus Shango
Sergeant Major
- Messages
- 1,371
alf, do you live under a rock? 
here you go, man: https://www.forexpeacearmy.com/fore...9309-forex-pro-weekly-march-19-23-2012-a.html
here you go, man: https://www.forexpeacearmy.com/fore...9309-forex-pro-weekly-march-19-23-2012-a.html
Hi papao
Thanks for your reply. Maybe I could not find them because I am not familiar with those updates - as you mentioned: daily - 4-hour - 1-hour sections.
Please let me know the link for them.
Thanks and have a nice time.
ALF
cable
Hello Sive!
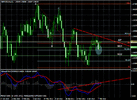
If you have a spare moment please take a look at GBP. I think on Weekly is something very interesting. From one side, we have Bearish hidden divergence. From the other side, price returns above MS1 and W&R of the lows.
Do you consider Bearish bias on Weekly TF? Is it worth tracking H&S on Daily?
I am sure you will see something I dont see.
Thank you!
Attachments
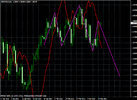
Looks like we have reach 50% retracement from 1.3485. The next target would be the confluence area around 1.32096-1.33014. I would probably wait for it to retest 1.3290 which is also the 61.8% retracement target and enter a short position from there. Or maybe...

Possible?
Just my 2 cents worth, anyone have a different idea? Do feel free to share

Possible?
Just my 2 cents worth, anyone have a different idea? Do feel free to share
Last edited:
Hi Sive,
Thanks a million for weekly and daily analysis. I notice myself that after reading your articles and watching videos for long time, I have now started drawing the fib correctly and pretty much the same as yours.. I will now know what levels to wathch during the week. I am still confused when I see the different trend on the different time frames but your weekly and daily analysis helps me a lot to learn. I really appreciate your great work. Thank you very much.
Chublet I had a similar problem for quite some time. When trends on the Weekly and Daily match up it becomes a great trade but when they differ you can lose money easily. To correct it for myself I chose to trade the daily chart, using the MACD change as the indicator. I take profits often and try to enter on retracements everyday or two whenever I feel it should happen. Pay attention to weekly as if the trends are different the daily could be retracing to a take profit target on the weekly. One way around it is trailing stops though they don't work for me.
Triantus Shango
Sergeant Major
- Messages
- 1,371
cheater, i don't see any K-area around 3290+. there's the 61.8%... but where is the 38.2%? from what extreme to what extreme?
WEEKLY:
1- 38.2% of [4248 - 2625] = 3241;
2- trendline @ 3328;
DAILY:
3- 25x5 DMA is currently capping price;
4- potential BnB (current candle is 3rd candle after breach of 3x3 DMA);
5- WP R2 = 3311 where the previously broken daily trendline comes in, so potential retest of this trendline <--> (2);
6- WP R1 = 3243 <--> (1);
7- main concern for bulls: DPO (Detrended Price Oscillator) is flat and edging ever so slightly downwards from right under 0.0 level; failure to break above 0.0 line would be a sign of continued downward pressure;
H4:
8- MPP = 3261 and DP R1 = 3288;
9- 100 MA about to cross under 200 MA;
10- price at 50% (3243) of move down from 3485 <--> (6);
11- Stoch = OB;
12- DPO = OB;
13- MACD: as price made new highs, MACD histogram is making consecutive new lows;
H1:
14- price breached but pulled back to FE 161.8 of AB=CD (mentioned by sive);
15- recent bearish cross on MACD;
16- DPO unwound from OB and about to cross 0.0 line <--> (7) and if cross occurs this will coincide with a failure of DPO to cross up the 0.0 line on daily, confirming beginning of the resumption of the bear trend on daily;
17- 100 MA < 200 MA;
based on all this, i would concur with you.
Looks like we have reach 50% retracement from 1.3485. The next target would be the confluence area around 1.32096-1.33014. I would probably wait for it to retest 1.3290 which is also the 61.8% retracement target and enter a short position from there. Or maybe...
View attachment 5091
Possible?
Just my 2 cents worth, anyone have a different idea? Do feel free to share
Last edited:
Triantus Shango
Sergeant Major
- Messages
- 1,371
guys
i'd like to draw your attention to an interesting example of how sometimes TIs (technical indicators) mean jack. if you look at e/j H4, you will see multiple candle patterns and TIs in OB, coming out of OB and returning into OB, and out again, showing plenty of signs of trend exhaustion and yet, the pair just kept on climbing since 105.80!
had you used any of the TIs as a signal to go short you would be royally screwed now.
food for thought.
cheater, i don't see any K-area around 3290+. there's the 61.8%... but where is the 38.2%? from what extreme to what extreme?
WEEKLY:
1- 38.2% of [4248 - 2625] = 3241;
2- trendline @ 3328;
DAILY:
3- 25x5 DMA is currently capping price;
4- potential BnB (current candle is 3rd candle after breach of 3x3 DMA);
5- WP R2 = 3311 where the previously broken daily trendline comes in, so potential retest of this trendline <--> (2);
6- WP R1 = 3243 <--> (1);
7- main concern for bulls: DPO (Detrended Price Oscillator) is flat and edging ever so slightly downwards from right under 0.0 level; failure to break above 0.0 line would be a sign of continued downward pressure;
H4:
8- MPP = 3261 and DP R1 = 3288;
9- 100 MA about to cross under 200 MA;
10- price at 50% (3243) of move down from 3485 <--> (6);
11- Stoch = OB;
12- DPO = OB;
13- MACD: as price made new highs, MACD histogram is making consecutive new lows;
H1:
14- price breached but pulled back to FE 161.8 of AB=CD (mentioned by sive);
15- recent bearish cross on MACD;
16- DPO unwound from OB and about to cross 0.0 line <--> (7) and if cross occurs this will coincide with a failure of DPO to cross up the 0.0 line on daily, confirming beginning of the resumption of the bear trend on daily;
17- 100 MA < 200 MA;
based on all this, i would concur with you.
hmm just double checked, you are right, i misread the 100% retracement at 32902 as 38.2% instead. Drawing too many fib lines like that is gonna cost me $. Thanks for the correction mate
guys
i'd like to draw your attention to an interesting example of how sometimes TIs (technical indicators) mean jack. if you look at e/j H4, you will see multiple candle patterns and TIs in OB, coming out of OB and returning into OB, and out again, showing plenty of signs of trend exhaustion and yet, the pair just kept on climbing since 105.80!
had you used any of the TIs as a signal to go short you would be royally screwed now.
food for thought.
been there, done that, and burnt me pocket a big hole just on last Friday...swear to steer clear of E/J pair forever LOL
Triantus Shango
Sergeant Major
- Messages
- 1,371
sive, when you write 'major 0.618 support' do you mean 31037?
Similar threads
- Replies
- 0
- Views
- 43
- Replies
- 1
- Views
- 65
- Replies
- 0
- Views
- 45
- Replies
- 8
- Views
- 208
- Replies
- 17
- Views
- 304
- Forex, Gold, BTC Market Analysis | Trading Signals
- Sive Morten- Currencies, Gold, Bitcoin Daily Video

