Sive Morten
Special Consultant to the FPA
- Messages
- 18,673
Monthly
The euro extended its sharp decline from a 2-1/2-year high against the dollar on Friday, a day after European Central Bank chief Mario Draghi did his best to sap the currency's strength by threatening more monetary stimulus. The U.S. dollar, meanwhile, traded at a one-week high against a basket of its major trading partners' currencies, pulling it off a 20-month low reached on Thursday. Following the ECB's policy meeting on Thursday, Draghi warned that the euro's strength was "a serious concern" and that the ECB was "comfortable" with taking more action to support economic growth and raise inflation at its June meeting. "The euro continued to fall overnight from Draghi's comments, but that move is starting to run out of legs," said John Doyle, currency strategist at Tempus Inc in Washington, D.C. "He has a number of times attempted to talk down the euro, and yet they haven't done much. The testing of $1.40 on the euro was right, but until the ECB actually acts, I don't see a sustained rally in the dollar. The market has been calling Draghi's bluff," Doyle said. "For me it is not a game changer. As long as quantitative easing continues in the U.S., we expect the dollar to remain under pressure," said Lutz Karpowitz, a currency strategist with Commerzbank in Frankfurt. "I would expect the euro to trade higher against the dollar next week."
JOBS DATA CLOBBERS CANADIAN DOLLAR
Weaker-than-expected April employment data in Canada sent a wave of selling through the loonie. A loss of 28,900 jobs defied forecasts for a gain of 12,000, suggesting the labor market has stalled. After hitting a four-month high on Thursday, the loonie has dropped 0.62 percent to C$1.0900, or 91.74 U.S. cents.
Trading ranges narrowed in the last hours of the week ahead of the May 11 federalization supporters’ referendum in Ukraine. Federalization supporters voted unanimously on Thursday in favor of holding a referendum on independence, ignoring calls by Russian President Vladimir Putin to postpone the vote to open the way for talks with Kiev authorities.
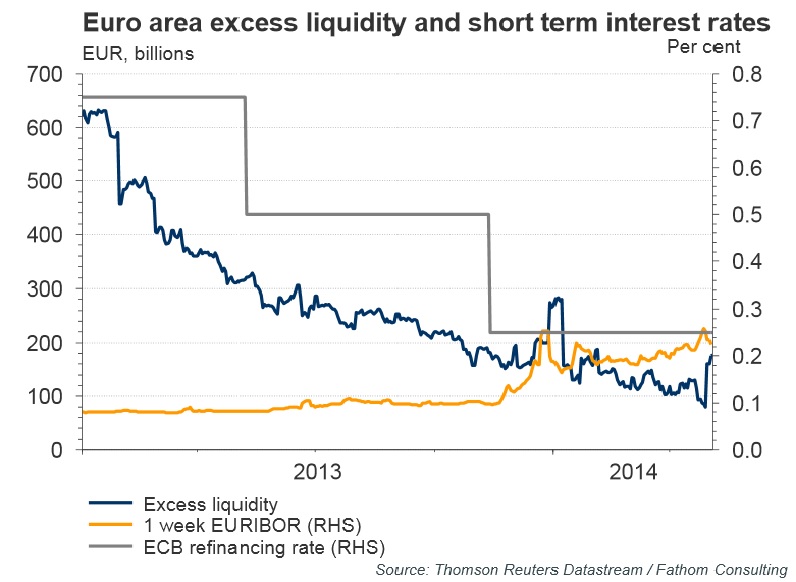
And a bit more on EUR… With EONIA on the rise, and with one-week EURIBOR rates moving above the ref. rate for only the second time, market analysts expect that the ECB will soon end the sterilization of its SMP purchases.
Short-term market interest rates have been increasing for a few months now against a backdrop of unchanged policy. This is primarily a consequence of the fact that excess liquidity has fallen to as low as €80 billion –Mr Draghi said last year that something around €200 billion was the expected level – as banks have made efforts to repay their LTROs early, and are hoarding liquidity ahead of the stress tests results and AQR. Unless the ECB acts quickly, the risk is that the pick-up in market rates will accelerate, further impairing the balance sheets of euro area banks. The ECB has long warned against the consequences of an unintended policy tightening – and that is precisely what we are seeing now. If the ECB waits much longer, interbank borrowing will become more difficult, and more expensive. In the same vein, Christian Noyer, governor of the Banque de France, said that he is ‘personally in favor of stopping the absorption of liquidity’.
As you can see, we have a bit different judgement on current situation. Many respectable analysts do not believe in long-term USD appreciation and suspect that EUR should return right back up. At the same time, as ECB will contract sterilization of excess liquidity and threatens markets with dovish policy, it is difficult to say definitely what will happen on fundamental area of events.
Technical
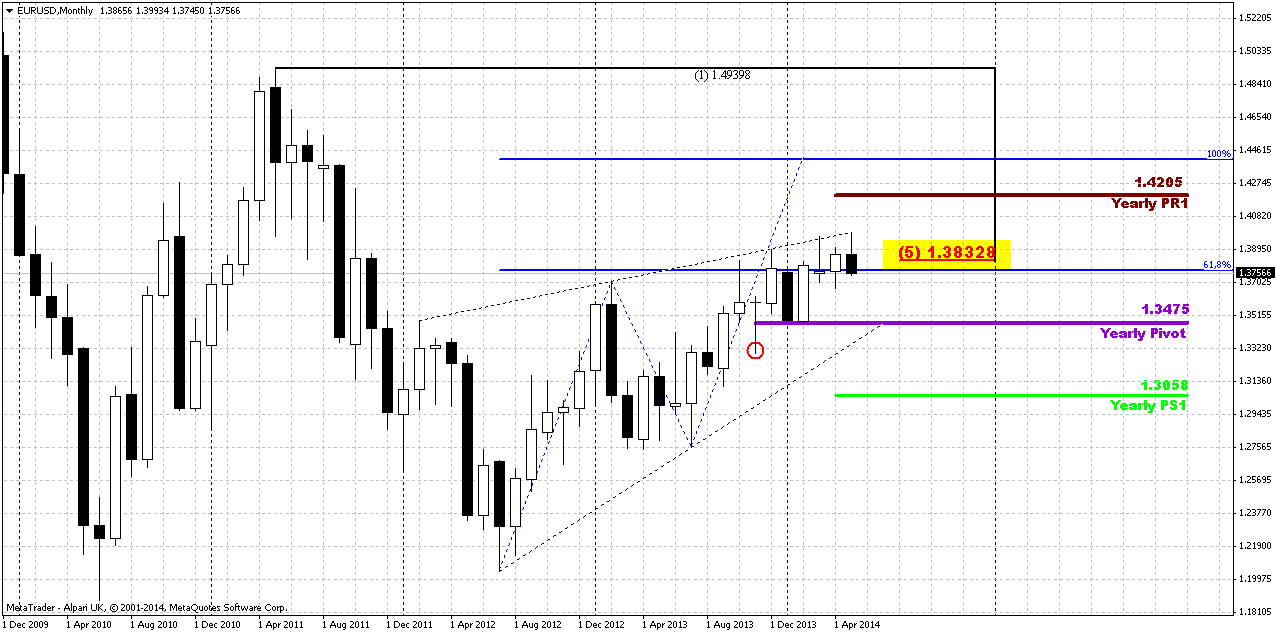
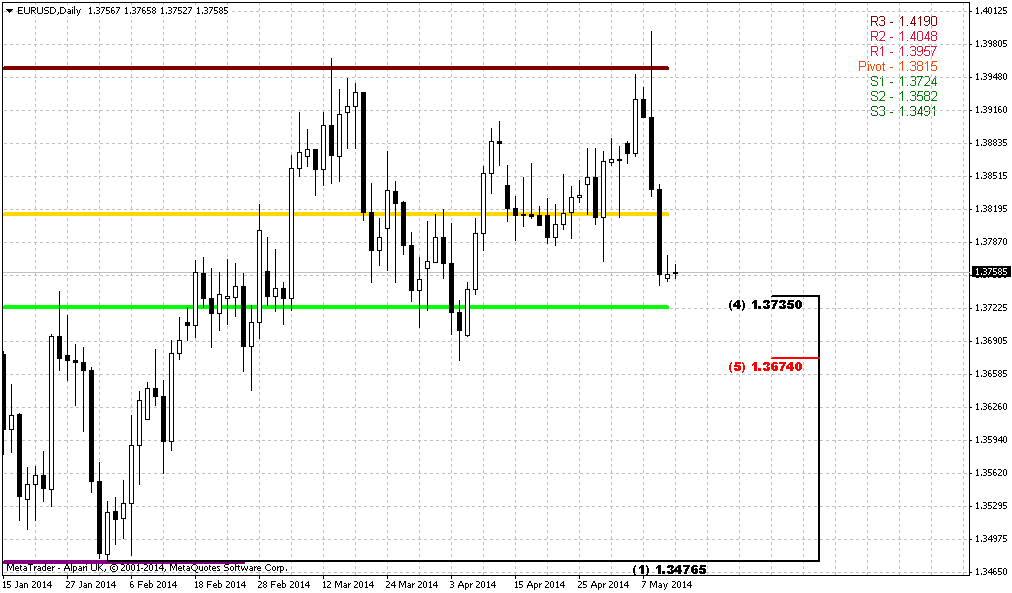
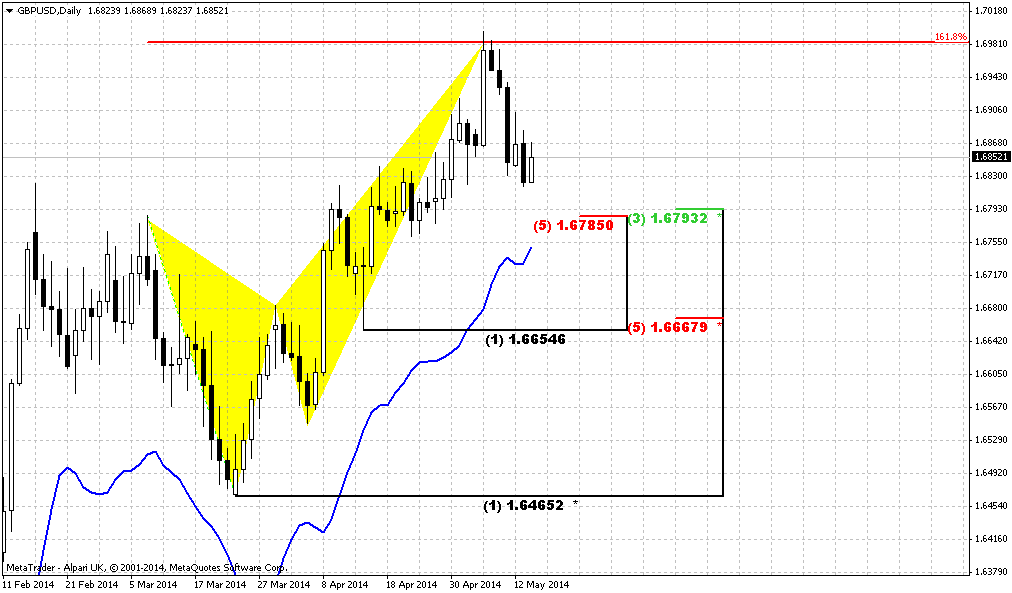
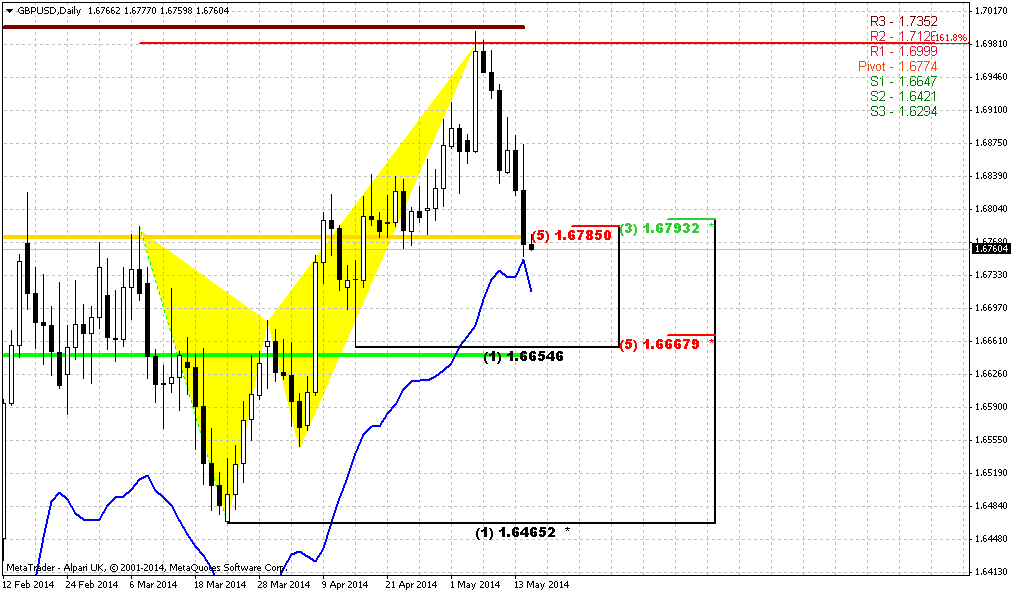
Although April was upward month, but overall action mostly should be classified as “inside” one to March range. Almost whole April price has spent in the same range. At the same time May action is starting to show its power. Although this has happened not quite independently but having ECB hand in EUR dynamic, still, technically we see attempt of reversal on monthly chart. We saw something cognate on February action, but it didn’t lead to any downward continuation. At the same time, currently situation is slightly different because there was no solid upward action in April, and now we have a month candle that has moved above April high. If May will close below April low – we will get monthly reversal bar and this could lead at least to some downward continuation. Part of this work has been done already.
By looking at bigger picture, market stands in tight range since 2014. Thus, 1.33-1.3850 is an area of “indecision”. While market stands inside of it we can talk about neither upward breakout nor downward reversal. At least, reversal identification could be done with yearly pivot – if market will move below it, this could be early sign of changing sentiment. But, as you can see, nothing among this issues have happened yet.
Speaking about upward continuation, market mechanics does not allow price to show any deep retracement any more. Any move of this kind should be treated as market weakness and it will increase probability of reversal down. Take a look that as market has hit minor 0.618 AB-CD extension target right at former rock hard resistance – Fib level and Agreement and former yearly PR1, it has shown reasonable bounce down to 1.33. As retracement after 0.618 target already has happened, it is unlogical and unreasonable to see another deep bounce and if it will happen - it will look suspicious.
So, speaking about monthly upside targets... If we will get finally real break through resistance, we have two major targets – AB=CD one around 1.44 and Yearly PR1 = 1.4205.
That’s being said, we do not see any significant changes on monthly – price still stands in the range of 1.3350-1.3850 area. As recent upward breakout has failed – in short term perspective we could get bounce down, but based on monthly chart it is impossible to say how deep it could be.
Weekly
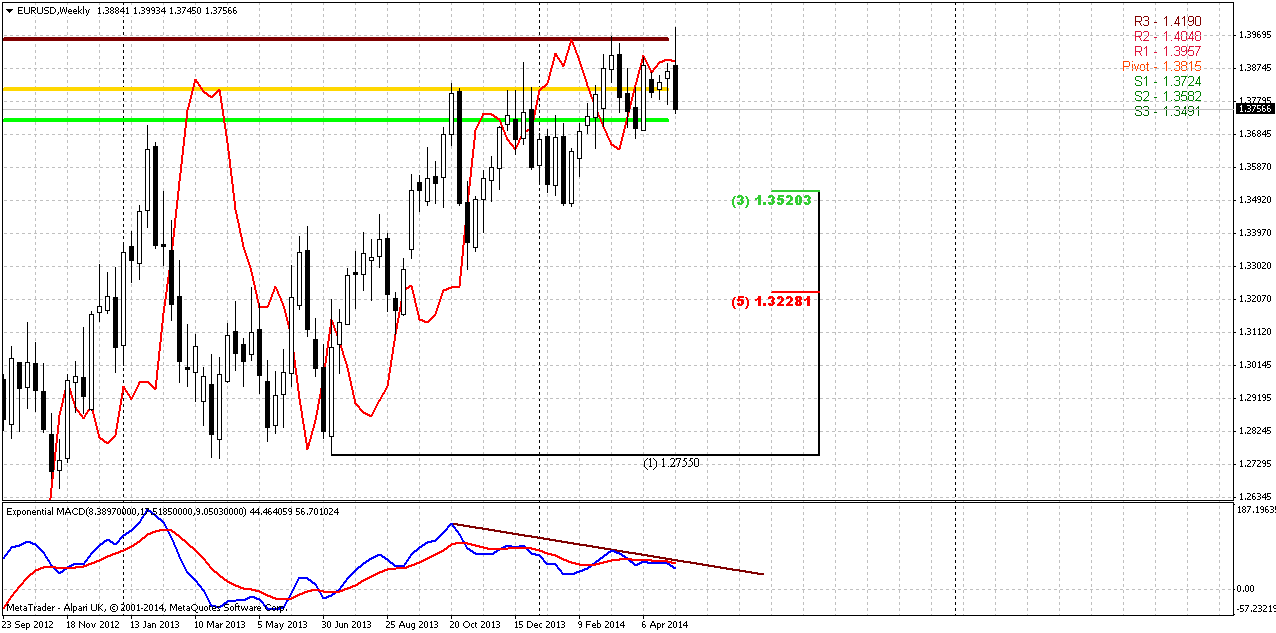
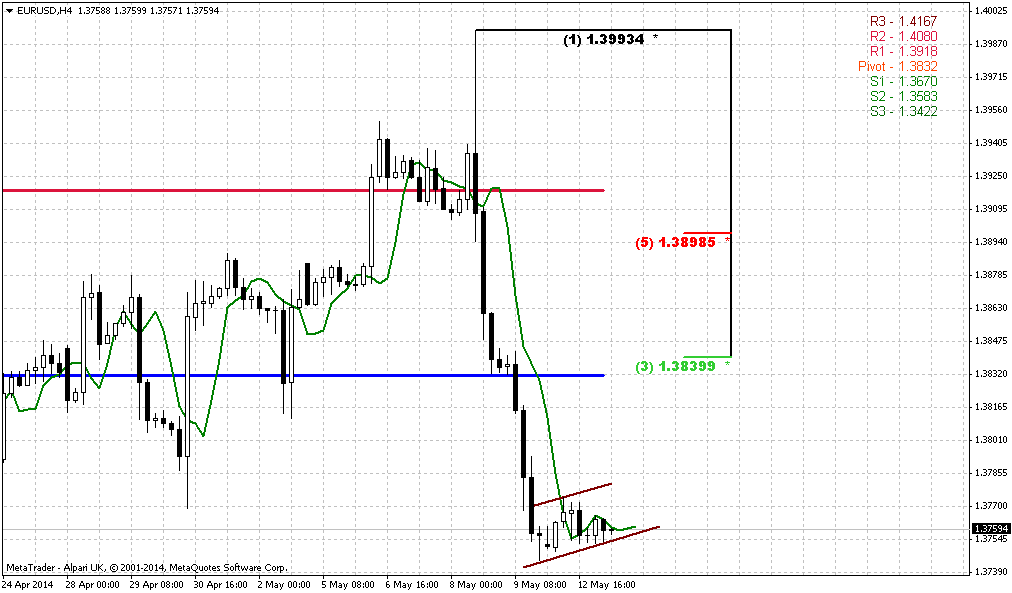
On weekly chart we have full pack of bearish signs. It’s a bit uncomfortable that they are too obvious, but they are facts that we can’t ingore still. Besides, fundamentally EUR/USD pair also has reasons to move lower. Although said Lutz Karpowitz, a currency strategist with Commerzbank in Frankfurt said: “As long as quantitative easing continues in the U.S., we expect the dollar to remain under pressure”, - but currently it’s not quite the same QE. It was contracted twice and dollar supply has decreased. At the same time ECB stands near stopping of its liquidity sterilization action and this should increase the supply of EUR, or, at least it should stop contracting it. These opposite measures play in favor of EUR/USD downward action probably.
By looking at technical issues, we have a lot of bearish signs: butterfly “sell” at MPR1, accompanied by bearish wedge and divergence with MACD. Market has moved below MPP and has formed bearish stop grabber pattern that suggests taking out of 1.3670 lows. At the same time grabber bar is a reversal week – market has created new high and close below bottom of previous week. And, finally, this week was W&R of previous highs. I will not dare to speak about long-term reversal, but at least minor continuation should follow. Nearest support stands around 1.35-1.3520 area and includes two major points – Fib support and YPP at 1.3475.
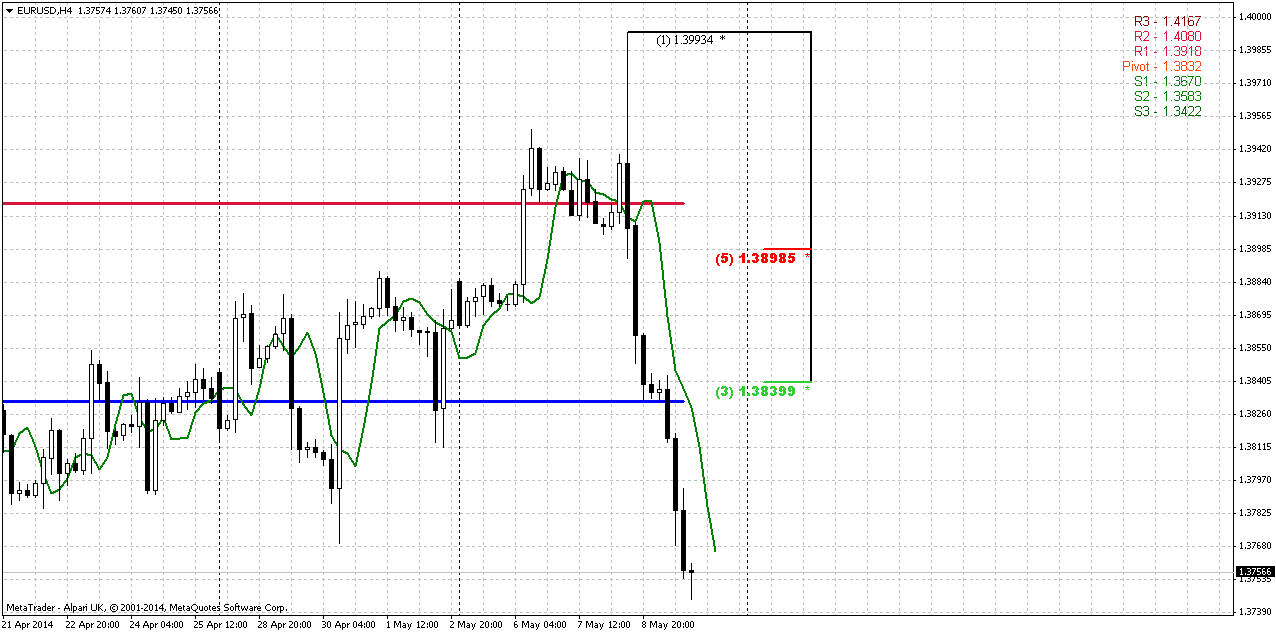
Daily
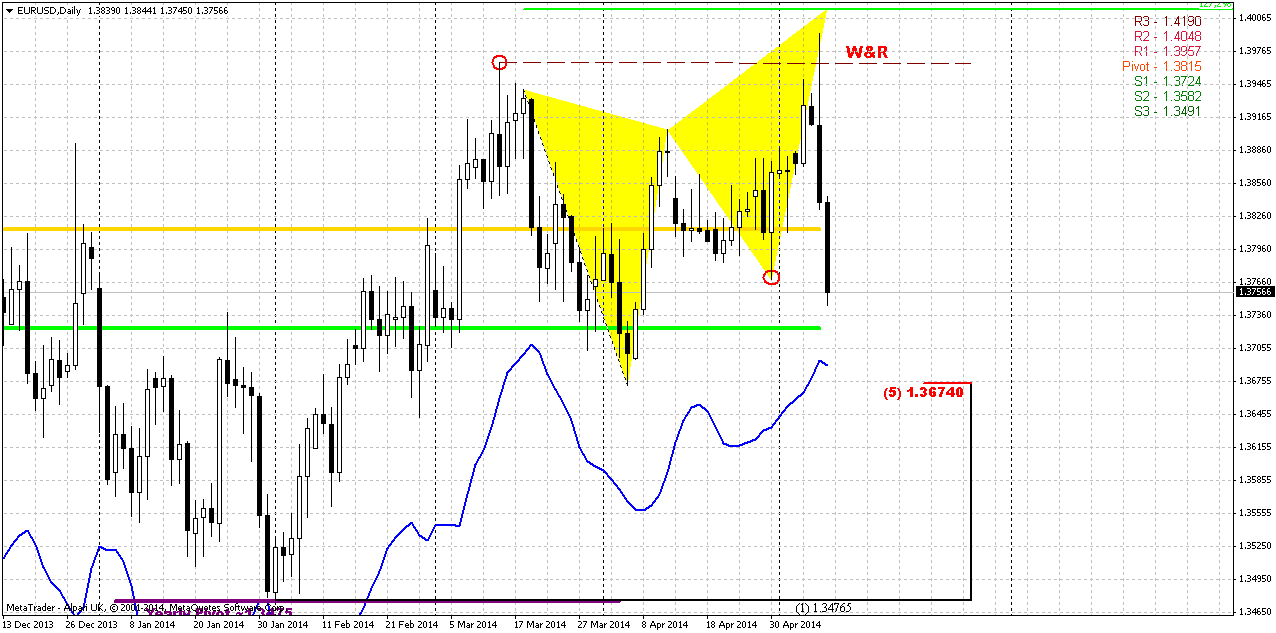
Well, guys, I do not want to treat our upward analysis on previous week as poor, because market mostly completes the target and has not reached it just for 15-20 pips. In addition to bearish patterns on weekly chart, here we have another smaller butterfly “Sell” and daily overbought (not shown).
But at the same time we have one very important issue here, that gives very high probability of short-term downward continuation. Take a look that price has moved below “C” point of our upward AB=CD pattern and creates reversal swing down. It means that AB-CD has no chances on further continuation to extended upside objective points and that, in turn, confirms downward action in short-term perspective. Trend has shift bearish here, as well as on weekly chart.
Nearest strong support is 1.3675-1.37 area – Fib level and daily oversold. It is difficult to say whether market will show suitable retracement till this area, but if it will – we can use it for short entry. May be we will see some bounce off MPS1, we’ll see…
4-hour
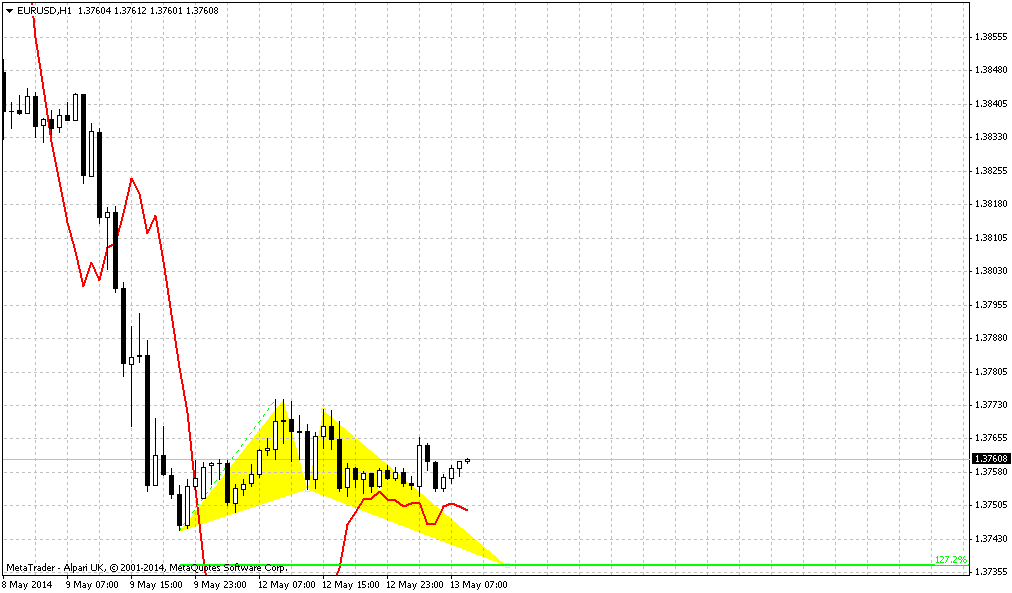
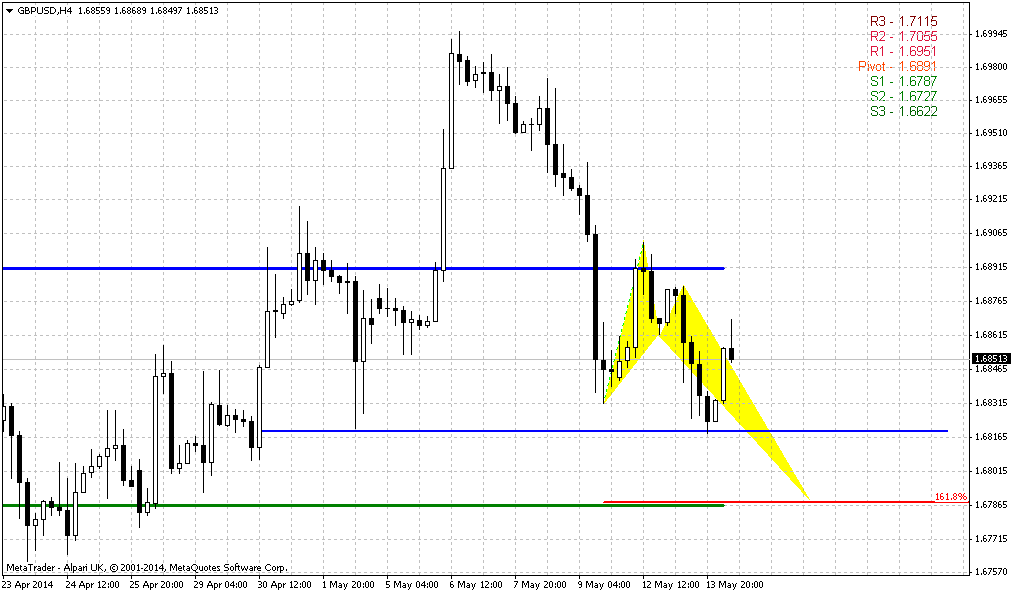
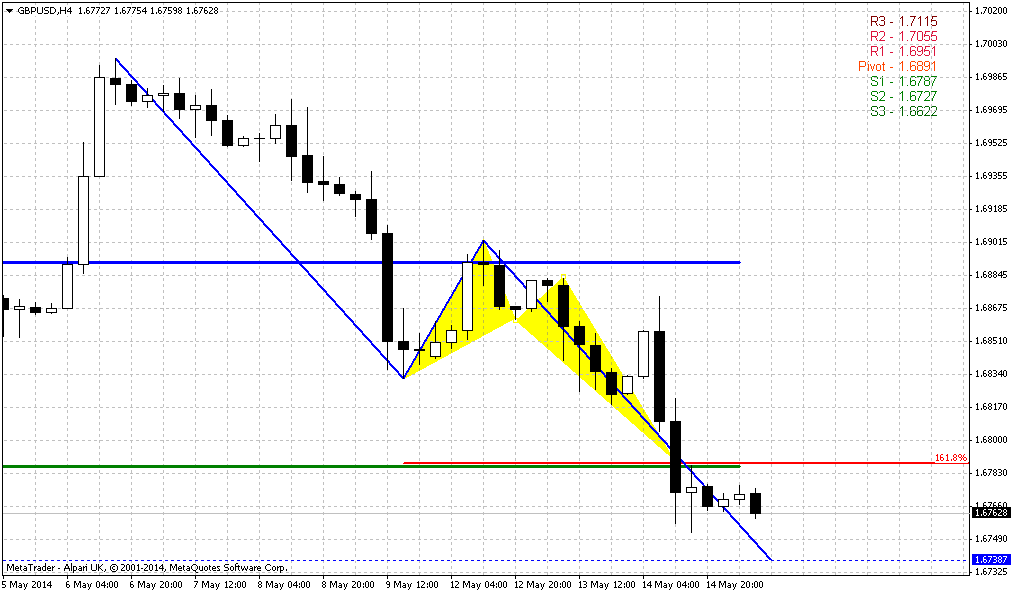
As usual, when we’re searching for bounce after solid move, we start to watch for DiNapoli patterns. Here is again – we have nice thrust down, that could become a foundation for DiNapoli either B&B or DRPO. In current situation B&B looks more logical. 1.3840 Fib level coincides with WPP. That could interesting area for monitoring of possible short entry.
Conclusion:
While price stands in 1.33-1.38 area we can’t speak either on upward or downward breakout. In May we will be watching for possible reversal months appearing. Price already has created new high and now the question is whether it will close below April’s lows.
In short-term perspective EUR shows a lot of bearish moments that should lead, probably, at least to some downward continuation. First target will stand at 1.3675-1.37 area. If we will get reasonable retracement – we will try to use it for short entry.
The technical portion of Sive's analysis owes a great deal to Joe DiNapoli's methods, and uses a number of Joe's proprietary indicators. Please note that Sive's analysis is his own view of the market and is not endorsed by Joe DiNapoli or any related companies.
The euro extended its sharp decline from a 2-1/2-year high against the dollar on Friday, a day after European Central Bank chief Mario Draghi did his best to sap the currency's strength by threatening more monetary stimulus. The U.S. dollar, meanwhile, traded at a one-week high against a basket of its major trading partners' currencies, pulling it off a 20-month low reached on Thursday. Following the ECB's policy meeting on Thursday, Draghi warned that the euro's strength was "a serious concern" and that the ECB was "comfortable" with taking more action to support economic growth and raise inflation at its June meeting. "The euro continued to fall overnight from Draghi's comments, but that move is starting to run out of legs," said John Doyle, currency strategist at Tempus Inc in Washington, D.C. "He has a number of times attempted to talk down the euro, and yet they haven't done much. The testing of $1.40 on the euro was right, but until the ECB actually acts, I don't see a sustained rally in the dollar. The market has been calling Draghi's bluff," Doyle said. "For me it is not a game changer. As long as quantitative easing continues in the U.S., we expect the dollar to remain under pressure," said Lutz Karpowitz, a currency strategist with Commerzbank in Frankfurt. "I would expect the euro to trade higher against the dollar next week."
JOBS DATA CLOBBERS CANADIAN DOLLAR
Weaker-than-expected April employment data in Canada sent a wave of selling through the loonie. A loss of 28,900 jobs defied forecasts for a gain of 12,000, suggesting the labor market has stalled. After hitting a four-month high on Thursday, the loonie has dropped 0.62 percent to C$1.0900, or 91.74 U.S. cents.
Trading ranges narrowed in the last hours of the week ahead of the May 11 federalization supporters’ referendum in Ukraine. Federalization supporters voted unanimously on Thursday in favor of holding a referendum on independence, ignoring calls by Russian President Vladimir Putin to postpone the vote to open the way for talks with Kiev authorities.
And a bit more on EUR… With EONIA on the rise, and with one-week EURIBOR rates moving above the ref. rate for only the second time, market analysts expect that the ECB will soon end the sterilization of its SMP purchases.
Short-term market interest rates have been increasing for a few months now against a backdrop of unchanged policy. This is primarily a consequence of the fact that excess liquidity has fallen to as low as €80 billion –Mr Draghi said last year that something around €200 billion was the expected level – as banks have made efforts to repay their LTROs early, and are hoarding liquidity ahead of the stress tests results and AQR. Unless the ECB acts quickly, the risk is that the pick-up in market rates will accelerate, further impairing the balance sheets of euro area banks. The ECB has long warned against the consequences of an unintended policy tightening – and that is precisely what we are seeing now. If the ECB waits much longer, interbank borrowing will become more difficult, and more expensive. In the same vein, Christian Noyer, governor of the Banque de France, said that he is ‘personally in favor of stopping the absorption of liquidity’.
As you can see, we have a bit different judgement on current situation. Many respectable analysts do not believe in long-term USD appreciation and suspect that EUR should return right back up. At the same time, as ECB will contract sterilization of excess liquidity and threatens markets with dovish policy, it is difficult to say definitely what will happen on fundamental area of events.
Technical
Although April was upward month, but overall action mostly should be classified as “inside” one to March range. Almost whole April price has spent in the same range. At the same time May action is starting to show its power. Although this has happened not quite independently but having ECB hand in EUR dynamic, still, technically we see attempt of reversal on monthly chart. We saw something cognate on February action, but it didn’t lead to any downward continuation. At the same time, currently situation is slightly different because there was no solid upward action in April, and now we have a month candle that has moved above April high. If May will close below April low – we will get monthly reversal bar and this could lead at least to some downward continuation. Part of this work has been done already.
By looking at bigger picture, market stands in tight range since 2014. Thus, 1.33-1.3850 is an area of “indecision”. While market stands inside of it we can talk about neither upward breakout nor downward reversal. At least, reversal identification could be done with yearly pivot – if market will move below it, this could be early sign of changing sentiment. But, as you can see, nothing among this issues have happened yet.
Speaking about upward continuation, market mechanics does not allow price to show any deep retracement any more. Any move of this kind should be treated as market weakness and it will increase probability of reversal down. Take a look that as market has hit minor 0.618 AB-CD extension target right at former rock hard resistance – Fib level and Agreement and former yearly PR1, it has shown reasonable bounce down to 1.33. As retracement after 0.618 target already has happened, it is unlogical and unreasonable to see another deep bounce and if it will happen - it will look suspicious.
So, speaking about monthly upside targets... If we will get finally real break through resistance, we have two major targets – AB=CD one around 1.44 and Yearly PR1 = 1.4205.
That’s being said, we do not see any significant changes on monthly – price still stands in the range of 1.3350-1.3850 area. As recent upward breakout has failed – in short term perspective we could get bounce down, but based on monthly chart it is impossible to say how deep it could be.
Weekly
On weekly chart we have full pack of bearish signs. It’s a bit uncomfortable that they are too obvious, but they are facts that we can’t ingore still. Besides, fundamentally EUR/USD pair also has reasons to move lower. Although said Lutz Karpowitz, a currency strategist with Commerzbank in Frankfurt said: “As long as quantitative easing continues in the U.S., we expect the dollar to remain under pressure”, - but currently it’s not quite the same QE. It was contracted twice and dollar supply has decreased. At the same time ECB stands near stopping of its liquidity sterilization action and this should increase the supply of EUR, or, at least it should stop contracting it. These opposite measures play in favor of EUR/USD downward action probably.
By looking at technical issues, we have a lot of bearish signs: butterfly “sell” at MPR1, accompanied by bearish wedge and divergence with MACD. Market has moved below MPP and has formed bearish stop grabber pattern that suggests taking out of 1.3670 lows. At the same time grabber bar is a reversal week – market has created new high and close below bottom of previous week. And, finally, this week was W&R of previous highs. I will not dare to speak about long-term reversal, but at least minor continuation should follow. Nearest support stands around 1.35-1.3520 area and includes two major points – Fib support and YPP at 1.3475.
Daily
Well, guys, I do not want to treat our upward analysis on previous week as poor, because market mostly completes the target and has not reached it just for 15-20 pips. In addition to bearish patterns on weekly chart, here we have another smaller butterfly “Sell” and daily overbought (not shown).
But at the same time we have one very important issue here, that gives very high probability of short-term downward continuation. Take a look that price has moved below “C” point of our upward AB=CD pattern and creates reversal swing down. It means that AB-CD has no chances on further continuation to extended upside objective points and that, in turn, confirms downward action in short-term perspective. Trend has shift bearish here, as well as on weekly chart.
Nearest strong support is 1.3675-1.37 area – Fib level and daily oversold. It is difficult to say whether market will show suitable retracement till this area, but if it will – we can use it for short entry. May be we will see some bounce off MPS1, we’ll see…
4-hour
As usual, when we’re searching for bounce after solid move, we start to watch for DiNapoli patterns. Here is again – we have nice thrust down, that could become a foundation for DiNapoli either B&B or DRPO. In current situation B&B looks more logical. 1.3840 Fib level coincides with WPP. That could interesting area for monitoring of possible short entry.
Conclusion:
While price stands in 1.33-1.38 area we can’t speak either on upward or downward breakout. In May we will be watching for possible reversal months appearing. Price already has created new high and now the question is whether it will close below April’s lows.
In short-term perspective EUR shows a lot of bearish moments that should lead, probably, at least to some downward continuation. First target will stand at 1.3675-1.37 area. If we will get reasonable retracement – we will try to use it for short entry.
The technical portion of Sive's analysis owes a great deal to Joe DiNapoli's methods, and uses a number of Joe's proprietary indicators. Please note that Sive's analysis is his own view of the market and is not endorsed by Joe DiNapoli or any related companies.
")
