Sive Morten
Special Consultant to the FPA
- Messages
- 18,695
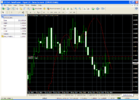
Monthly
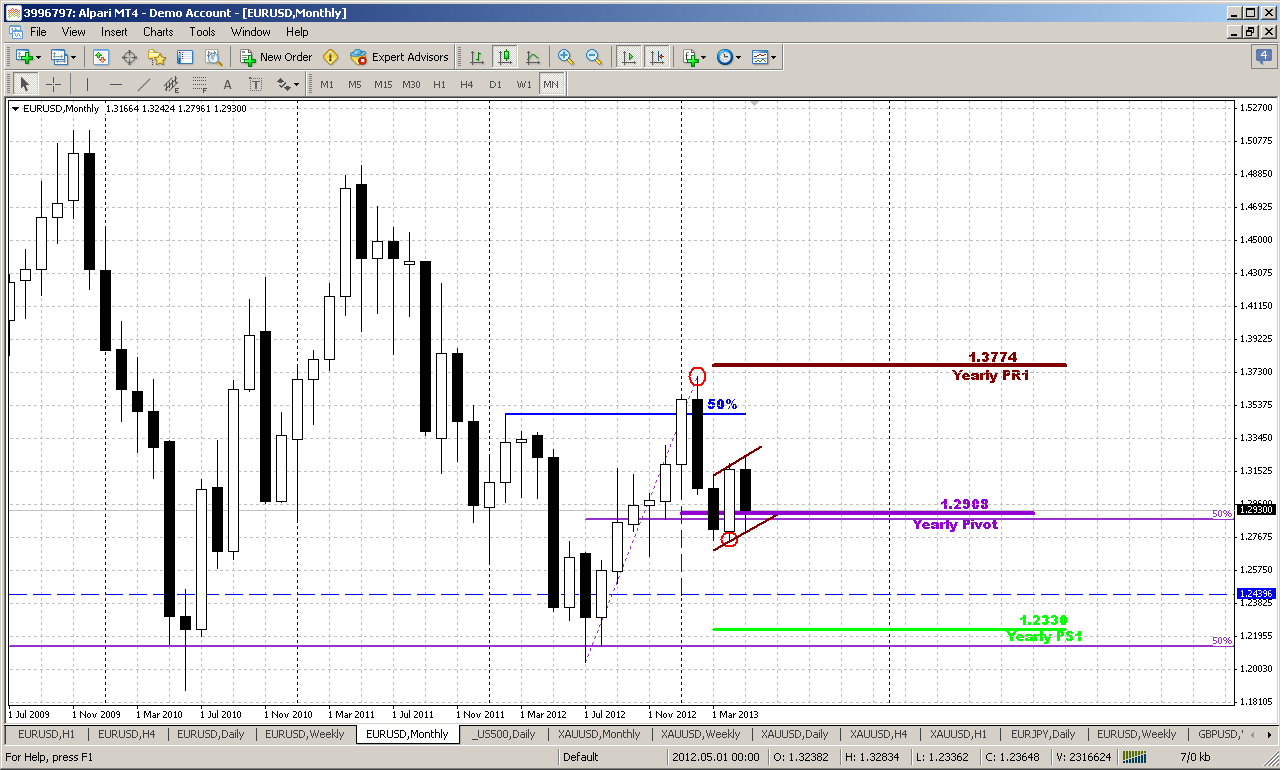
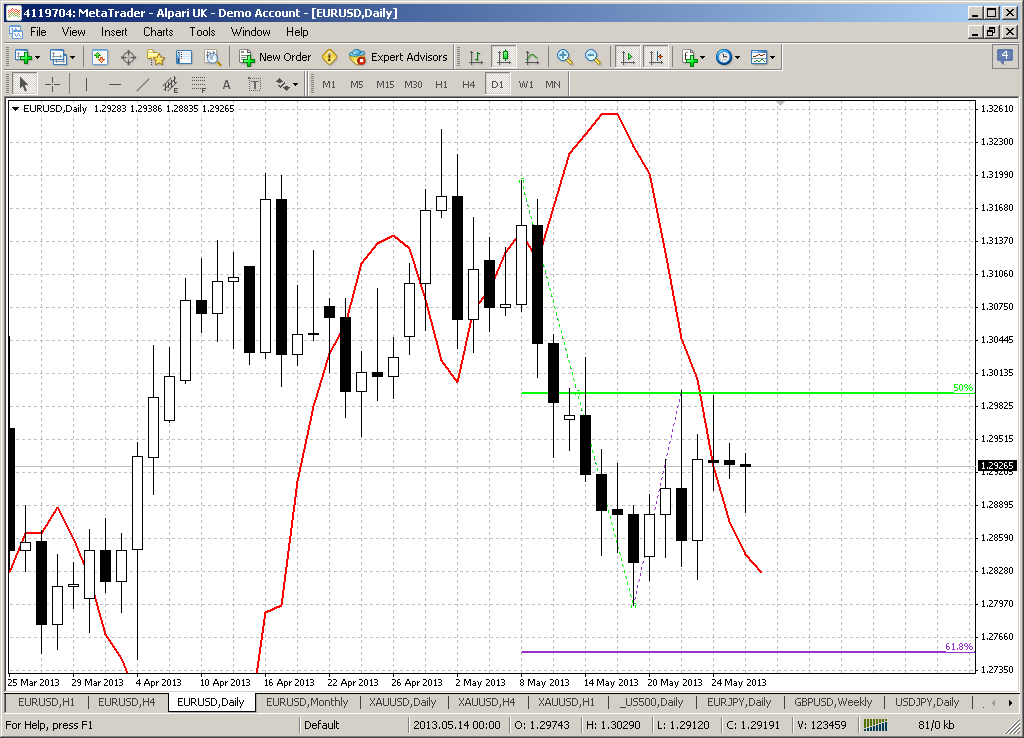
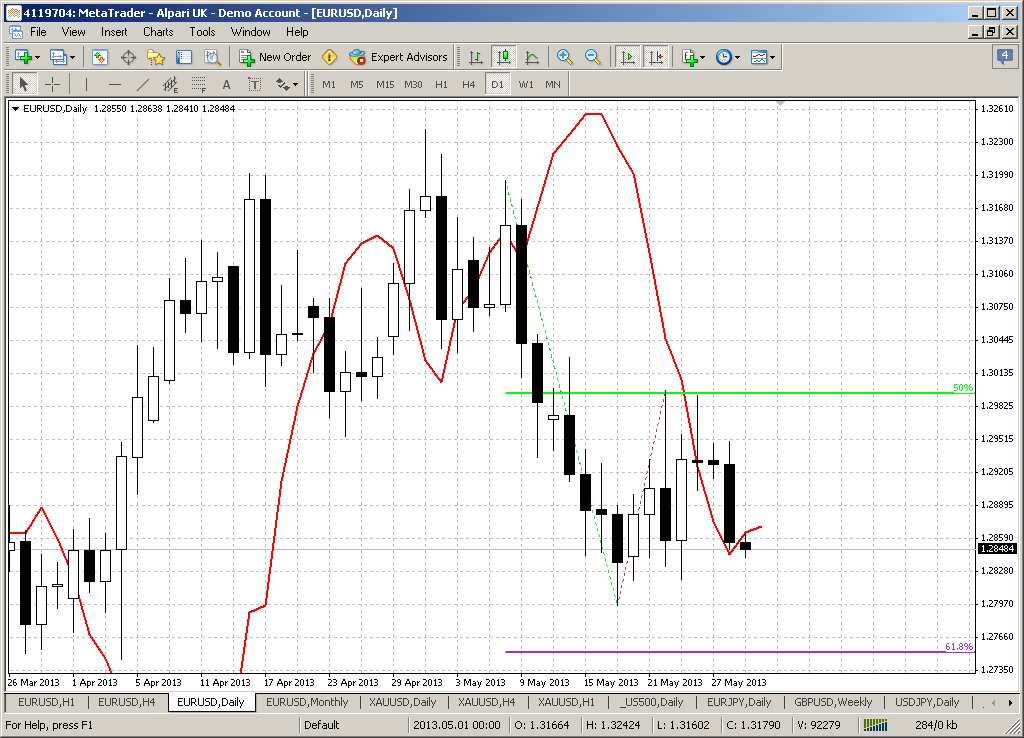
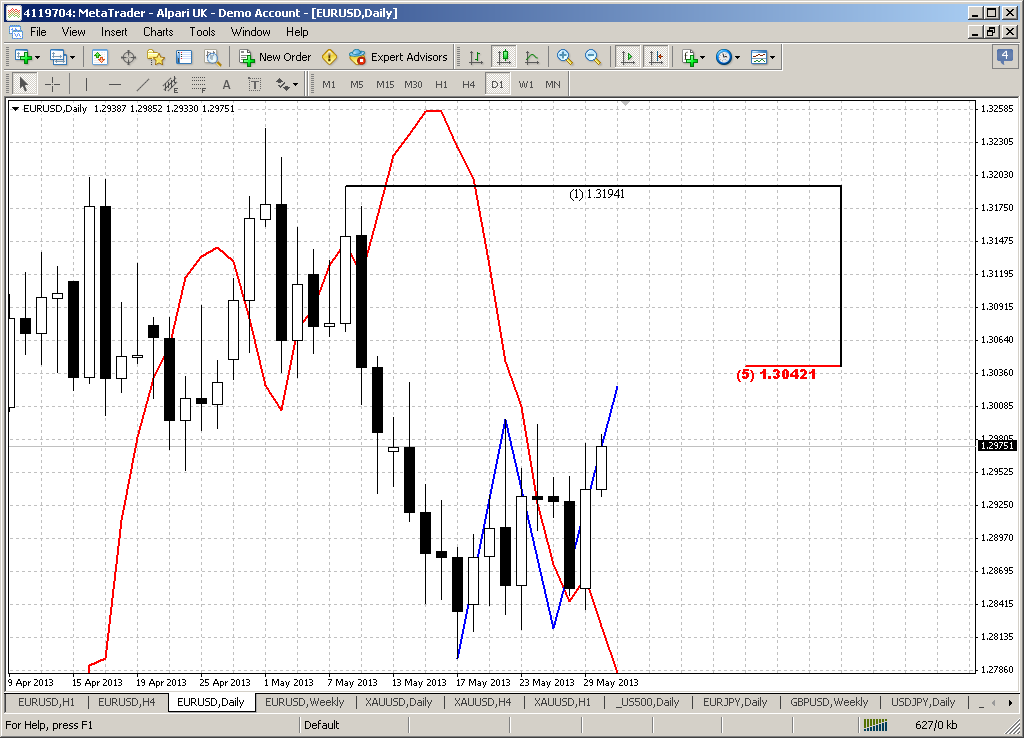
Monthly chart now looks very intriguing. First of all here we can see impact of yearly pivot support. This is really long-term support and it rather strong, especially since it coincides with 50% Fib support, and market can’t still pass through it. In fact, moving below yearly pivot will give market the direction for the rest of the year – that’s why this level is significant.
On previous week we’ve discussed appearing of bullish engulfing pattern around 1.29 area and perspectives of it, but on passed week market has shown too extended retracement down. Although lows of engulfing have not been taken out, now it starts to look more as flag bearish continuation pattern, rather than upward continuation appeal.
Currently I do not see valuable reasons to speak about upward trend – signs of it are weak, if they exist at all. Even if we will not take into consideration MACD bear trend, it will be possible to start think about potential upward action only if market will return right back to major 50% resistance around 1.3500 area at minimum, or even will take out 1.37 highs.
Conversely bearish continuation needs to show shallower confirmations – will be enough, if market will break flag down and move below yearly pivot point. Perspectives of this potential action are really impressive. First road will be to 1.2150- 1.2330 Yearly pivot support 1 and all time 50% support. But next is 1.1650 – take a look, may be you also will find potential left wing of butterfly “Buy” here...
Even if we take a look at nature of action here, we can see that downward candles are faster, greater and heavier. Previous retracement up lasted for 7 monthly, but after 2 months market has passed half of it back. The combination of all these moments makes me think that domination on bears’ side now. I can’t specify precisely the value of it, but it seems that bears have more power here now.
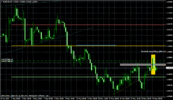
Weekly
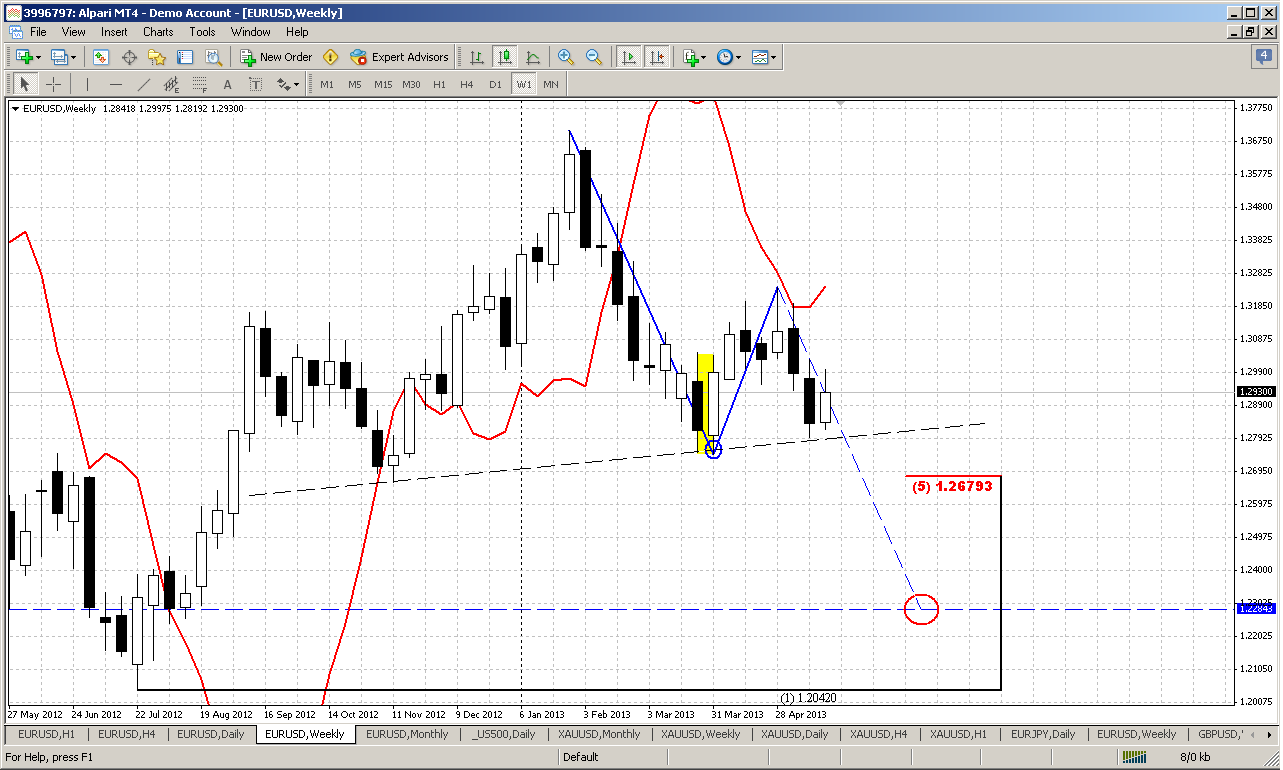
Here I do not see any drastical changes. Actually we have inside week, despite all doom and gloom and furious action within the previous week. Although initially we’ve made assumption that upward retracement will become just a shadow on weekly candle and market will pass neckline down, but EUR has given us just small white candle – inside one to previous week, and I do not see any problems with that. Left shoulder of current pattern consists of 11 candles, while right shoulder has only 9, so there is no break of time harmony here just yet.
So, on weekly chart context is the same – H&S and bearish stop grabber pattern. Targets are the same:
If this pattern will work – it will lead us to 1.23 area, that is also yearly pivot support 1 and last stand for the bulls – you’ll see this easily if take a bit extended view on monthly chart. All swing lows stand around 1.2150-1.2350 – that is all time 50% support level.
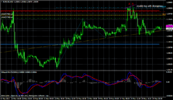
Daily
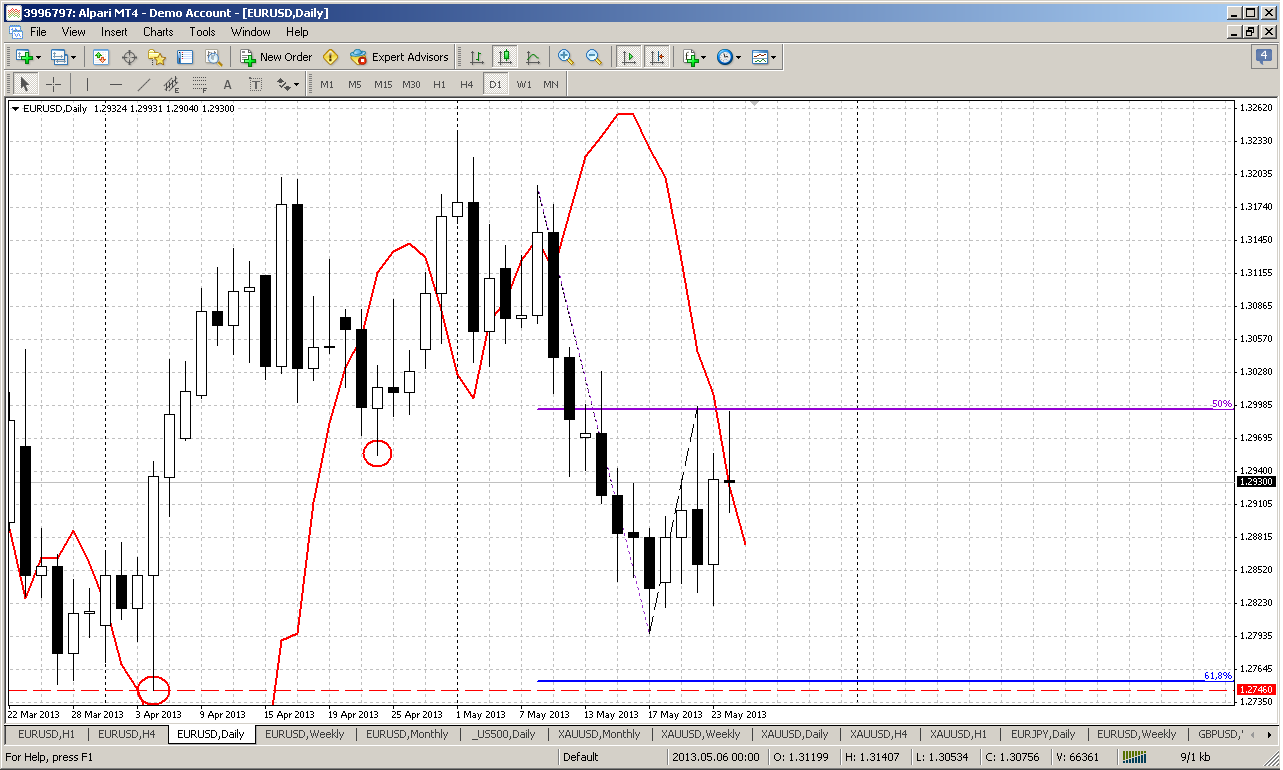
On daily time frame we’ve discussed potential targets and levels million of times and we know that potential downward target is 1.2750 low – current AB-CD 0.618 extension target, weekly stop grabber target. Here in fact we’re interested in just one thing – do we have bearish stop grabber here or not. By-the-book approach we don’t – market has closed 3 pips higher than MACDP line, but I think that we do. We will not treat it as stop grabber and will not apply common rules to trade it, but as you will see a bit later – we will have other patterns that point on downward action, that in general support an idea of stop grabber here. Besides, as I’ve said in previous daily updates, since dollar-related markets now mostly are driven by USD, rather than basis assets – we have stop grabber on daily gold, that due to mentioned reason, could also relatively confirm current situation on EUR. If you will compare 2-3 weeks action on gold and EUR, you’ll find that it almost identical.
Thus, although this opinion is disputable, I am inclined to put the bet on bearish action and stick with most recent swing down as a basis for our trading on next week.
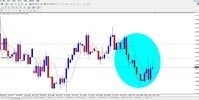
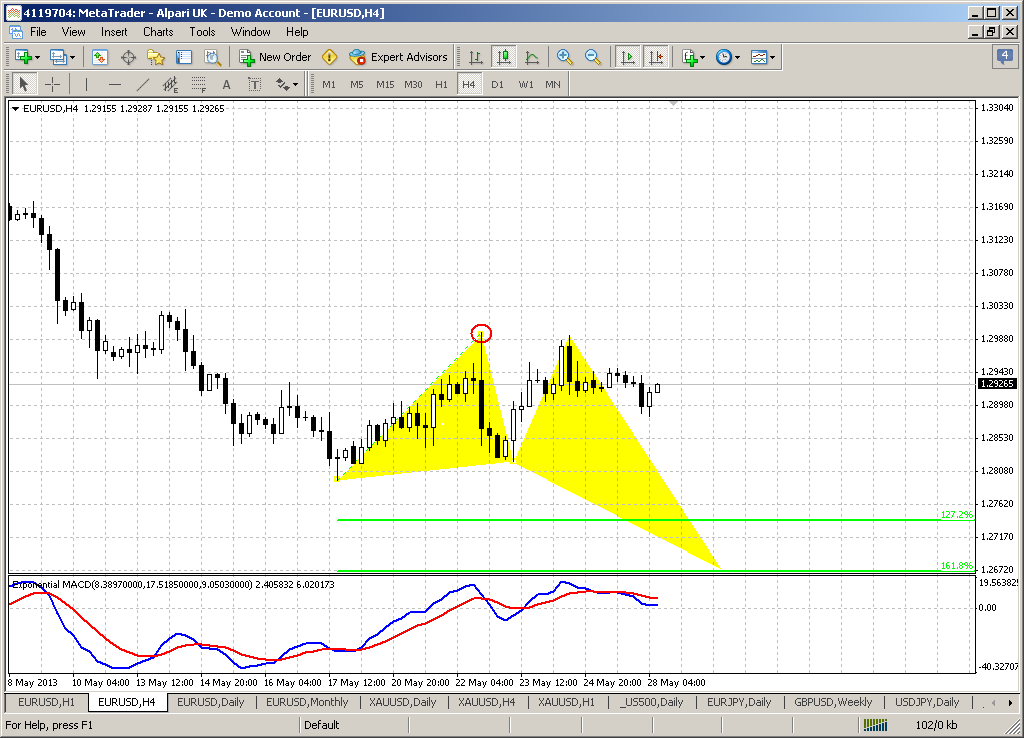
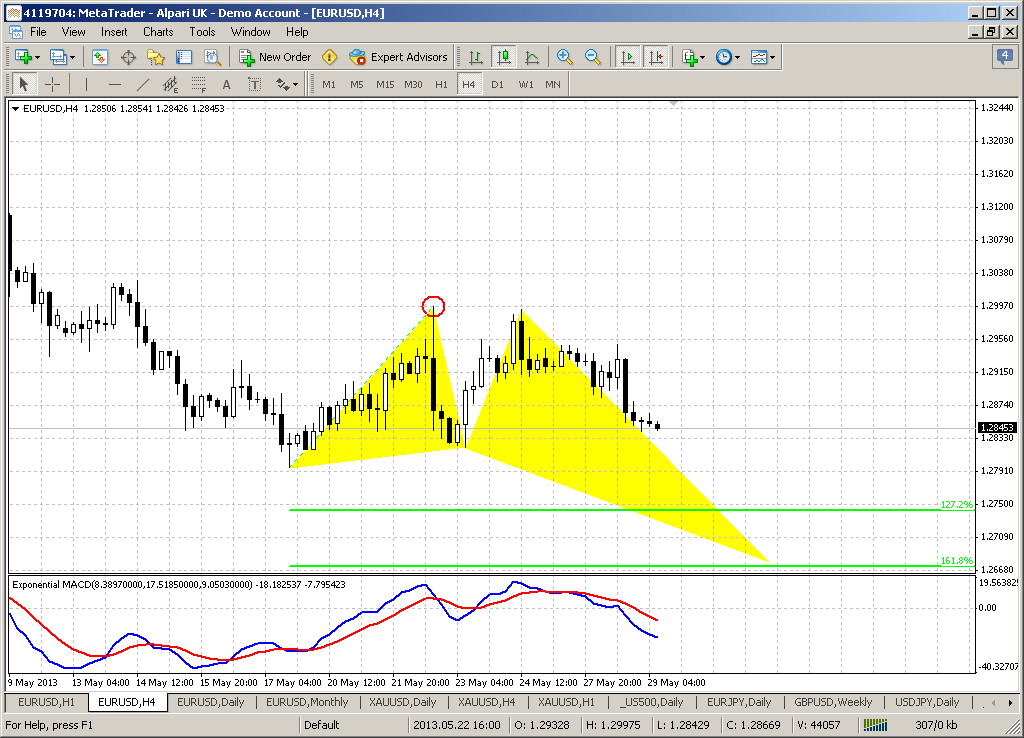
4-hour
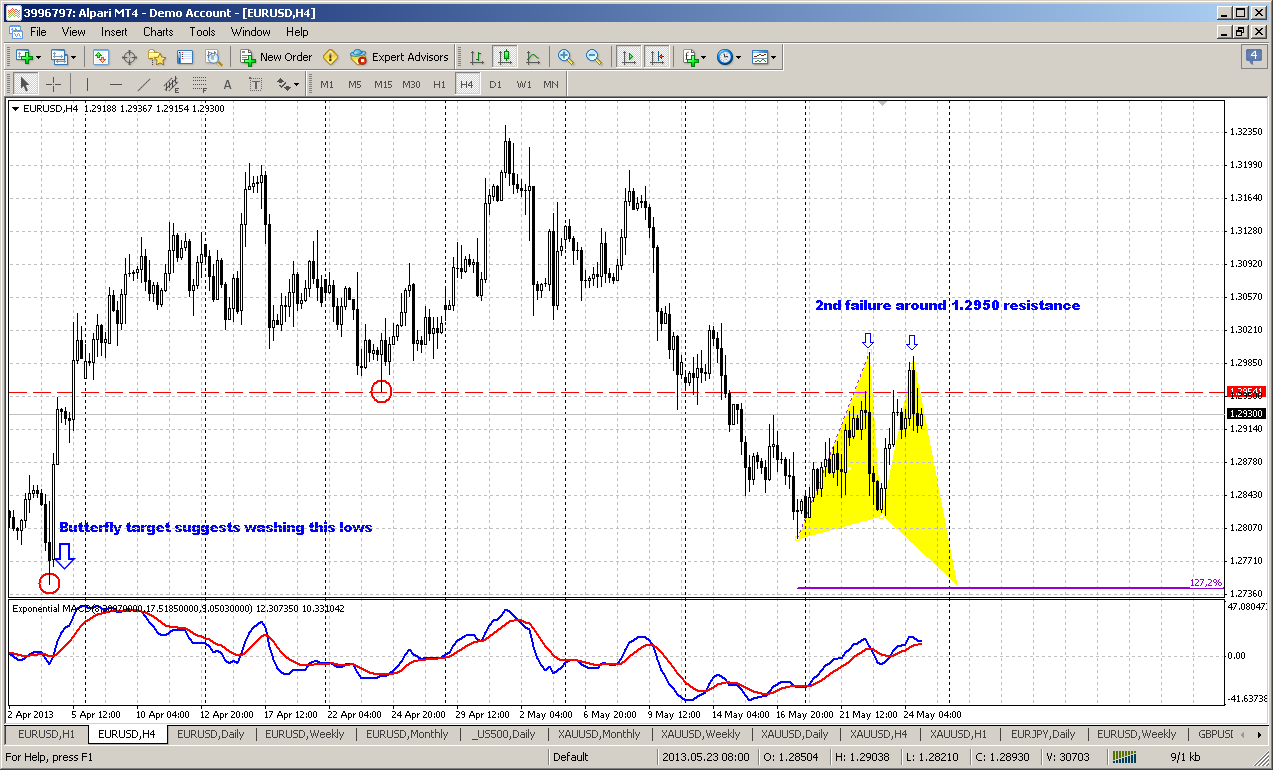
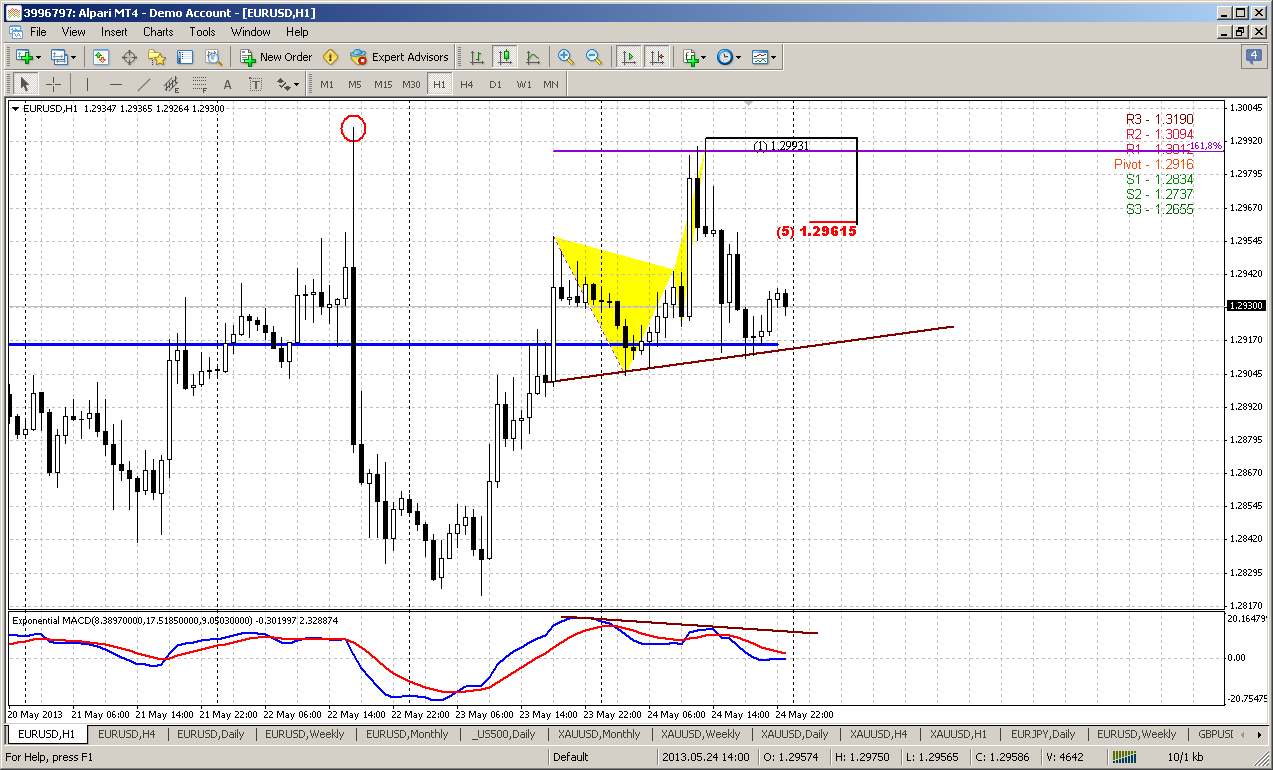
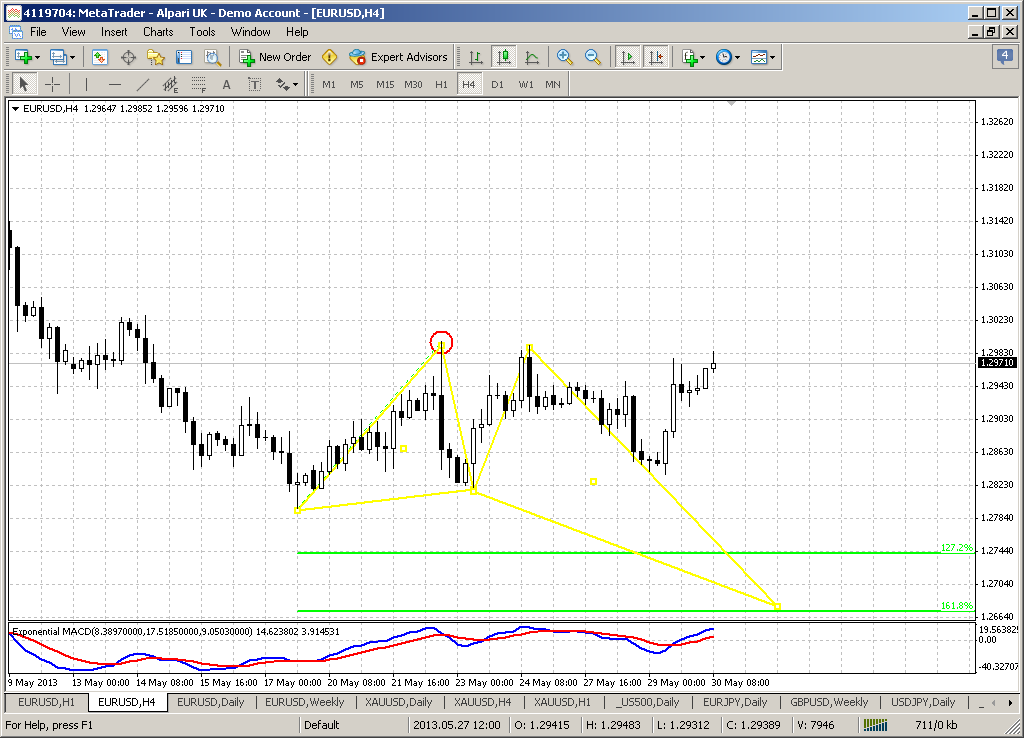
This time frame in fact, is a major one for our plan. We’ve talked about this pattern on Friday and now the chances that it will start to work are growing. Here is another explanation why I offer to stick with most recent swing down. As we talked previously, if market will move above 1.2950 – it will erase all bearish patterns and return right back in previous consolidation. That will simulteniously open road to 1.3250 highs. That’s why short-term bearish invalidation point – is top of the butterfly. If, conversely, butterfly will work – we can count of impressive risk/reward trade.
Speaking about butterfly itself, we see second price failure to pass through 1.2950 area. Now it looks like bearish engulfing here. Also take a note, that even 1.27 butterfly target suggests taking out of daily 1.2750 lows, i.e. stands in agreement with weekly stop grabber pattern and daily AB-CD. But I think that if 1.2750 lows will fall – market will get acceleration down and we should be focused on 1.618 butterfly here probably, at minimum.
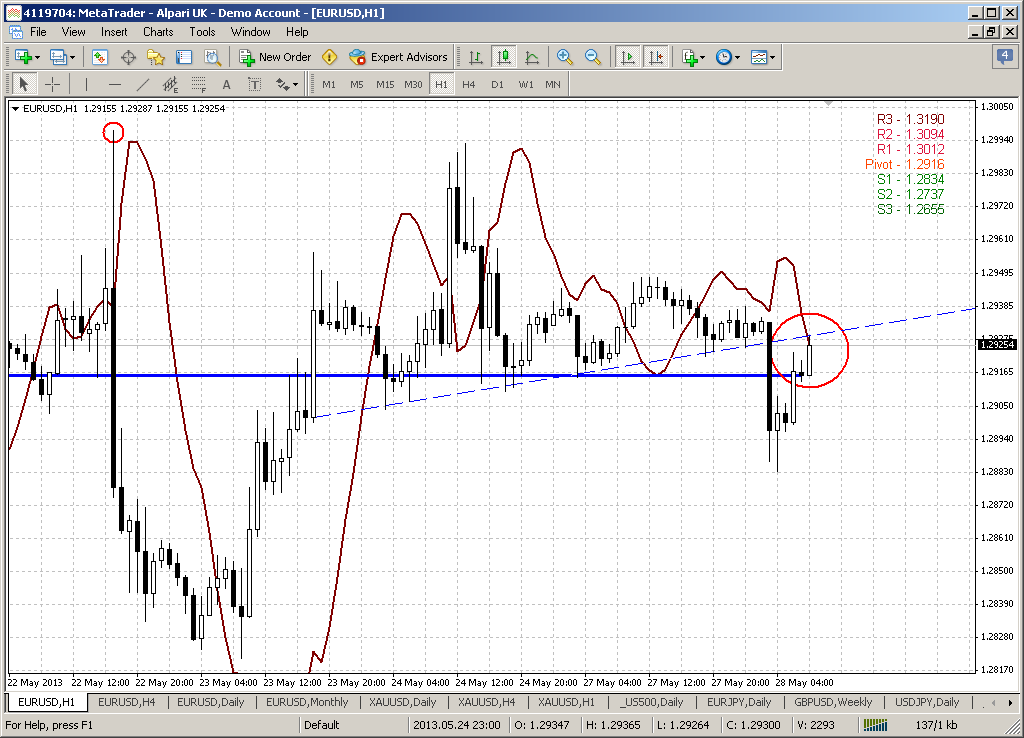
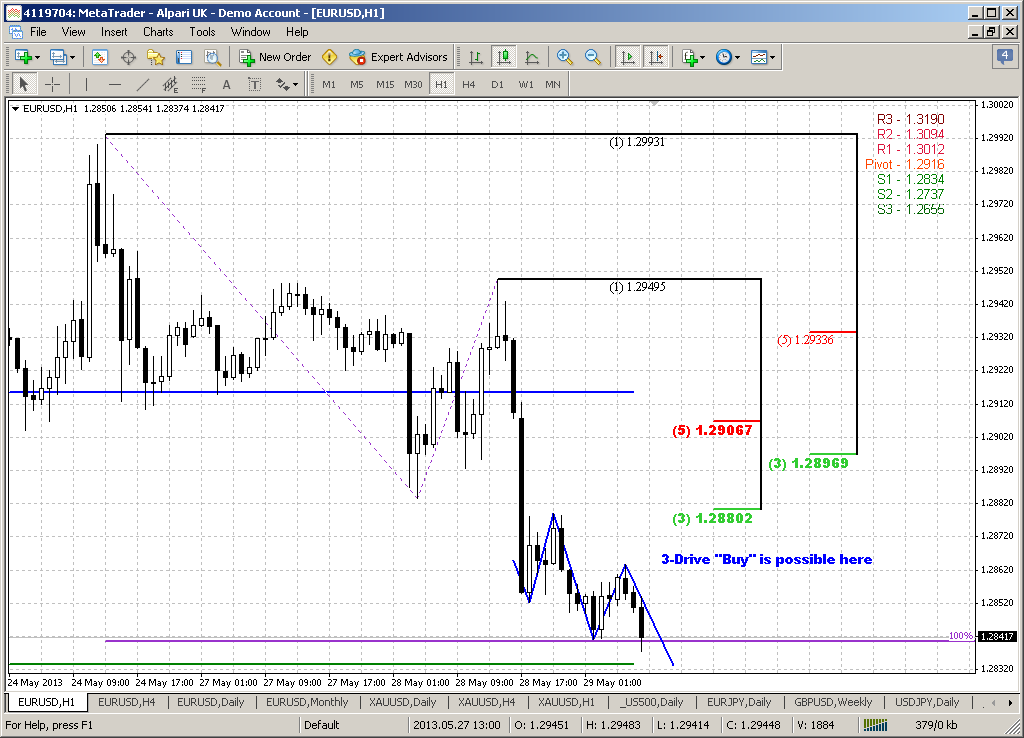
60-min
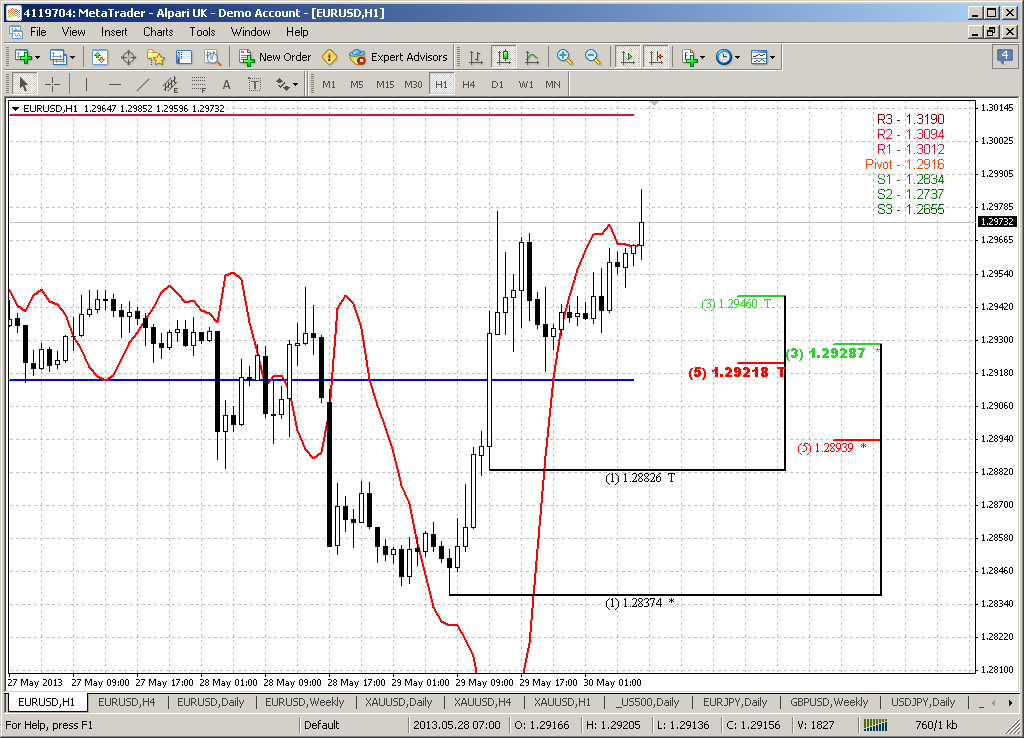
Here is second pattern, that I’ve talked about in “daily” part of research – hourly H&S. Also it includes Friday butterfly, that we’ve talked about in video. As this pattern has been formed right at major resistance, we can also take into consideration MACD bearish divergence. Trend has turned bearish here. By looking at this setup we can easily create a trading plan – enter short somewhere around 1.2950-1.2960 with stops above red circle – 1.30. Interestingly, that WPP stands precisely at neckline. If market will break it down – we simulteniously get as sentiment as technical confirmation of bearish development.
Conclusion:
In a big picture market stands at the edge of the deep – some steps down on monthly chart could lead to really dramatic fall to extended downward targets.
Meantime, on short-term perspective, we have various bearish patterns that point on potential downward development at minimum to 1.2750. Existence of very close invalidation point makes participation on bearish side even more attractive.
At least currently I do not see any reasons to take long positions. We probably will get some, if market will erase short-term bearish context and return right back above 1.30 area and hold there.
The technical portion of Sive's analysis owes a great deal to Joe DiNapoli's methods, and uses a number of Joe's proprietary indicators. Please note that Sive's analysis is his own view of the market and is not endorsed by Joe DiNapoli or any related companies.
Monthly chart now looks very intriguing. First of all here we can see impact of yearly pivot support. This is really long-term support and it rather strong, especially since it coincides with 50% Fib support, and market can’t still pass through it. In fact, moving below yearly pivot will give market the direction for the rest of the year – that’s why this level is significant.
On previous week we’ve discussed appearing of bullish engulfing pattern around 1.29 area and perspectives of it, but on passed week market has shown too extended retracement down. Although lows of engulfing have not been taken out, now it starts to look more as flag bearish continuation pattern, rather than upward continuation appeal.
Currently I do not see valuable reasons to speak about upward trend – signs of it are weak, if they exist at all. Even if we will not take into consideration MACD bear trend, it will be possible to start think about potential upward action only if market will return right back to major 50% resistance around 1.3500 area at minimum, or even will take out 1.37 highs.
Conversely bearish continuation needs to show shallower confirmations – will be enough, if market will break flag down and move below yearly pivot point. Perspectives of this potential action are really impressive. First road will be to 1.2150- 1.2330 Yearly pivot support 1 and all time 50% support. But next is 1.1650 – take a look, may be you also will find potential left wing of butterfly “Buy” here...
Even if we take a look at nature of action here, we can see that downward candles are faster, greater and heavier. Previous retracement up lasted for 7 monthly, but after 2 months market has passed half of it back. The combination of all these moments makes me think that domination on bears’ side now. I can’t specify precisely the value of it, but it seems that bears have more power here now.
Weekly
Here I do not see any drastical changes. Actually we have inside week, despite all doom and gloom and furious action within the previous week. Although initially we’ve made assumption that upward retracement will become just a shadow on weekly candle and market will pass neckline down, but EUR has given us just small white candle – inside one to previous week, and I do not see any problems with that. Left shoulder of current pattern consists of 11 candles, while right shoulder has only 9, so there is no break of time harmony here just yet.
So, on weekly chart context is the same – H&S and bearish stop grabber pattern. Targets are the same:
If this pattern will work – it will lead us to 1.23 area, that is also yearly pivot support 1 and last stand for the bulls – you’ll see this easily if take a bit extended view on monthly chart. All swing lows stand around 1.2150-1.2350 – that is all time 50% support level.
Daily
On daily time frame we’ve discussed potential targets and levels million of times and we know that potential downward target is 1.2750 low – current AB-CD 0.618 extension target, weekly stop grabber target. Here in fact we’re interested in just one thing – do we have bearish stop grabber here or not. By-the-book approach we don’t – market has closed 3 pips higher than MACDP line, but I think that we do. We will not treat it as stop grabber and will not apply common rules to trade it, but as you will see a bit later – we will have other patterns that point on downward action, that in general support an idea of stop grabber here. Besides, as I’ve said in previous daily updates, since dollar-related markets now mostly are driven by USD, rather than basis assets – we have stop grabber on daily gold, that due to mentioned reason, could also relatively confirm current situation on EUR. If you will compare 2-3 weeks action on gold and EUR, you’ll find that it almost identical.
Thus, although this opinion is disputable, I am inclined to put the bet on bearish action and stick with most recent swing down as a basis for our trading on next week.
4-hour
This time frame in fact, is a major one for our plan. We’ve talked about this pattern on Friday and now the chances that it will start to work are growing. Here is another explanation why I offer to stick with most recent swing down. As we talked previously, if market will move above 1.2950 – it will erase all bearish patterns and return right back in previous consolidation. That will simulteniously open road to 1.3250 highs. That’s why short-term bearish invalidation point – is top of the butterfly. If, conversely, butterfly will work – we can count of impressive risk/reward trade.
Speaking about butterfly itself, we see second price failure to pass through 1.2950 area. Now it looks like bearish engulfing here. Also take a note, that even 1.27 butterfly target suggests taking out of daily 1.2750 lows, i.e. stands in agreement with weekly stop grabber pattern and daily AB-CD. But I think that if 1.2750 lows will fall – market will get acceleration down and we should be focused on 1.618 butterfly here probably, at minimum.
60-min
Here is second pattern, that I’ve talked about in “daily” part of research – hourly H&S. Also it includes Friday butterfly, that we’ve talked about in video. As this pattern has been formed right at major resistance, we can also take into consideration MACD bearish divergence. Trend has turned bearish here. By looking at this setup we can easily create a trading plan – enter short somewhere around 1.2950-1.2960 with stops above red circle – 1.30. Interestingly, that WPP stands precisely at neckline. If market will break it down – we simulteniously get as sentiment as technical confirmation of bearish development.
Conclusion:
In a big picture market stands at the edge of the deep – some steps down on monthly chart could lead to really dramatic fall to extended downward targets.
Meantime, on short-term perspective, we have various bearish patterns that point on potential downward development at minimum to 1.2750. Existence of very close invalidation point makes participation on bearish side even more attractive.
At least currently I do not see any reasons to take long positions. We probably will get some, if market will erase short-term bearish context and return right back above 1.30 area and hold there.
The technical portion of Sive's analysis owes a great deal to Joe DiNapoli's methods, and uses a number of Joe's proprietary indicators. Please note that Sive's analysis is his own view of the market and is not endorsed by Joe DiNapoli or any related companies.
") . I only put 2 positions because the move up was very strong
. I only put 2 positions because the move up was very strong