Sive Morten
Special Consultant to the FPA
- Messages
- 18,673
Monthly
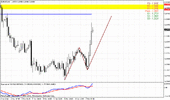
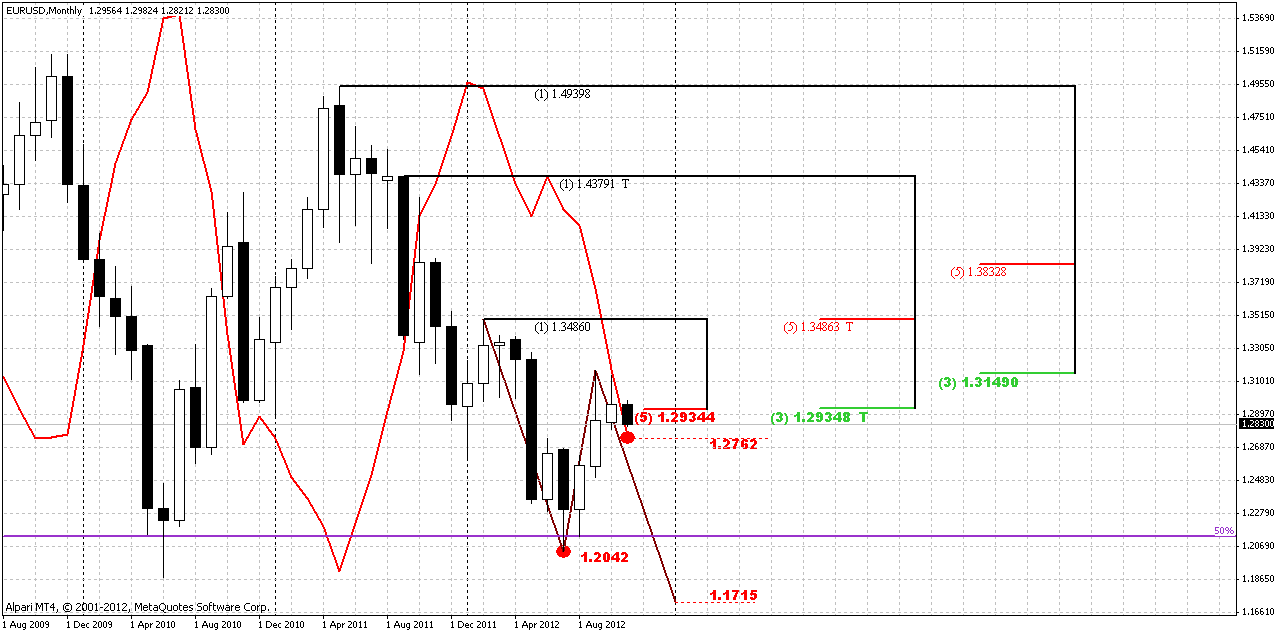
New month has started and at once has brought significant changes on monthly chart. Now it is clear that market has stuck in monthly Confluence resistance area 1.2934-1.3149. In current moment, looking at pullback outside of it, we can suggest that the first challenge was unsuccessful, but will follow the next one? We can’t exclude this absolutely. For instance, some sort of double bottom could be formed, or something like that, we don’t know. I prefer to talk about it stick to the subject, that we do not have yet.
What is more important for us is that definitely some downward move should come. Since this is monthly time frame, this move could be really significant. Even if we mostly trade on daily and intraday charts, we could get definite direction for long-term perspective. That’s why higher time frames are important.
Now, pay attention to MACD Predictor. November bar stands very close to it, and by November open price trend has turned bullish. The trend breakeven point for current month is 1.2762. If monthly bar will close below this level we will get bearish stop grabber on monthly chart with minimum target – clearing of 1.2042 low. Since 1.2042 stands below 0.618 target of drawn AB=CD pattern, it’s a high probability that market will proceed to 1.17 area initially – target of AB=CD. 1.17 in turn, stands slightly lower previous long-term 2010 lows. Just imagine what will happen, if market will trigger stops below it. We easily could get achievement of our long term 1.15-1.16 target.
But let’s pass from one to another gradually. Our first task on monthly is to wait for November close. Let’s get stop grabber first and only after that will discuss other things.
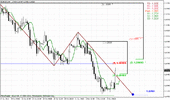
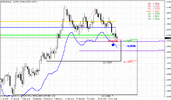
Weekly
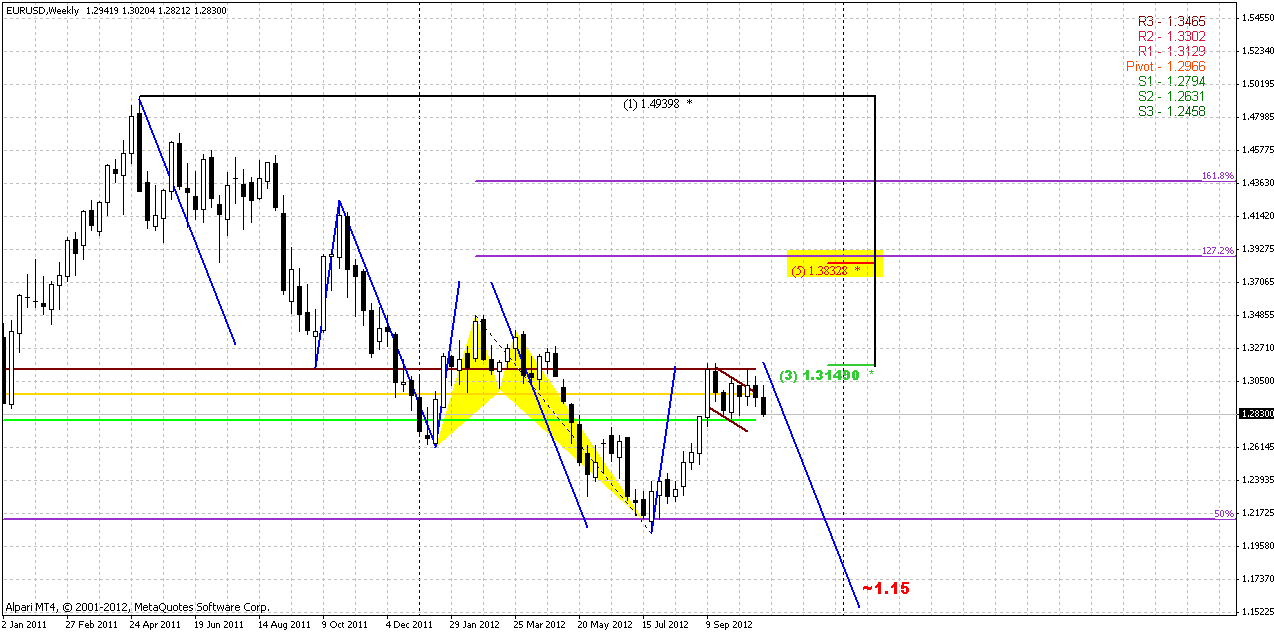
Here is almost the same chart as on previous week. Analysis that we’ve made on previous week is still relevant, so I’ve held most tools as it were on week before. There are still two things that give us assistance in understanding of situation here. First is gibberish bullish flag, second is harmonic swings.
Our suggestion about affectation of price action on breakout of flag now is getting confirmation from price. The price action that has followed to its breakout looks bearish. That is much like classical bullish trap, this is not the way how flag’s breakout should looks like. Probably we could adjust the line so that we have no breakout, but I suppose not in this time. This resistance is absolutely clear on daily time frame. The price return right back in the flag’s body tells that we should be ready for donward move, and this move on weekly time frame could be strong. Flag per se is amount of overlapping bars, some sort of indecision. Usually such stagnation is followed by acceleration. Previously we’ve suggested, based on failure breakout, that this acceleration should be bearish. Now we have more confidence with this assumption.
Finally, take a look at blue lines. They were cloned. Downward swings are cloned from initial swing down, while upward swings from first upward retracement. Take a look what a harmony! Yes, on second couple of swings, upward retracement was slightly smaller, but downward swing was either. If we count both of them from “correct” point (as it shown on the chart), then they will finish in the same point as actual swings. Now we have equal upward retracement completed. If we suggest that this harmony will continue further, market should show swing to ~1.15. When I’ve seen this number, I’m suddenly recalled our quarterly analysis that we’ve done in November 2011 where we said about long-term forecast 1.16.
https://www.forexpeacearmy.com/fore...pro-weekly-october-31-november-04-2011-a.html
So, may be now it looks not as impossible as it was couple weeks ago... Anyway, guys, I probably more gravitate to conclusion that bears overweight bulls right now.
Also pay attention that we have new Monthly pivot points, although they are almost the same as on previous month. Numbers in a right upper corner.
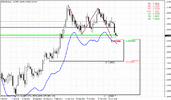
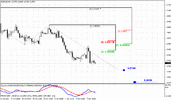
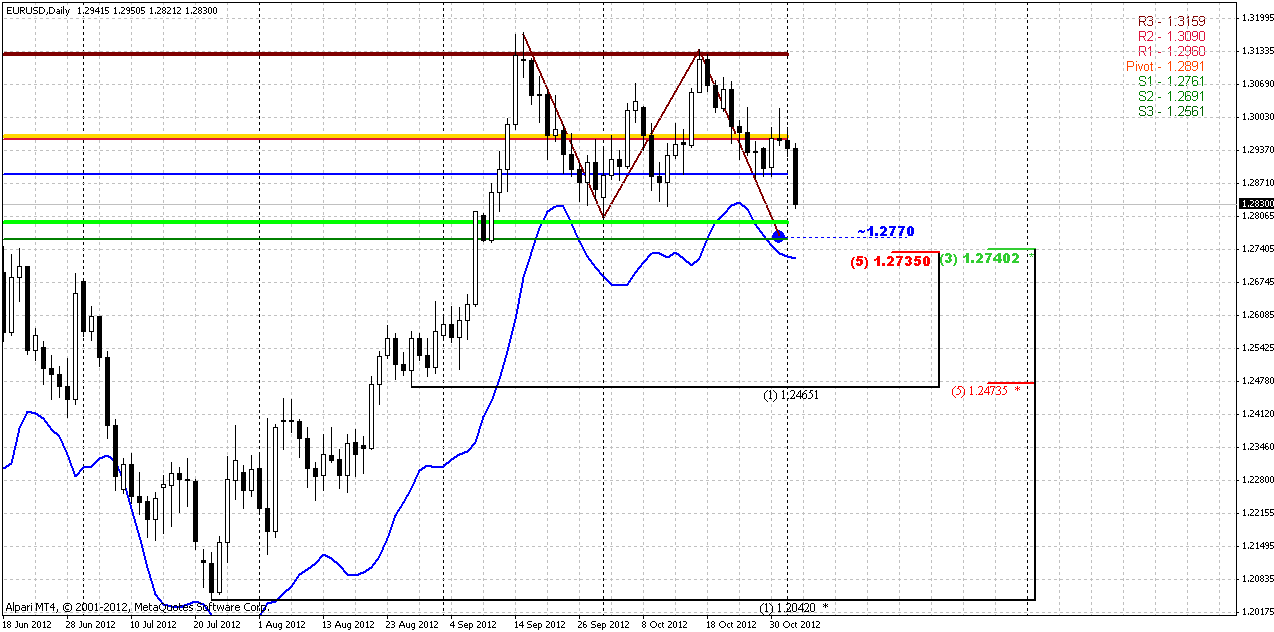
Daily
Trend holds bearish here. We have perfect downward development, even from theoretical point of view. Large AB=CD pattern has started as “222” sell model. After hitting of 0.618 minor extension (we’ve discussed it in daily updates), market has shown shallow retracement and has continued move down. Next destination point is 1.2750-1.2770 area that includes AB=CD target, daily Confluence support, daily overbought and WPS1 – thin green line on the chart. Thick lines are Monthly pivot levels.
Take a look that monthly pivot has not been touched yet and it coincides with WPR1 at current week. New barrier that has appeared is November pivot support 1 at 1.2794.
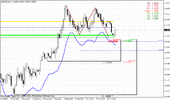
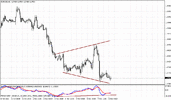
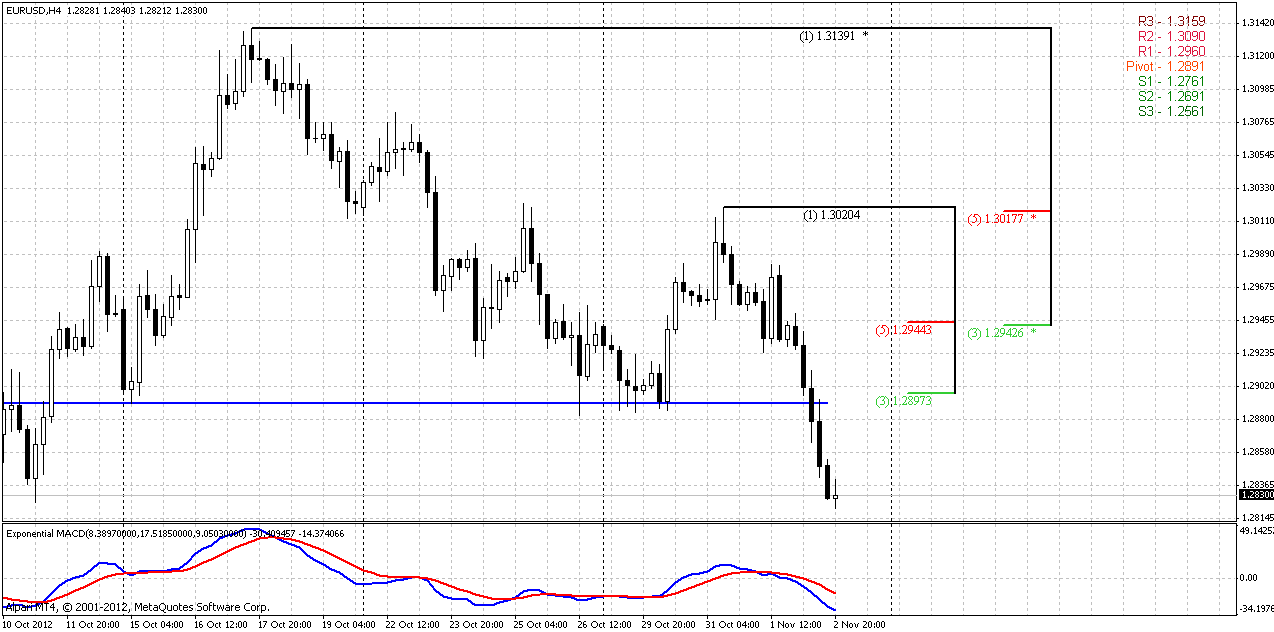
4-hour
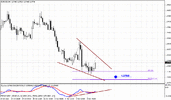
Trend holds bearish here as well. To join the party we can use two potential levels. First one, that is more prefferable is 1.29 area – Fib resistance + WPP + previous lows. Next area is 4-hour Confluence resistance at 1.2945 area.
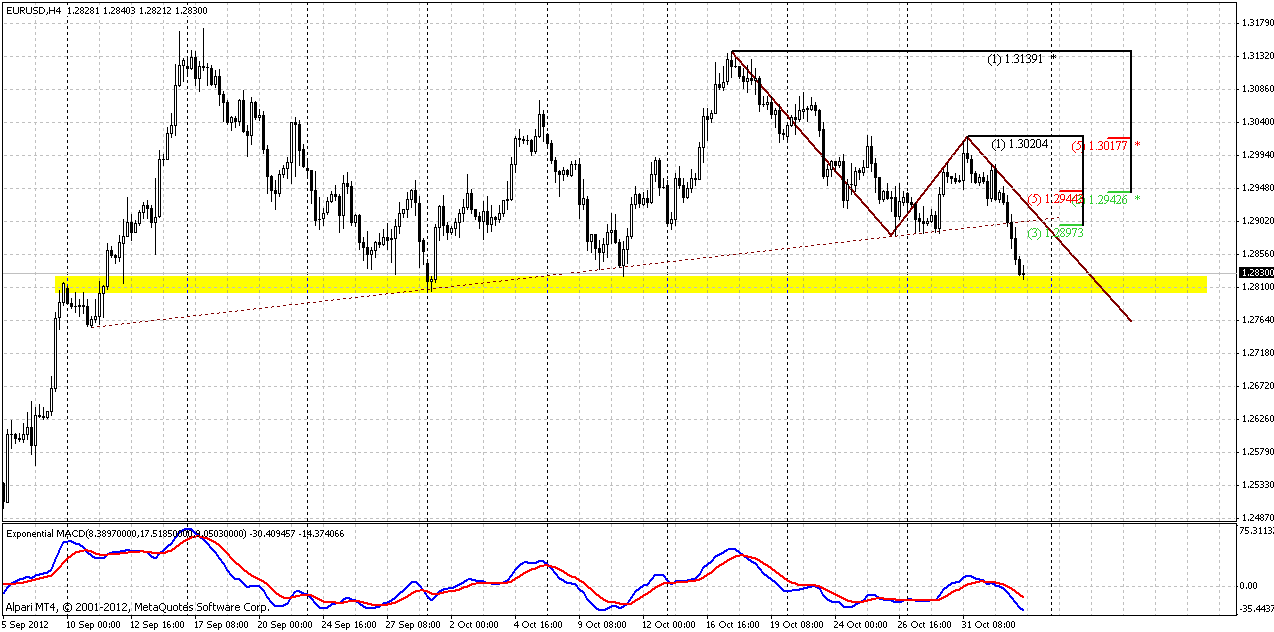
On the second chart we see a bit larger picture. Although market has broken the slope trend line that we’ve talked about, now it meets horizontal support zone. Also here you can see smaller AB-CD pattern that nevertheless has almost the same target as greater AB=CD. Still it could proceed to 1.27, since CD leg currenty is much faster than AB.
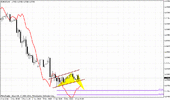
1-hour
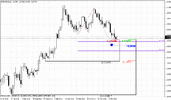
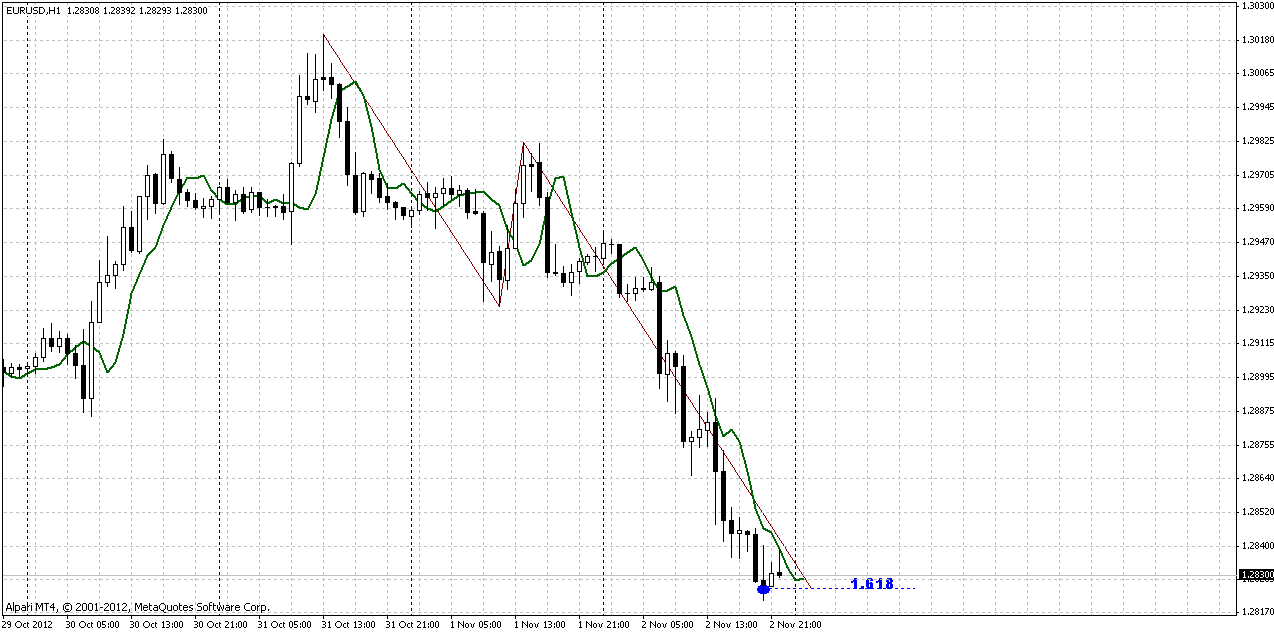
Here we see possibility for either DRPO “Buy” or B&B “Sell” pattern. Market has hit 1.618 extension of AB-CD pattern. So, pullback is possible. If it will be B&B pattern – that will be nice opportunity to enter short and join the downward movie. In the same manner DRPO Failure could be used.
Conclusion:
On long-term charts market shows thrilling price action, since it could lead to tremendous consequences.
Until we will get confidence with it, on daily time frame in the beginning of the week we should be focused on AB-CD completion point and reaching Confluence support.
If market will give us chance to join this move – we can use it. This could happen by pullback on hourly chart that could be triggered by B&B “Sell” pattern or any other of this kind.
If we will get downward gap opening, probably it’s better to stay aside, since price will appear to close to significant support area.
The technical portion of Sive's analysis owes a great deal to Joe DiNapoli's methods, and uses a number of Joe's proprietary indicators. Please note that Sive's analysis is his own view of the market and is not endorsed by Joe DiNapoli or any related companies.
New month has started and at once has brought significant changes on monthly chart. Now it is clear that market has stuck in monthly Confluence resistance area 1.2934-1.3149. In current moment, looking at pullback outside of it, we can suggest that the first challenge was unsuccessful, but will follow the next one? We can’t exclude this absolutely. For instance, some sort of double bottom could be formed, or something like that, we don’t know. I prefer to talk about it stick to the subject, that we do not have yet.
What is more important for us is that definitely some downward move should come. Since this is monthly time frame, this move could be really significant. Even if we mostly trade on daily and intraday charts, we could get definite direction for long-term perspective. That’s why higher time frames are important.
Now, pay attention to MACD Predictor. November bar stands very close to it, and by November open price trend has turned bullish. The trend breakeven point for current month is 1.2762. If monthly bar will close below this level we will get bearish stop grabber on monthly chart with minimum target – clearing of 1.2042 low. Since 1.2042 stands below 0.618 target of drawn AB=CD pattern, it’s a high probability that market will proceed to 1.17 area initially – target of AB=CD. 1.17 in turn, stands slightly lower previous long-term 2010 lows. Just imagine what will happen, if market will trigger stops below it. We easily could get achievement of our long term 1.15-1.16 target.
But let’s pass from one to another gradually. Our first task on monthly is to wait for November close. Let’s get stop grabber first and only after that will discuss other things.
Weekly
Here is almost the same chart as on previous week. Analysis that we’ve made on previous week is still relevant, so I’ve held most tools as it were on week before. There are still two things that give us assistance in understanding of situation here. First is gibberish bullish flag, second is harmonic swings.
Our suggestion about affectation of price action on breakout of flag now is getting confirmation from price. The price action that has followed to its breakout looks bearish. That is much like classical bullish trap, this is not the way how flag’s breakout should looks like. Probably we could adjust the line so that we have no breakout, but I suppose not in this time. This resistance is absolutely clear on daily time frame. The price return right back in the flag’s body tells that we should be ready for donward move, and this move on weekly time frame could be strong. Flag per se is amount of overlapping bars, some sort of indecision. Usually such stagnation is followed by acceleration. Previously we’ve suggested, based on failure breakout, that this acceleration should be bearish. Now we have more confidence with this assumption.
Finally, take a look at blue lines. They were cloned. Downward swings are cloned from initial swing down, while upward swings from first upward retracement. Take a look what a harmony! Yes, on second couple of swings, upward retracement was slightly smaller, but downward swing was either. If we count both of them from “correct” point (as it shown on the chart), then they will finish in the same point as actual swings. Now we have equal upward retracement completed. If we suggest that this harmony will continue further, market should show swing to ~1.15. When I’ve seen this number, I’m suddenly recalled our quarterly analysis that we’ve done in November 2011 where we said about long-term forecast 1.16.
https://www.forexpeacearmy.com/fore...pro-weekly-october-31-november-04-2011-a.html
So, may be now it looks not as impossible as it was couple weeks ago... Anyway, guys, I probably more gravitate to conclusion that bears overweight bulls right now.
Also pay attention that we have new Monthly pivot points, although they are almost the same as on previous month. Numbers in a right upper corner.
Daily
Trend holds bearish here. We have perfect downward development, even from theoretical point of view. Large AB=CD pattern has started as “222” sell model. After hitting of 0.618 minor extension (we’ve discussed it in daily updates), market has shown shallow retracement and has continued move down. Next destination point is 1.2750-1.2770 area that includes AB=CD target, daily Confluence support, daily overbought and WPS1 – thin green line on the chart. Thick lines are Monthly pivot levels.
Take a look that monthly pivot has not been touched yet and it coincides with WPR1 at current week. New barrier that has appeared is November pivot support 1 at 1.2794.
4-hour
Trend holds bearish here as well. To join the party we can use two potential levels. First one, that is more prefferable is 1.29 area – Fib resistance + WPP + previous lows. Next area is 4-hour Confluence resistance at 1.2945 area.
On the second chart we see a bit larger picture. Although market has broken the slope trend line that we’ve talked about, now it meets horizontal support zone. Also here you can see smaller AB-CD pattern that nevertheless has almost the same target as greater AB=CD. Still it could proceed to 1.27, since CD leg currenty is much faster than AB.
1-hour
Here we see possibility for either DRPO “Buy” or B&B “Sell” pattern. Market has hit 1.618 extension of AB-CD pattern. So, pullback is possible. If it will be B&B pattern – that will be nice opportunity to enter short and join the downward movie. In the same manner DRPO Failure could be used.
Conclusion:
On long-term charts market shows thrilling price action, since it could lead to tremendous consequences.
Until we will get confidence with it, on daily time frame in the beginning of the week we should be focused on AB-CD completion point and reaching Confluence support.
If market will give us chance to join this move – we can use it. This could happen by pullback on hourly chart that could be triggered by B&B “Sell” pattern or any other of this kind.
If we will get downward gap opening, probably it’s better to stay aside, since price will appear to close to significant support area.
The technical portion of Sive's analysis owes a great deal to Joe DiNapoli's methods, and uses a number of Joe's proprietary indicators. Please note that Sive's analysis is his own view of the market and is not endorsed by Joe DiNapoli or any related companies.