Sive Morten
Special Consultant to the FPA
- Messages
- 18,659
Fundamentals
This week was under sign of macro statistics, which adds more uncertainty in economy assessment as EU as US. As policy of ECB and Fed also stands not quite clear - it results a mix that confusing markets, makes it become nervous, that leads to volatility growth. As we said in videos - as we come closer to the end of financial year in November and closing of balance sheets, investors worry about final yearly performance as it was rather good till the last moment. Shares show 22% annual growth, gold is in outstanding performance as well. Everybody wants to fix this result. But suddenly, both assets collapsed as statistics was surprisingly bad. There was also some political noise of D. Trump impeachment and new piking in US/China long lasting soap opera.
Week has started with EU data. The euro fell to its lowest in two-and-a-half years against the U.S. dollar on Monday as concerns about euro zone growth weighed on the single currency, while the greenback benefited from seasonal demand and uncertainty arising from the U.S.-China trade war.
German annual inflation unexpectedly slowed for the third consecutive month in September, data showed on Monday.
“The German CPI print this morning was a little bit on the disappointing side,” said Bipan Rai, North America head of FX strategy at CIBC Capital Markets in Toronto.
Germany’s leading economic institutes have also revised down their growth forecast for Europe’s biggest economy for this year, two sources with knowledge of their decision told Reuters on Monday.
The revisions, which feed into the government’s own output projections, reflect growing concerns that a slowdown in Germany driven by a recession in the export-dependent manufacturing sector could hamper the broader euro zone economy.
Demand for dollars heading into the last quarter of the year is also boosting the greenback.
“In Q4 we tend to see strong seasonal demand for the U.S. dollar, and given the fact that euro/dollar is the most frequently traded pair in the foreign exchange market, that certainly means that we could be seeing some further downside in the euro going forward,” Rai said.
Investors are also focused on the U.S.-China trade war, which is being blamed for slowing global growth.
President Donald Trump’s administration is considering delisting Chinese companies from U.S. stock exchanges, three sources briefed on the matter said on Friday, in what would be a radical escalation of U.S.-China trade tensions.
China warned on Monday of instability in international markets from any “decoupling” of China and the United States.
Uncertainty around the outcome of an impeachment inquiry into Trump may also provide safe-haven demand for the greenback.
Trump on Monday escalated his attacks against the lawmaker leading the impeachment inquiry against him, suggesting that Representative Adam Schiff be arrested for “treason.”
Next surprise has come from US. Worries about a slowing U.S. economy and the possibility of further interest rate cuts in the wake of weak U.S. manufacturing data kept the dollar pinned down on Wednesday, as investors sought safety elsewhere.
Data released overnight showed the U.S. manufacturing sector contracted in September to its weakest level in more than a decade and sent the greenback sharply lower from a more than two-year high.
The Institute for Supply Management had said its index of U.S. factory activity fell to 47.8, the lowest reading since June 2009. A figure below 50 signals the domestic factory sector is contracting.
“While the data... represented a negative surprise in the sense that it came in below consensus expectations, in other ways the industrial slowdown is not a surprise at all,” BNY Mellon analysts said in a note, pointing to Sino-U.S. trade tensions and signs of a slowdown around the world.
BNY Mellon said that while the Fed “stubbornly” feels rates are appropriate for an economy that continues to perform well, “it will ultimately have to accept that the pillars of support - the labor market and the consumer - are weakening.”
Next day ISM Services index also has brought negative surprise. Institute for Supply Management’s services sector index fell to 52.6 in September from 56.4 the previous month. Last month’s index was the lowest in three years amid rising concerns about tariffs.
It is important as investors fretted that weakness in both the U.S. manufacturing and service sectors signals a slowdown in the world’s largest economy. Expectations that the United States would continue to outperform other major economies and put pressure on the Federal Reserve to slow its interest rate cutting cycle were dampened this week after weak manufacturing and service sector surveys.
“It is clear the trend with most of the major U.S. data points are trending lower and it seems slowdown concerns have been confirmed,” said Edward Moya, senior market analyst at online FX broker OANDA in New York.
“While the service sector is still adding jobs, it is very apparent that we are no longer adding jobs at a strong pace and we will likely see further weakness in the service sector have a strong ripple effect in the coming months.”
Rate futures have factored in another 25 basis-point easing at the upcoming Federal Reserve policy meeting later this month following the manufacturing and services data weakness. Chances of a rate cut jumped to nearly 92.5% on Thursday from 77% on Wednesday.

Source: cmegroup.com
“It’s increasingly difficult for the hawkish members of the Fed to argue that what we’re seeing is a transitory disruption in the survey data,” said Ranko Berich, head of market analysis at Monex Europe in London.
The dollar has broadly gained in recent weeks as investors added long positions on expectations that other major economies, led by Europe, will underperform the United States. The latest futures data shows long dollar bets at a 3-month high.
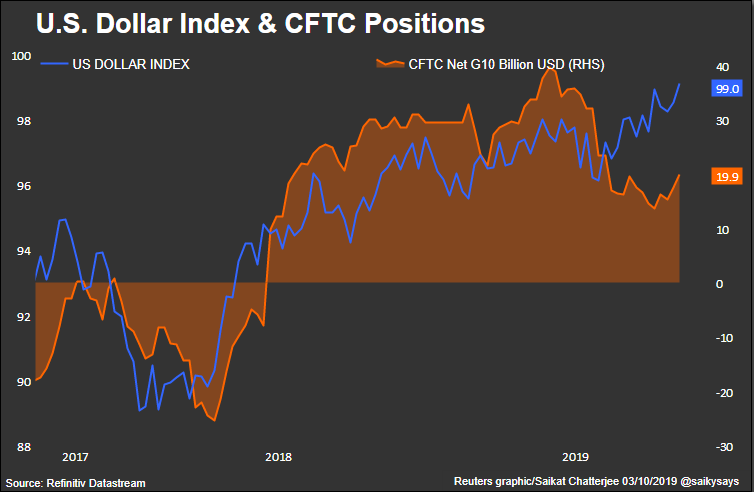
Speaking on EUR CFTC data directly, we do not have drastic reversal there. Net short position slightly increased but has not reached the new lows. But this is also the positive moment. It means that investors keep mostly the same judgement on EUR/USD rate, despite new inputs of this week.

Finally it was not everything good with NFP report. Resulting data, including upside revision of previous numbers was good, but wage inflation has dropped to 0% on MoM and to 2.9% from 3.2% on YoY basis, which has become another negative impact on Fed hawkish ambitions.
Data showed that U.S. nonfarm payrolls increased by 136,000 jobs last month. August data was revised
to show 168,000 jobs created instead of the previously reported 130,000 positions. Economists polled by
Reuters had forecast payrolls would increase by 145,000 jobs in September.
The unemployment rate dropped to a near 50-year low of 3.5%.
"Given that market expectations have shifted after the ADP (private payrolls) and ISM (manufacturing
and services), people were bracing for something worse than this. So this is in the ballpark of what is
acceptable," said Shaun Osborne, chief market strategist, at Scotiabank in Toronto. "But there are other issues here for the dollar aside from the Fed easing, such as the U.S. political backdrop. And we're still looking at the funding tightness issue," he added.
A drop in U.S. unemployment in September pushed traders of U.S. short-term interest rate futures on
Friday to pare bets the Federal Reserve will cut rates at both of its two upcoming meetings. The jobs data was initially a big relief to dollar bulls after two weak reports this week that heightened U.S. recession fears.
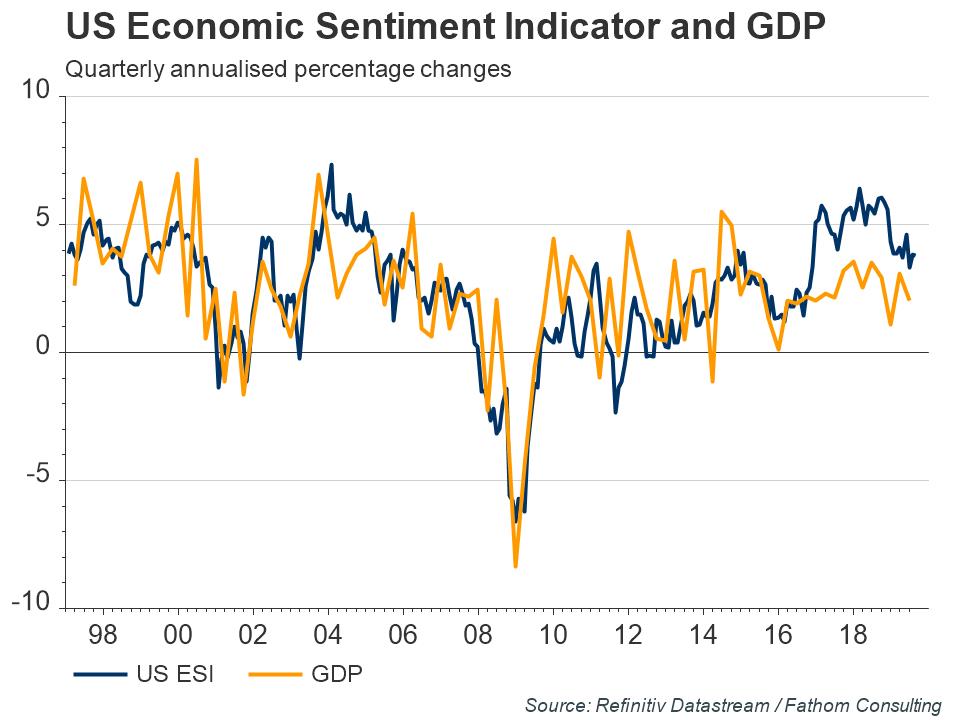
This week Fathom Consulting releases update on US Sentiment index for August, which shows that it still stands positive.
The August reading for Fathom’s US Economic Sentiment Indicator was 3.8%, as weakness in manufacturing continued to be more than offset by resilience elsewhere. Global activity remains sluggish and is set to get worse over the next year, with the manufacturing sector highly exposed. But the bigger picture is that sentiment in the US has appeared unusually high relative to domestic economic conditions for some time. We expect US GDP growth to soften over the next couple of years, while avoiding recession, eventually dragging down sentiment with it.
So, what do we have in dry result. The data was poor on both sides - as in EU as in US, but who has got more damage? Obviously US as its economy conditions was treated more positive just one week ago and no rate cut was on horizon. Now situation has changed. Of course, it is too early to talk about negative tendency as we have too few data to talk about the trend. Besides, Fathom points that drawdown in Manufacturing and Service conditions is normal thing in current global economical background, which is slowing down in general.
Mostly recent situation fits to our major suggestion - EUR/USD disbalance will hold but overall tendency could be interrupted by surprising breaks and spikes due to the kind of moments that we have now. Recent events are not strong enough to change the situation drastically but they could trigger some EUR/USD rate adjustment, i.e. retracement, in short-term. This is normal reaction and this is what we have right now, actually. Also we should not forget about emotional and psychological effect. Just few days ago everything was going well, but suddenly DJIA has dropped for 800 points in two days, awful statistics hits the markets and D. Trump was at the edge of impeachment. This shakes the boat, but currently we do not have fundamental reasons for changing major downside tendency on EUR/USD.
Still current driving factors' combination easily could trigger upside bounce on EUR/USD in short-term perspective. EU lays at the floor and hardly could become worse, while US background has got some new negative notes.
Technicals
Monthly
October starts with slow pullback. It makes no impact on overall picture, because it is still an inside session.
Technically it could be treated as continuing reaction on Yearly Pivot Support 1. As we've mentioned earlier - market right now stands at crucial area from technical point of view. This is the middle of the range and YPS1. Once EUR will break it - road to the bottom of the range around 1.03 area will be opened.
Overall tendency still stands moderately bearish, as by price action as by MACD trend. In September EUR forms new low, keeping "lower top - lower bottom" sequence.
As we've said earlier, here we could recognize downside narrow channel and market stands accurately inside of it.
Neither big support nor oversold levels stand around and it is free space till 1.03 lows. The only support is YPS1 and middle of the range. That's major technical support here.
Still, it seems that we will be focused more on intraday charts in nearest few weeks, watching for upside bounce due recent events that we've discussed above.

Weekly
We do not see big impact on weekly chart as well. The upper border of the channel stands around 1.1260 right now and until price stands below it - any action will be just a retracement with no impact on major tendency.
Market has to break out from current range to add something new as to monthly as to weekly time frames. As we've said last week, "acceleration" in any direction will have vital impact on the market. Usually when market tests the tension of the bulls, creeping slowly down - it lasts till the first signs of acceleration. Starting to the downside - It will be fatal for EUR and become the harbinger of collapse. Conversely upside acceleration easily could push EUR to the upper border of the channel.
Technically previous upward action was reaction on COP target, and downside action that we see right now should be continuation of major tendency to the next target, which is OP at 1.05 area. Now downward action is held by Yearly Pivot Support 1 and channel's border. Once response will be over, we will keep an eye on downside continuation. EUR has pretty much room to fluctuate inside the channel. To break the bearish context EUR has to climb above 1.14 top.

Daily
This week we've got first signs of pullback on daily chart. Once market has reached major extensions and 3-Drive "Buy" reversal point - EUR has shown the response. Still, Friday action has become inside one to the Thursday and market has not quite reached major K-resistance area, stopping somewhere between major levels.
Here we should understand one thing. If EUR indeed tends to show solid retracement - it should start with solid bullish reversal pattern. It means that at least 3-Drive target has to be reached above 1.1108 top initially. Otherwise, if market will stuck inside the range of last downside swing - this will be signs of weakness. So we should carefully watch how market will react on intraday support levels, and whether it will continue climbing up.
As we've said on Friday, initial upside reaction is done as EUR has completed minimal target of engulfing pattern here. So, some retracement in the beginning of the week is possible:

Intraday
Speaking on reliable reversal patterns, I mean big reverse H&S pattern here. If market will complete 3-Drive minimal target, it will hit the neckline and complete forming the head. This is minimal requirements that EUR has to fulfill to keep scenario of solid upside action. But now it is only on a halfway to final destination.

On 1H chart our suggestion of another spike was correct, although EUR still has not reached the XOP target. Here we do not have clear patterns. Price action around the top cares some signs of bullish dynamic pressure and looks like flag pattern, especially on 4H dollar index. It means that EUR could start climbing higher right from here as it cares accurately harmonic swings here and it could be large H&S pattern as we've said above. On 4H chart we also have bullish grabber, that suggests the same.
If still, EUR will start dropping, showing deeper retracement, we will keep an eye on patterns and major Fib levels:

Conclusion:
Although recent negative driving factors are not strong enough to change major downside tendency by far, in short-term perspective they have sufficient power to put the foundation for solid upside pullback to say the least.
Disclaimer
This FPA Investment Research is for information and education purposes only. Any decision to make any trade on the market has to be made solely by the reader. Information that is presented in research or its update is not an offer or call to make the trade on the financial markets and expresses just a personal opinion of the author who is might be wrong. Reader has to make decision on any trade solely and care all responsibility for results of this trade.
The technical portion of Sive's analysis owes a great deal to Joe DiNapoli's methods, and uses a number of Joe's proprietary indicators. Please note that Sive's analysis is his own view of the market and is not endorsed by Joe DiNapoli or any related companies.
This week was under sign of macro statistics, which adds more uncertainty in economy assessment as EU as US. As policy of ECB and Fed also stands not quite clear - it results a mix that confusing markets, makes it become nervous, that leads to volatility growth. As we said in videos - as we come closer to the end of financial year in November and closing of balance sheets, investors worry about final yearly performance as it was rather good till the last moment. Shares show 22% annual growth, gold is in outstanding performance as well. Everybody wants to fix this result. But suddenly, both assets collapsed as statistics was surprisingly bad. There was also some political noise of D. Trump impeachment and new piking in US/China long lasting soap opera.
Week has started with EU data. The euro fell to its lowest in two-and-a-half years against the U.S. dollar on Monday as concerns about euro zone growth weighed on the single currency, while the greenback benefited from seasonal demand and uncertainty arising from the U.S.-China trade war.
German annual inflation unexpectedly slowed for the third consecutive month in September, data showed on Monday.
“The German CPI print this morning was a little bit on the disappointing side,” said Bipan Rai, North America head of FX strategy at CIBC Capital Markets in Toronto.
Germany’s leading economic institutes have also revised down their growth forecast for Europe’s biggest economy for this year, two sources with knowledge of their decision told Reuters on Monday.
The revisions, which feed into the government’s own output projections, reflect growing concerns that a slowdown in Germany driven by a recession in the export-dependent manufacturing sector could hamper the broader euro zone economy.
Demand for dollars heading into the last quarter of the year is also boosting the greenback.
“In Q4 we tend to see strong seasonal demand for the U.S. dollar, and given the fact that euro/dollar is the most frequently traded pair in the foreign exchange market, that certainly means that we could be seeing some further downside in the euro going forward,” Rai said.
Investors are also focused on the U.S.-China trade war, which is being blamed for slowing global growth.
President Donald Trump’s administration is considering delisting Chinese companies from U.S. stock exchanges, three sources briefed on the matter said on Friday, in what would be a radical escalation of U.S.-China trade tensions.
China warned on Monday of instability in international markets from any “decoupling” of China and the United States.
Uncertainty around the outcome of an impeachment inquiry into Trump may also provide safe-haven demand for the greenback.
Trump on Monday escalated his attacks against the lawmaker leading the impeachment inquiry against him, suggesting that Representative Adam Schiff be arrested for “treason.”
Next surprise has come from US. Worries about a slowing U.S. economy and the possibility of further interest rate cuts in the wake of weak U.S. manufacturing data kept the dollar pinned down on Wednesday, as investors sought safety elsewhere.
Data released overnight showed the U.S. manufacturing sector contracted in September to its weakest level in more than a decade and sent the greenback sharply lower from a more than two-year high.
The Institute for Supply Management had said its index of U.S. factory activity fell to 47.8, the lowest reading since June 2009. A figure below 50 signals the domestic factory sector is contracting.
“While the data... represented a negative surprise in the sense that it came in below consensus expectations, in other ways the industrial slowdown is not a surprise at all,” BNY Mellon analysts said in a note, pointing to Sino-U.S. trade tensions and signs of a slowdown around the world.
BNY Mellon said that while the Fed “stubbornly” feels rates are appropriate for an economy that continues to perform well, “it will ultimately have to accept that the pillars of support - the labor market and the consumer - are weakening.”
Next day ISM Services index also has brought negative surprise. Institute for Supply Management’s services sector index fell to 52.6 in September from 56.4 the previous month. Last month’s index was the lowest in three years amid rising concerns about tariffs.
It is important as investors fretted that weakness in both the U.S. manufacturing and service sectors signals a slowdown in the world’s largest economy. Expectations that the United States would continue to outperform other major economies and put pressure on the Federal Reserve to slow its interest rate cutting cycle were dampened this week after weak manufacturing and service sector surveys.
“It is clear the trend with most of the major U.S. data points are trending lower and it seems slowdown concerns have been confirmed,” said Edward Moya, senior market analyst at online FX broker OANDA in New York.
“While the service sector is still adding jobs, it is very apparent that we are no longer adding jobs at a strong pace and we will likely see further weakness in the service sector have a strong ripple effect in the coming months.”
Rate futures have factored in another 25 basis-point easing at the upcoming Federal Reserve policy meeting later this month following the manufacturing and services data weakness. Chances of a rate cut jumped to nearly 92.5% on Thursday from 77% on Wednesday.
Source: cmegroup.com
“It’s increasingly difficult for the hawkish members of the Fed to argue that what we’re seeing is a transitory disruption in the survey data,” said Ranko Berich, head of market analysis at Monex Europe in London.
The dollar has broadly gained in recent weeks as investors added long positions on expectations that other major economies, led by Europe, will underperform the United States. The latest futures data shows long dollar bets at a 3-month high.
Speaking on EUR CFTC data directly, we do not have drastic reversal there. Net short position slightly increased but has not reached the new lows. But this is also the positive moment. It means that investors keep mostly the same judgement on EUR/USD rate, despite new inputs of this week.
Finally it was not everything good with NFP report. Resulting data, including upside revision of previous numbers was good, but wage inflation has dropped to 0% on MoM and to 2.9% from 3.2% on YoY basis, which has become another negative impact on Fed hawkish ambitions.
Data showed that U.S. nonfarm payrolls increased by 136,000 jobs last month. August data was revised
to show 168,000 jobs created instead of the previously reported 130,000 positions. Economists polled by
Reuters had forecast payrolls would increase by 145,000 jobs in September.
The unemployment rate dropped to a near 50-year low of 3.5%.
"Given that market expectations have shifted after the ADP (private payrolls) and ISM (manufacturing
and services), people were bracing for something worse than this. So this is in the ballpark of what is
acceptable," said Shaun Osborne, chief market strategist, at Scotiabank in Toronto. "But there are other issues here for the dollar aside from the Fed easing, such as the U.S. political backdrop. And we're still looking at the funding tightness issue," he added.
A drop in U.S. unemployment in September pushed traders of U.S. short-term interest rate futures on
Friday to pare bets the Federal Reserve will cut rates at both of its two upcoming meetings. The jobs data was initially a big relief to dollar bulls after two weak reports this week that heightened U.S. recession fears.
This week Fathom Consulting releases update on US Sentiment index for August, which shows that it still stands positive.
The August reading for Fathom’s US Economic Sentiment Indicator was 3.8%, as weakness in manufacturing continued to be more than offset by resilience elsewhere. Global activity remains sluggish and is set to get worse over the next year, with the manufacturing sector highly exposed. But the bigger picture is that sentiment in the US has appeared unusually high relative to domestic economic conditions for some time. We expect US GDP growth to soften over the next couple of years, while avoiding recession, eventually dragging down sentiment with it.
So, what do we have in dry result. The data was poor on both sides - as in EU as in US, but who has got more damage? Obviously US as its economy conditions was treated more positive just one week ago and no rate cut was on horizon. Now situation has changed. Of course, it is too early to talk about negative tendency as we have too few data to talk about the trend. Besides, Fathom points that drawdown in Manufacturing and Service conditions is normal thing in current global economical background, which is slowing down in general.
Mostly recent situation fits to our major suggestion - EUR/USD disbalance will hold but overall tendency could be interrupted by surprising breaks and spikes due to the kind of moments that we have now. Recent events are not strong enough to change the situation drastically but they could trigger some EUR/USD rate adjustment, i.e. retracement, in short-term. This is normal reaction and this is what we have right now, actually. Also we should not forget about emotional and psychological effect. Just few days ago everything was going well, but suddenly DJIA has dropped for 800 points in two days, awful statistics hits the markets and D. Trump was at the edge of impeachment. This shakes the boat, but currently we do not have fundamental reasons for changing major downside tendency on EUR/USD.
Still current driving factors' combination easily could trigger upside bounce on EUR/USD in short-term perspective. EU lays at the floor and hardly could become worse, while US background has got some new negative notes.
Technicals
Monthly
October starts with slow pullback. It makes no impact on overall picture, because it is still an inside session.
Technically it could be treated as continuing reaction on Yearly Pivot Support 1. As we've mentioned earlier - market right now stands at crucial area from technical point of view. This is the middle of the range and YPS1. Once EUR will break it - road to the bottom of the range around 1.03 area will be opened.
Overall tendency still stands moderately bearish, as by price action as by MACD trend. In September EUR forms new low, keeping "lower top - lower bottom" sequence.
As we've said earlier, here we could recognize downside narrow channel and market stands accurately inside of it.
Neither big support nor oversold levels stand around and it is free space till 1.03 lows. The only support is YPS1 and middle of the range. That's major technical support here.
Still, it seems that we will be focused more on intraday charts in nearest few weeks, watching for upside bounce due recent events that we've discussed above.
Weekly
We do not see big impact on weekly chart as well. The upper border of the channel stands around 1.1260 right now and until price stands below it - any action will be just a retracement with no impact on major tendency.
Market has to break out from current range to add something new as to monthly as to weekly time frames. As we've said last week, "acceleration" in any direction will have vital impact on the market. Usually when market tests the tension of the bulls, creeping slowly down - it lasts till the first signs of acceleration. Starting to the downside - It will be fatal for EUR and become the harbinger of collapse. Conversely upside acceleration easily could push EUR to the upper border of the channel.
Technically previous upward action was reaction on COP target, and downside action that we see right now should be continuation of major tendency to the next target, which is OP at 1.05 area. Now downward action is held by Yearly Pivot Support 1 and channel's border. Once response will be over, we will keep an eye on downside continuation. EUR has pretty much room to fluctuate inside the channel. To break the bearish context EUR has to climb above 1.14 top.
Daily
This week we've got first signs of pullback on daily chart. Once market has reached major extensions and 3-Drive "Buy" reversal point - EUR has shown the response. Still, Friday action has become inside one to the Thursday and market has not quite reached major K-resistance area, stopping somewhere between major levels.
Here we should understand one thing. If EUR indeed tends to show solid retracement - it should start with solid bullish reversal pattern. It means that at least 3-Drive target has to be reached above 1.1108 top initially. Otherwise, if market will stuck inside the range of last downside swing - this will be signs of weakness. So we should carefully watch how market will react on intraday support levels, and whether it will continue climbing up.
As we've said on Friday, initial upside reaction is done as EUR has completed minimal target of engulfing pattern here. So, some retracement in the beginning of the week is possible:
Intraday
Speaking on reliable reversal patterns, I mean big reverse H&S pattern here. If market will complete 3-Drive minimal target, it will hit the neckline and complete forming the head. This is minimal requirements that EUR has to fulfill to keep scenario of solid upside action. But now it is only on a halfway to final destination.
On 1H chart our suggestion of another spike was correct, although EUR still has not reached the XOP target. Here we do not have clear patterns. Price action around the top cares some signs of bullish dynamic pressure and looks like flag pattern, especially on 4H dollar index. It means that EUR could start climbing higher right from here as it cares accurately harmonic swings here and it could be large H&S pattern as we've said above. On 4H chart we also have bullish grabber, that suggests the same.
If still, EUR will start dropping, showing deeper retracement, we will keep an eye on patterns and major Fib levels:
Conclusion:
Although recent negative driving factors are not strong enough to change major downside tendency by far, in short-term perspective they have sufficient power to put the foundation for solid upside pullback to say the least.
Disclaimer
This FPA Investment Research is for information and education purposes only. Any decision to make any trade on the market has to be made solely by the reader. Information that is presented in research or its update is not an offer or call to make the trade on the financial markets and expresses just a personal opinion of the author who is might be wrong. Reader has to make decision on any trade solely and care all responsibility for results of this trade.
The technical portion of Sive's analysis owes a great deal to Joe DiNapoli's methods, and uses a number of Joe's proprietary indicators. Please note that Sive's analysis is his own view of the market and is not endorsed by Joe DiNapoli or any related companies.