Hi Sive,
Thanks again and again for your kind efforts.
I think there is some typing error on Fib support - suppose to be 1.3480, right?

Thanks and Best Regards
Hi Rashidin,
Yes it is. Thanks.
Hello Mr. Morten!
Uuf... It feels good to have a clear signal. Especially on higher time frames...
Two things bothers me from quite some time:
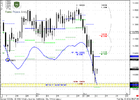
1. How do you chose your ABCs? Is there a rule or this skill develops in time? I was convinced that I have a preferable ABC on weekly, based on the initial thrust and retracement (chart attached).
2. How do you chose the time frame? I mean, for example, how do you say that the Confluence support is on Monthly. Why not on Weekly?
Thank you!
Georgeta.
Name is Ernest I am from Malta and have been following Sive since the very beginning. Let me try to answer your questions.
1. I suggest first of all your read the e book which Sive is building for us all in this same site. He covers the aspect of Fib Expansions and provides some rules. Having said that I still find problems myself of how to find the right points. So what I do I try quite a number and see which ones provide some areas of agreement. Am not sure if this is a correct method but it helps me at least. However I do really believe this aspect and skill can be better developed over time. If I remember correctly even Sive in his e book says this.
2.Confluence areas are derived by drawing Fib retracements from different points to a common high or a common low (usually). The drawing of these are also covered in Sive's e book and are more then amply recorded in Joe Dinapolis Book.
You can draw these Fib retracements in any time frame and finds confluence areas for each time frame. What is important is that a Confluence area created in the Monthly, Weekly Time frames are also relevant to the Lower Time Frames. So a Monthly K area providing for example support does not apply only to the Monthly Time Frame but provides Support for all lower time frames. In fact Sive suggests many a time in these reports that the higher Time Frame areas are more significant then Lower Time Frame areas.
Georgetta hope I have answered some of your queries an please do not think I am trying to be a big head. Just want to help if I can. Sive can review this answer and clip me over the ears if I am in any way overstepping myself or correct if I am incorrect.
Hi Ernest!
Thank you for your time and effort.
This is what separates us from Mr. Morten. He looks at the same chart and sees something more... That is why I asked the questions. So the questions remain:
1. Why Mr. Morten preferred to look at his ABC on Weekly? What is wrong with my ABC?
2. I understand that higher time frame confluence is significant for lower time frames. That is why I ask the question. How do we choose the time frame. Because if we have a confluence on Monthly, that is significant for all time frames. But if the confluence is on weekly, it is indifferent for the Monthly.
Good trading!
He certainly sees much more then any of us. However having been following his reports since inception I think I can at least try to explain his train of thought as opposed to what he sees.
Sive prepare his weekly reports for Monthly, Weekly etc. So you can choose to trade any Time Frame to trade. The time frame you choose to trade is not defined by the analysis but by yourself.
Sive gives us his analysis for most time frames so that he tries to provide his knowledge for as many traders as possible. 1 Hour Traders, 4 hour Traders, daily etc. In fact he issues a daily video to tell us what he expects to happen during the coming trading day. And in these videos he always asserts that we should read his weekly report to understand better and also makes many references to significant points found in Higher Time Frame Charts.
What is wrong with your ABC will not presume to answer. But as I said earlier time will develop this skill for us.
As to why he chose the weekly ABC in this report is because its destination points are highly significant for the coming weeks trading. Just as much as he mentioned the Monthly K Area for this weeks possible trading area.
So the Monthly and weekly provide the bigger picture with their significant points sometimes being away from current price action and sometimes they are close and therefore have to be considered.
So in conclusion the Time Frame you choose to trade is not defined by the analysis but by yourself.
Hello, Georgeta, Ernest
great discussion, btw. Ernest thanks, valuable add-ons though.
Let me add just my 2 cents.
1. About ABC's. There is nothing wrong with your ABC, Georgeta. It's just based on initial thrust down. I choose another ABC here, just because I need target from total consolidation on weekly time frame, that it is able to produce. So, your ABC is more for targeting inside the consolidation, while mine is more for forecasting a bit more extended levels. Both of them are valid, but a bit different. This comes with experience to choose particular ABC's. Just try to find the areas where initial thrusting move has happend, that predefined all other price action and you will choose correct ABC.
2. Speaking about time frames, Ernest is right. I call it "monthly" because reaction points could be seen on monthly chart. But this is not mean that this K-area is not significant on weekly. Usually K-area dedicates to some time-frame, where it could be seen for the first time. For exaple, you will not find it on annual chart, hence you can't call it as Annual K-Area.
Hi Sive,
I got burned badly on Wednesday and Thursday. Opened up a short order a bit too early twice no less and lost almost all of my gains for the past two weeks. I still wonder about the first one though. This has happened so many times it can not be coincidence. The stop put at 200 pips got hit with not even one pip to spare. And as usually it happened the 15 minutes I was not at my computer. As I said this can not be coincidence. A few weeks ago I opened a buy position on gold at 1875 with a stop at 1849.98 (I know strange choice) and a limit at 1898. Five hours later the price was at 1911 still I was stopped out at 1850.25 while the lowest price my broker gave for that period was 1850.15. That was not even close to 1849.98. Anyway beside the point.
My question. How confident are you that there will be at least a small retracement to the 1.3790 - 1.3810 area in the coming 2 days? I ask because after Thursday I was very cautious and closed my short positions around 1.3968. That means I made a small profit on them but it did not make up for my big losses. Friday I was afraid to open new shorts instead just before the market closed I opened two small long positions with as target 1.3790 and 1.3805 respectively. My reasoning being that after such a sharp fall and hitting such a strong area of support on monthly time frame a bounce, or retracement should happen, IF no further bad new from the Euro zone emerges over the weekend. You seem to indicate as much in your Daily time frame analysis for this coming week.
One last question while I'm at it. We are September. You mentioned earlier that future contracts are now for December. Could you please indicated if and when this is happening and when the spreads between your future prices and our spot price is different. At the moment it really looks like you are using spot prices. Thank you very much.
Hi Geert,
I had the same problems during my initial steps in trading. The major reason is that we can't separate major from the minor. Major is overall context - direction in which you have to trade.
You wrote:
My reasoning being that after such a sharp fall and hitting such a strong area of support on monthly time frame a bounce, or retracement should happen
It seems that there is a too much emotional action in your trading. In fact, trading is just your action in a row with what your analysis tells you. First you have to get a context - up or down. IF you have down context - you can't Buy, no matter expect you retracement up or not. IF context is down, you can use this retracement to sell the rally at better level, but not to buy.
First - context. How to creat it-that is a very large question.
Second - overbought/oversold analysis.
IF you have strong down context but you at oversold - you should wait. Since retracement could be significant. The same is for overbought.
Third - stop placement. Use significant levels to hide stops, not just money stops.
And the last thing - try to use strong areas of higher time frames to enter market, such as Confluence areas and/or Agreements
in a row with context. So, if even market will break it - on lower time frame it will respect it and you will have time to move your stop to b/e.
In our Forex Military School will be chapters dedicated to trading plan creating and multiple time frame analysis. I strongly suggest you to read them. And chapter about harmonic patterns - it could be useful for stop placing.
Hi Sive,
From your experience, what is the probability of a pair trading the monthly pivot point? I do see that the EURUSD has not yet traded this point (1.3424), which also coincides with a .618 retracement from current expected lows. Do you think this is something we can hope to see?
Hi Icarus. Theoretical probability is around 70-75%. But I prefer to see some steps from the market that will point at least on chances to reach it.
If I'll see forming of AB=CD with target around pivot, I start to think about reaching it, but not before that.
This is just my approach to markets - I try not to think about the scenarios that have no signs to happen yet.
Thanks for your work Sive
I learn a lot from your analysis every day.
I have a question, when you say "1.4140 is no more the Fib support", how deep the penetration on a fib level must be to invalidate it as support/ressistance?
It is not a close, obviously, as there as there is some weeks left for the bar to close.
Thanks a lot
Hi Fernando, there is no some sharp rule for that as "N-pips below or above the level". First, it depends on time frame. On 5-min chart levels are much tighter than on monthly time frame. Currenlty on monthly time frame we see that market has reached next Fib support area - so it is obvious that first suppot has been broken.
Sometimes, if market has some target slightly below fib support - it could penetrate it a bit just to reach it, but in such cases very often level continues to be actual. If market closes 3 during three periods below the level - this is one of the signs that probably level has been broken.
I suggest you to read corresponding chapters in our Forex Military School, that dedicated to support/resistance and Fib work.