FOREX PRO Weekly September 12-16, 2011

EUR/USD Daily Update, Wed, 14 September 2011

Good morning,

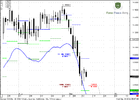
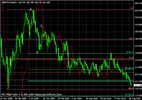
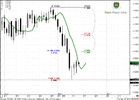
On daily time frame there is nothing really new, just one important thing - market has corrected oversold and actually has not barriers to continue move down. So we need to be aware of retracement finish.

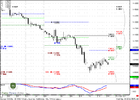
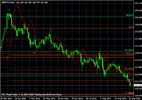
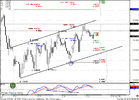
All major information on hourly chart. We see gradual move in parallel channel.
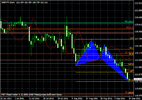
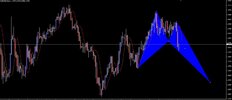
Upswings equals approx. 160-200 pips. Also we see that market forms multiple AB-CD patterns. The next target is 1.3750-1.3787. So, here two moments to watch:
1. If market will not reach it, reverse back and touch lower border - this is first sign that breakout is hear;
2. If market will take out 1.3550 area. In this case it will show downward breakout and erase all AB-CD's since C-point will be destroyed.

Be ready that market could show AB-CD retracement after breakout. This is very common for channels.

Currently I suspect that market hardly will reach 1.618's targets around 1.3850 area, since the way of behavior a bit different. But still we can't exclude that, especially if market will show upward break of channel and some upside acceleration.
 

Attachments

  • EUR_D_14_09_11.PNG
    EUR_D_14_09_11.PNG
    42.1 KB · Views: 266
  • EUR_4H_14_09_11.PNG
    EUR_4H_14_09_11.PNG
    41.8 KB · Views: 265
  • EUR_1H_14_09_11.PNG
    EUR_1H_14_09_11.PNG
    45.5 KB · Views: 273
I atached again the chart showing exactly A, B, C, D points which I used.
What do you think? There is a perfect equality beetwen two descending corections.
If I look from this perspective, the move on EUR/USD in next days will be up at least till 1.40 (psichological rezistence level).
What do you think about my AB-CD (it is apropriate to chose this AB-CD pattern in this chart configuration?) and about the probability to move up untill 1,40?
Thank you in advance for your reply.
 

Attachments

  • WEEKLY CHART-TARGET ACOMPLISHED.jpg
    WEEKLY CHART-TARGET ACOMPLISHED.jpg
    130.5 KB · Views: 250
I atached again the chart showing exactly A, B, C, D points which I used.
What do you think? There is a perfect equality beetwen two descending corections.
If I look from this perspective, the move on EUR/USD in next days will be up at least till 1.40 (psichological rezistence level).
What do you think about my AB-CD (it is apropriate to chose this AB-CD pattern in this chart configuration?) and about the probability to move up untill 1,40?
Thank you in advance for your reply.

Hi oficiuljuridic,
The major rule of buiding extension is that "C point should be inside A-B swing".
On your chart C point is outside. Sometimes, C point could be outside, if you want to estimate additional support/resistance. But this could be applied only when C point is just slightly above/below A and is better to not appy it, at least till you get sufficient experience, dealing with Fib extensions.

The one thing, how my ABCD could be adjusted is by dropping to daily chart and move A point from the top to the downward thrusting bar, since real move has started from it. In this case you will get that target has been hit.
But since we've made analysis based on weekly chart - you do not see it on weekly.
Hope it helps.
 
Using Sive's Signal to trade Forex

Hi Sive,
Thanks for your Signal recommendation which i have always received as a newbie but i don't know how to use it to trade.
Kindly give tips on how to use this analysis to enter trade successfully.
 
gbpjpy

Hello Mr. Morten!
I keep tracking the gbpjpy. I think the price is heading to 1 resistance and agreement on weekly. The agreement is on my Daily chart, the small abc, but can be seen on Weekly.
Any chance of butterfly Buy on Daily? How do you think I should act in this situation? Wait for all trends turn to Bulish?
Thank you!
 

Attachments

  • gjw.gif
    gjw.gif
    23.5 KB · Views: 223
  • gjd1.gif
    gjd1.gif
    20.6 KB · Views: 221
  • gjd2.gif
    gjd2.gif
    20.3 KB · Views: 221
Last edited:
Sive, I have drawn a possible butterfly pattern on the weekly time frame - can you check my work, please?
 

Attachments

  • EURUSD.jpg
    EURUSD.jpg
    78.6 KB · Views: 196
Sive, I have drawn a possible butterfly pattern on the weekly time frame - can you check my work, please?

Hi Icarus.
Well, since Buttefly is reversal pattern - it should be "Butterfly" Sell on top.
On your chart - this is butterfly "Buy". But shape itself is correct.
 
EUR/USD Daily Update, Thu 15, September 2011

Good morning,

On daily time frame there is nice perspective for either DRPO "Buy" or B&B "Sell" patterns. That is what I particularly will be watch for. But probably, market will remain lazy till 20th of September 2-day FOMC meeting that probably will shake the markets. So, let's focus on intraday charts.

Our trading plan that was based on harmonic numbers has worked nice - market has hit predefined area and now turns to retracement. All that we could do is to continue trading inside the channel and keep an eye on potential breakouts - as to the upside as to the downside.

If breakout to the upside will happen - I probably will not enter Long, since 1.3850-1.3880 very strong resistance and that will be in a row with daily B&B Sell. In this case we should watch for sell signals on hourly chart.

Downward breakout, particularly 1.36 level, we can use to enter short, as we discussed yesterday - after breakout wait for AB-CD retracement back to lower border of parallel channel.

Till breakouts, if you want, you may trade to trade inside the channel - buy around 1.3650 target - 150-180 pips to the upside - around 1.3820, this will be upper border of the channel.
 

Attachments

  • EUR_D_15_09_11.PNG
    EUR_D_15_09_11.PNG
    41.5 KB · Views: 177
  • EUR_4H_15_09_11.PNG
    EUR_4H_15_09_11.PNG
    39.7 KB · Views: 177
  • EUR_1H_15_09_11.PNG
    EUR_1H_15_09_11.PNG
    47.5 KB · Views: 174
What constitutes a breakout?

Good morning,

On daily time frame there is nice perspective for either DRPO "Buy" or B&B "Sell" patterns. That is what I particularly will be watch for. But probably, market will remain lazy till 20th of September 2-day FOMC meeting that probably will shake the markets. So, let's focus on intraday charts.

Our trading plan that was based on harmonic numbers has worked nice - market has hit predefined area and now turns to retracement. All that we could do is to continue trading inside the channel and keep an eye on potential breakouts - as to the upside as to the downside.

If breakout to the upside will happen - I probably will not enter Long, since 1.3850-1.3880 very strong resistance and that will be in a row with daily B&B Sell. In this case we should watch for sell signals on hourly chart.

Downward breakout, particularly 1.36 level, we can use to enter short, as we discussed yesterday - after breakout wait for AB-CD retracement back to lower border of parallel channel.

Till breakouts, if you want, you may trade to trade inside the channel - buy around 1.3650 target - 150-180 pips to the upside - around 1.3820, this will be upper border of the channel.

Mr Sive,
What constitutes a breakout of a channel? On the hourly if you follow your channel on the chart we had an hourly close above the channel at 3820 and then sellers stepped in to take it back within the channel. Was that a breakout? Or does it need to run up to the 3880 level? Thanks in advance.

I think so, since market has not even reached the lower border and accelerated upward. Gradually we are approaching daily B&B "Sell"...
 
Back
Top