IvanGlobalPrime
Company Representative
- Messages
- 36
Find my latest market thoughts
Commodity-Linked Currencies Keep Attracting Demand Flows
The market continues to trade on the basis of the NCoV. News of a follow-through in the treatment of the virus, even if the details raise more questions than answers, led to a re-invigoration of the risk appetite, with the commodity-linked currencies, once again, the main beneficiaries. The moves were tantamount to what we saw earlier on Tuesday. Keep reading to stay in sync with the context at play.
The Daily Edge is authored by Ivan Delgado, 10y Forex Trader veteran & Market Insights Commentator at Global Prime. Feel free to follow Ivan on Twitter & Youtube weekly show. You can also subscribe to the mailing list to receive Ivan’s Daily wrap. The purpose of this content is to provide an assessment of the conditions, taking an in-depth look of market dynamics - fundamentals and technicals - determine daily biases and assist one’s trading decisions.
Let’s get started…
Quick Take
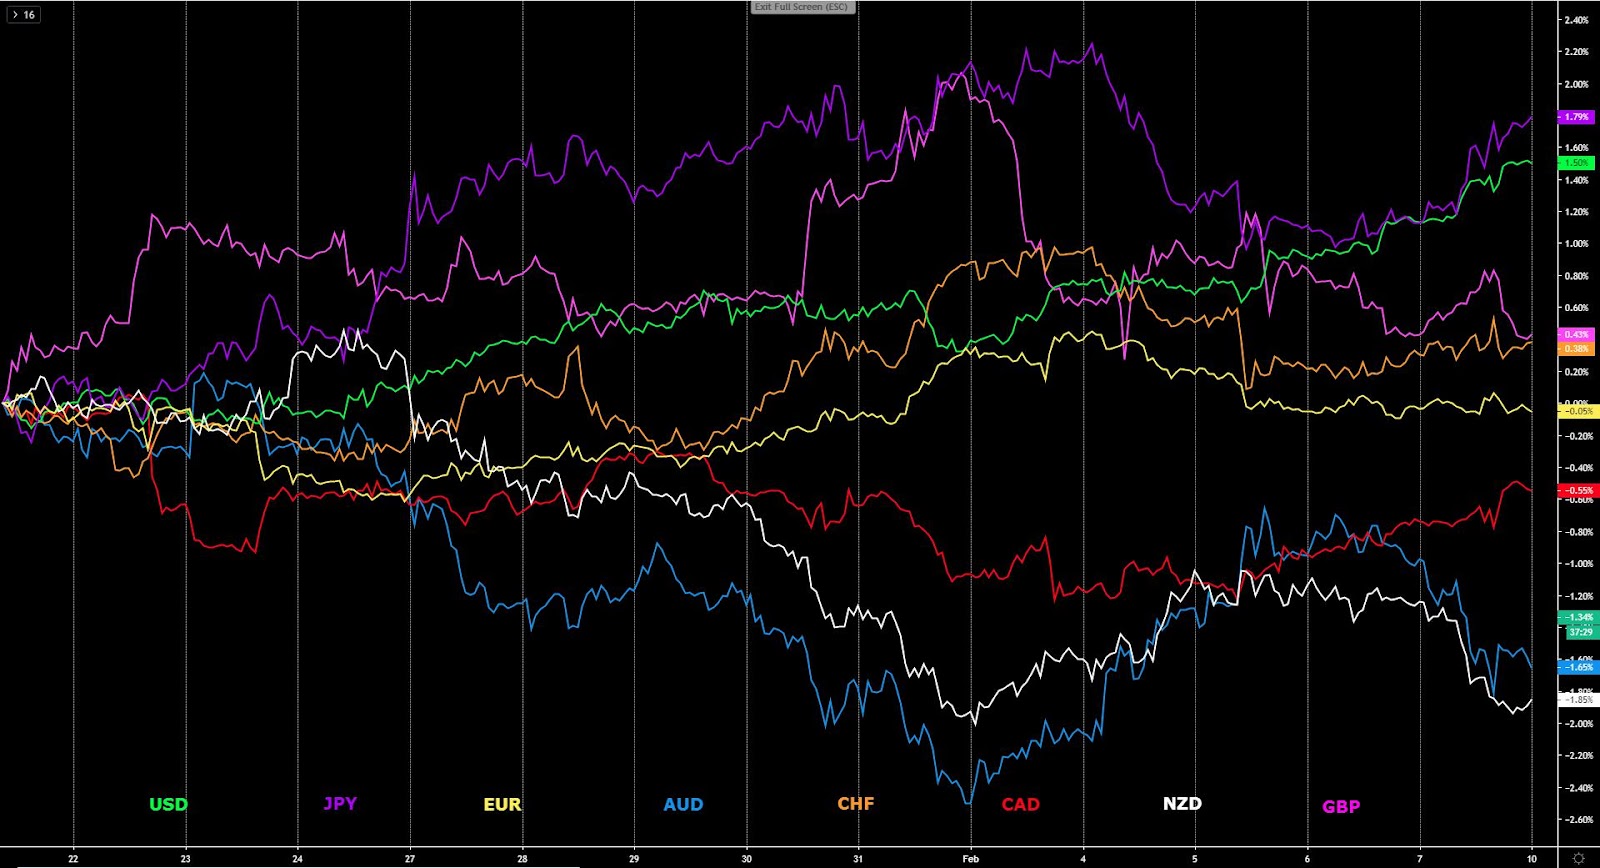
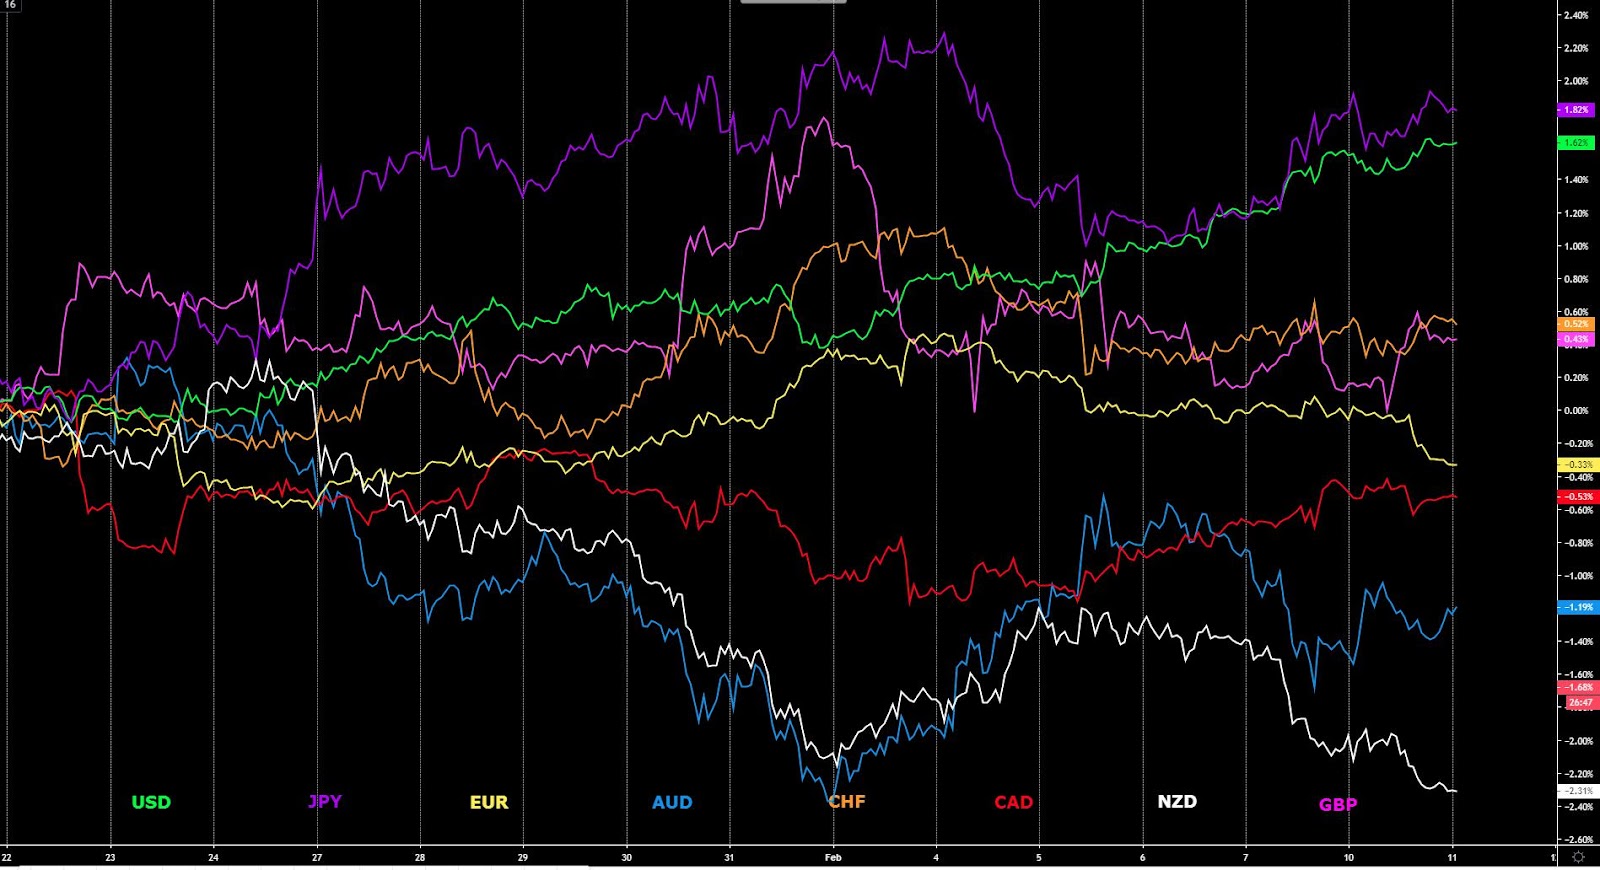
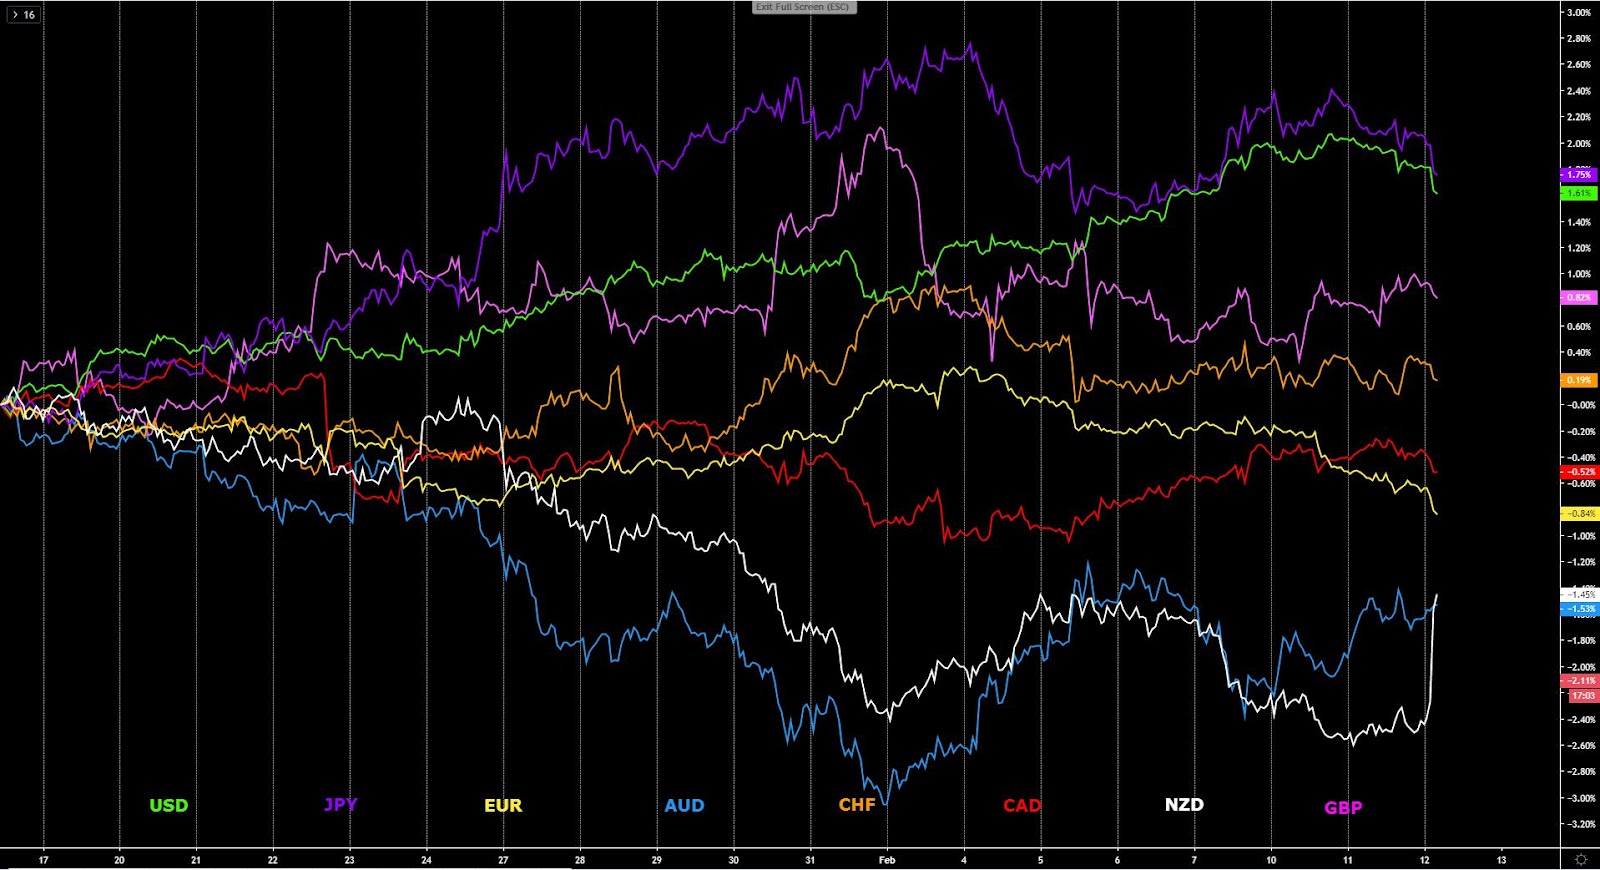
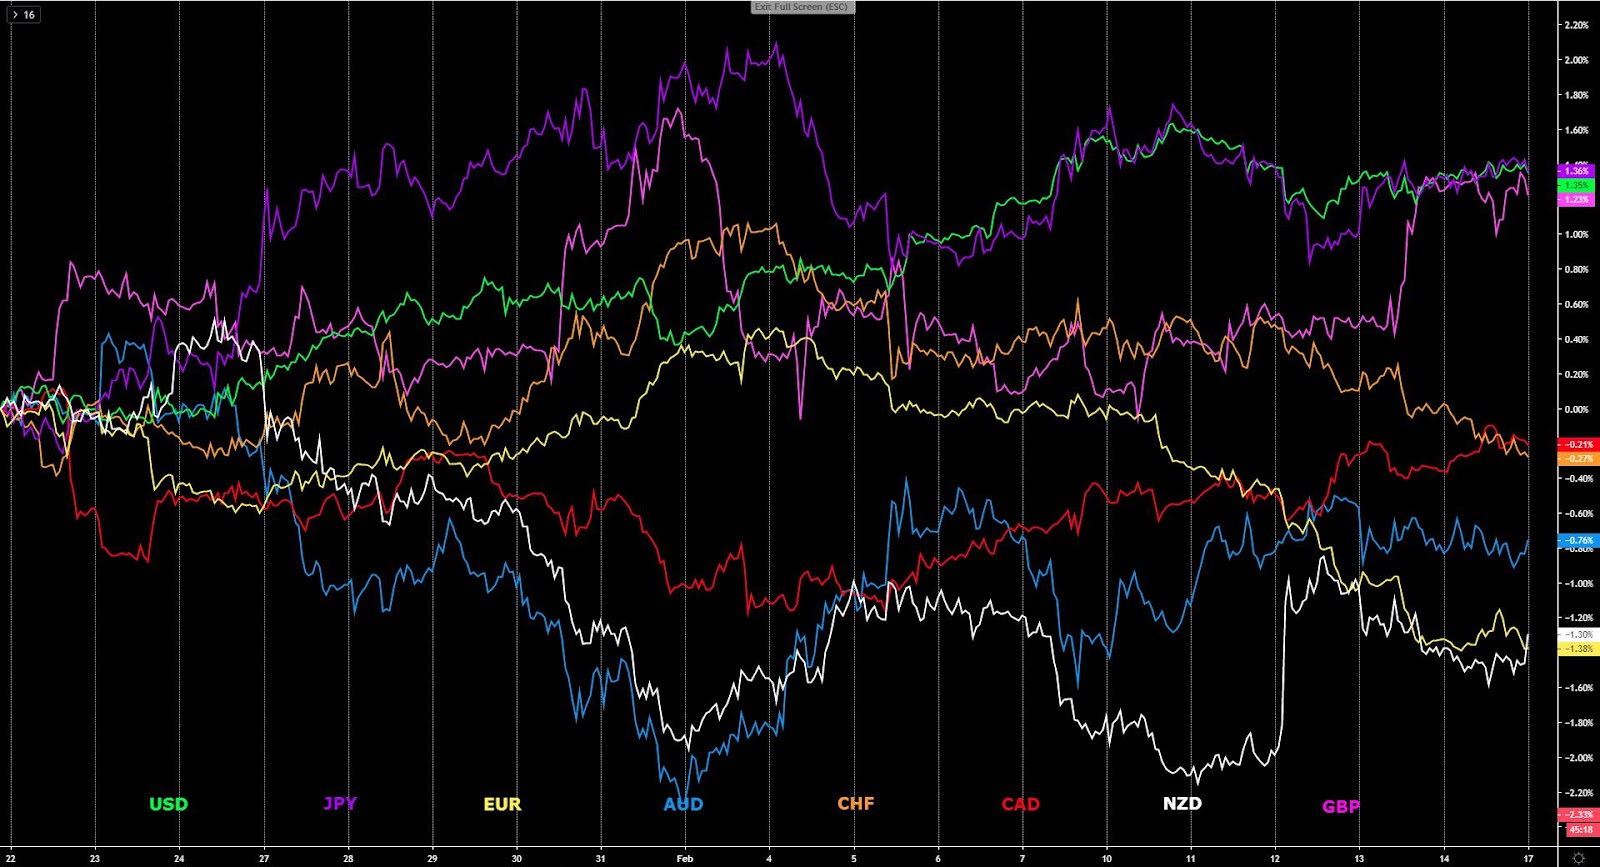
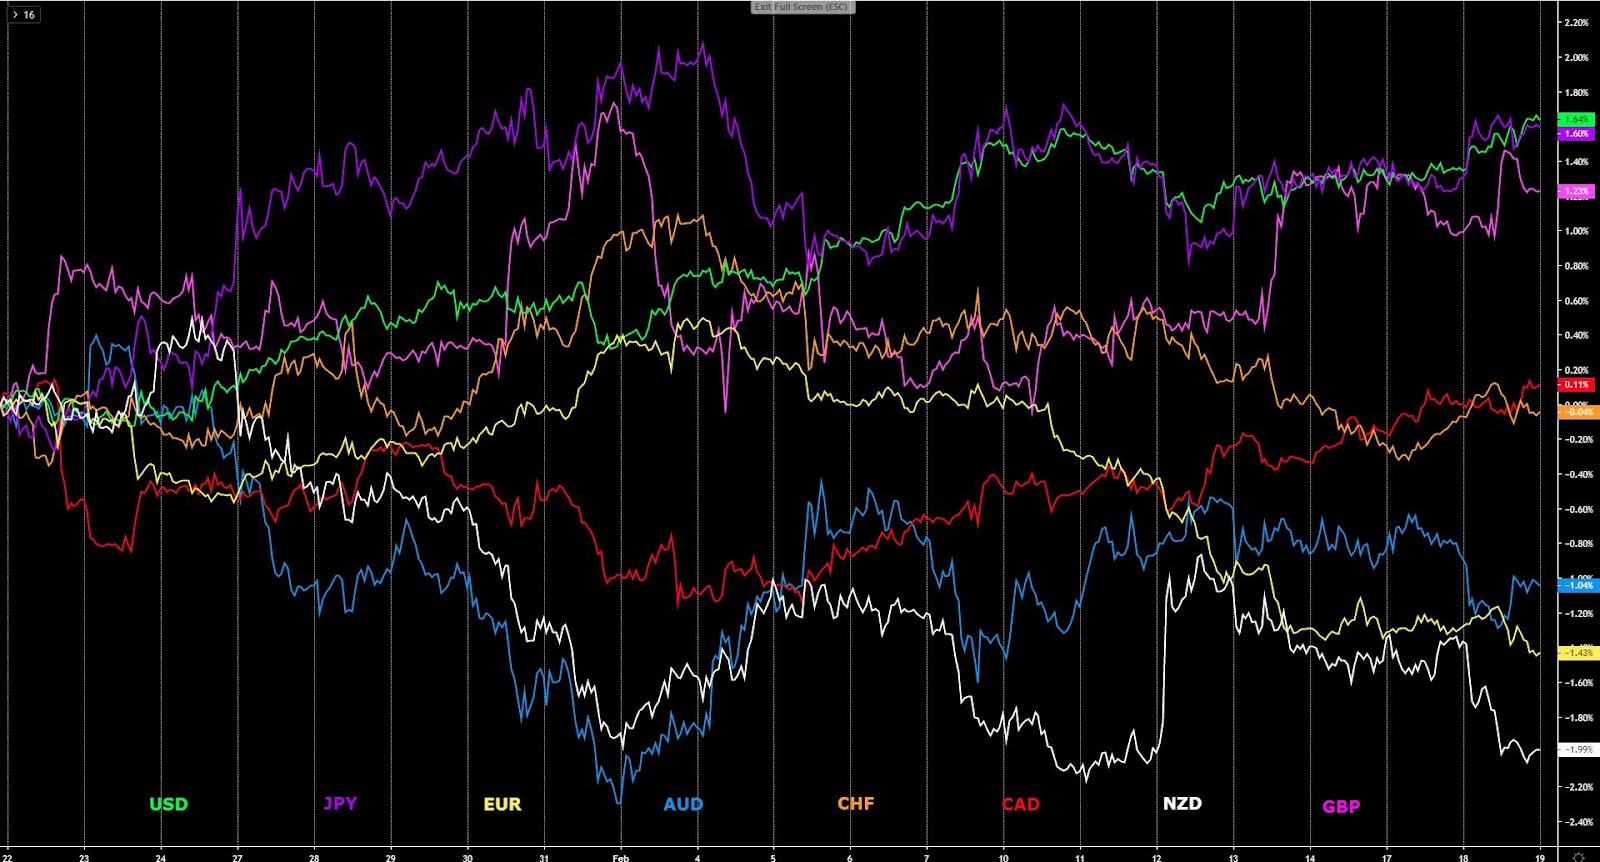
Another very strong performance by risk assets, almost analogous to the price action script seen in the prior 24h, with equities flying higher and fixed-income (bonds) dumped. The in-sync reinvigoration in these two asset classes wreaked havoc the Yen or Swissy, even if as I distill in the study of the G8 FX indices, gain further exposure to safe-haven currencies’ short inventory carries a heightened level of risk given the NCoV context we are in. By the same token, it should be troublesome that the market has bought up risk in dubious headlines about a breakthrough in the treatment of the virus, while shrugging off the factual and worsening details of a steady increase in the number of cases and death toll. Whenever the market stops going down in bad news and overplays questionable bullish news, that’s a motive to be worried. A clear winner regardless of the risk dynamics, I must state, is the US Dollar. As the aggregate flows reflect, which I detail in the charts section, it’s finally gunned through a key resistance, which opens the door to fresh bullish dynamics as part of this newly found bullish leg. US data aided the rise. The Euro, despite better EZ services PMIs, has kept the downside pressure, with an intervention by ECB Chief Lagarde failing to stimulate the price action as all she did was to touch on old news that were well telegraphed in the last ECB policy meeting. The Pound remains in a position that lacks technical clarity with swings up and down without a clear bias. It goes without saying that amid this pick up in the risk vibes, the commodity-linked currencies (AUD, NZD, CAD) have fared the best, even if technically speaking, we are far from out of the woods just yet.
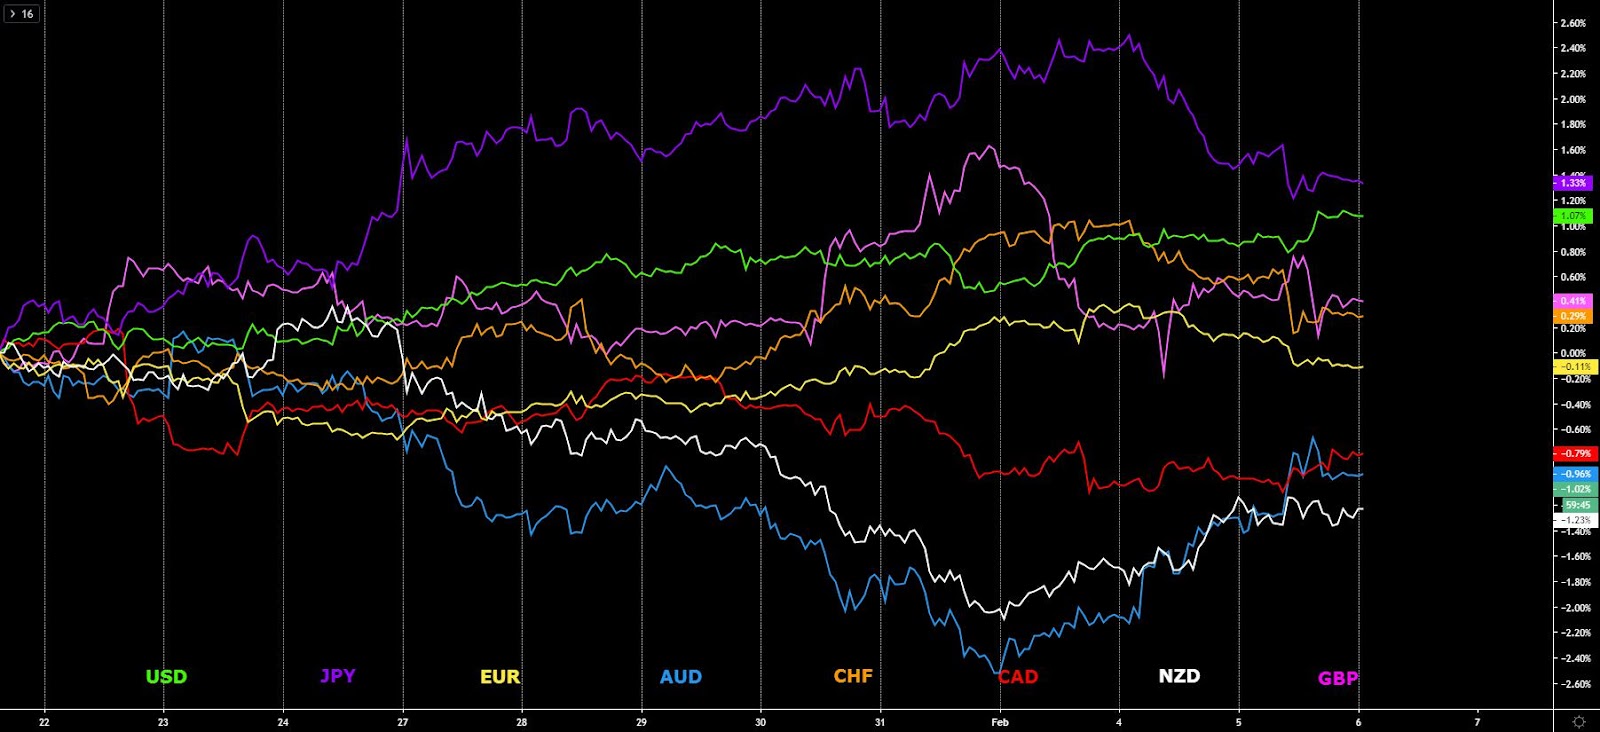
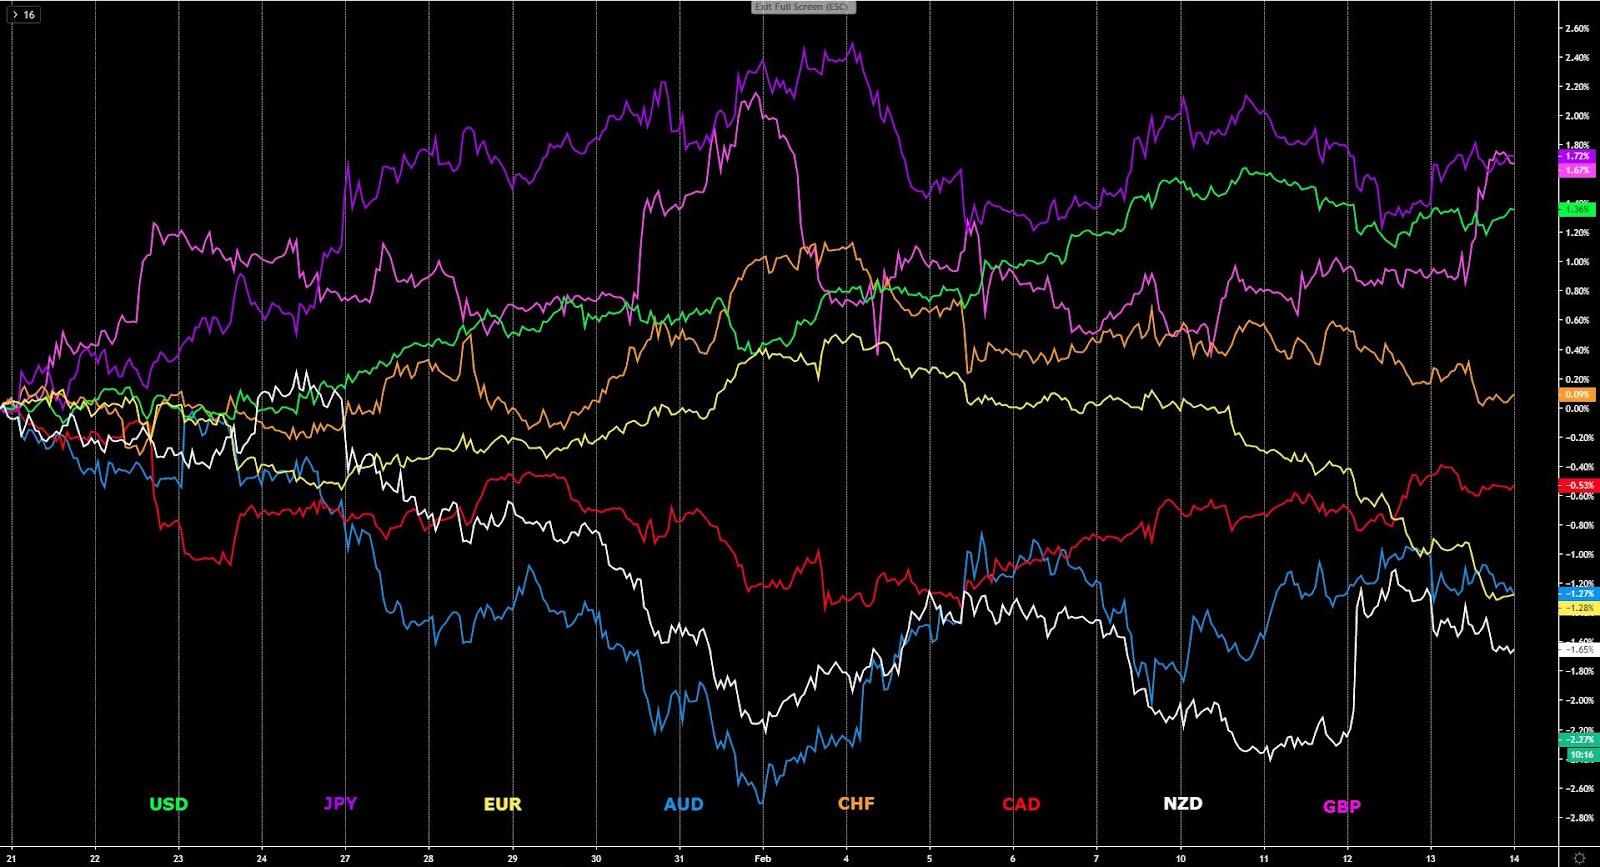
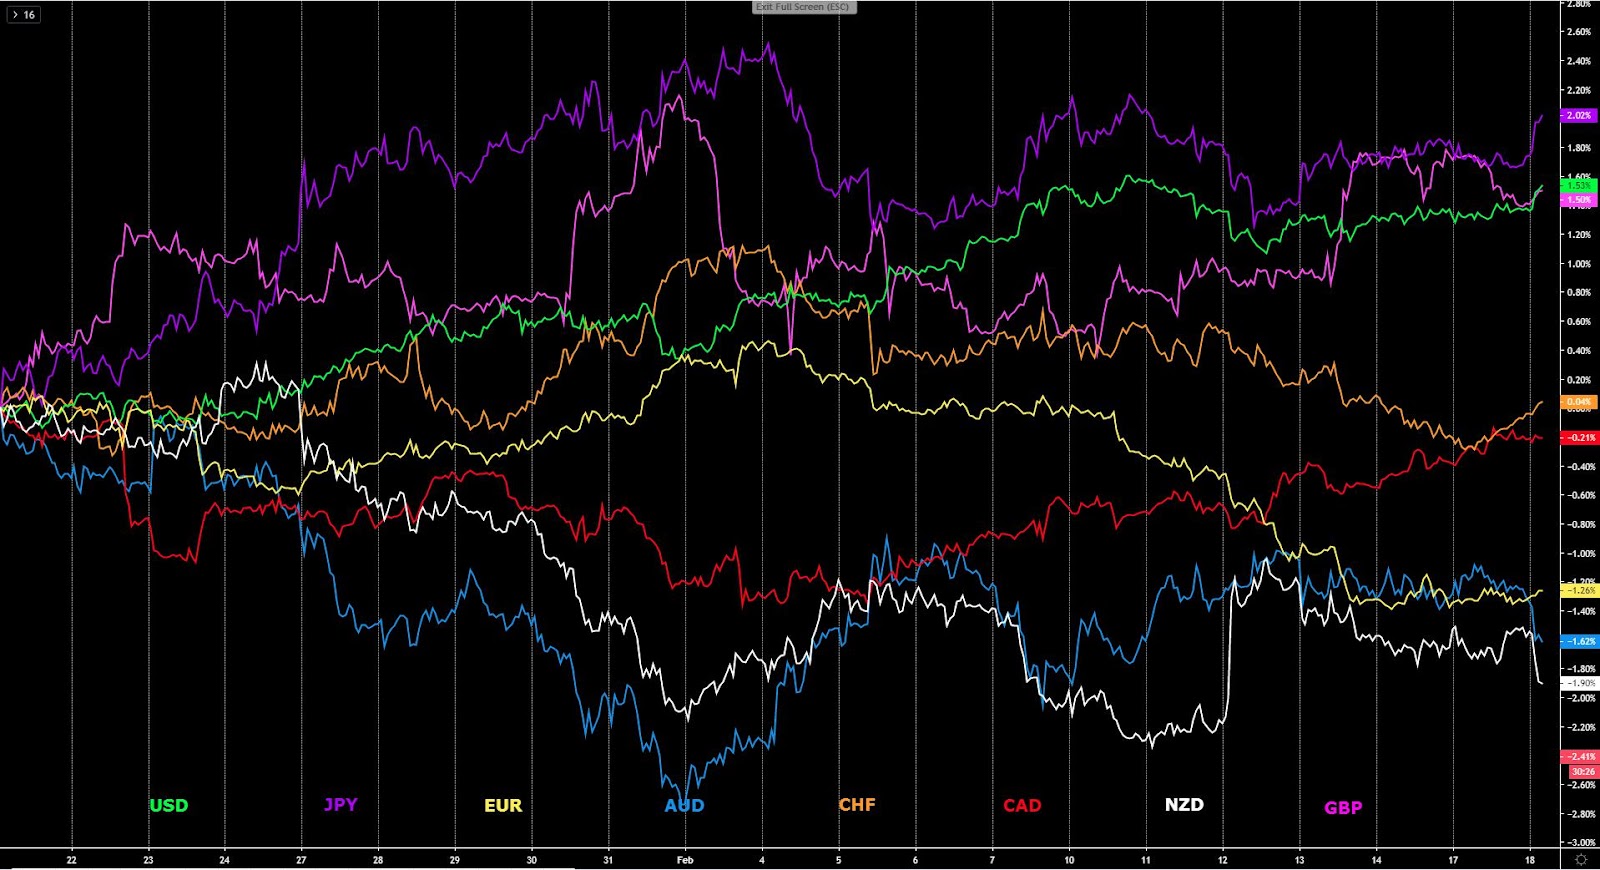
The indices show the performance of a particular currency vs G8 FX. An educational video on how to interpret these indices can be found in the Global Prime's Research section.
Narratives In Financial Markets
* The Information is gathered after scanning top publications including the FT, WSJ, Reuters, Bloomberg, ForexLive, Institutional Bank Research reports.
Relentless recovery in risk appetite: Once again, stocks and bond yields have ripped higher, leading to a further reduction in what’s known as the fear index (VIX) towards the 15.00 mark from a high of 20.00 last Friday. The bid risk-sensitive instrument caught is nothing short of extraordinary as the driver of the latest jump is found is a questionable piece of information about a drug that may cure the coronavirus. This is clearly a market that keeps defying rationale and is led by emotions and headline trading. But it also reflects a behavior that is starting to suggest the NCoV may be transient even if the new cases and the death toll, as reported by the Chinese government, keeps soaring.
Dubious breakthrough in NCoV acts as the trigger: The catalyst that led to the jump in stocks or the fall in Gold, the Swissy or the Yen, came after Sky News reported that UK scientists made a 'significant breakthrough' in race for coronavirus vaccine, and even if in the details it clearly states that the vaccine “may be close to being tested on animals first, and then humans based on funding available”, which may still take a few months. As part of what’s been interpreted as a breakthrough is the fact that it reduces the part of the normal development time from "two to three years to just 14 days".
China NCoV treatment news aids risk: Almost in synchronicity to the so called breakthrough above, another headline grabbed the attention of the market, this time the main source being growing chatter on social media, and later reported by news outlets such as pharmaceutical technology. China said it has found an effective drug to treat people with new coronavirus, citing the Chinese television, which attributes this other breakthrough to the research team at Zhejiang University has found an effective drug to treat people with the new coronavirus. The two drugs found, Abidol and Darunavir, may help treat patients infected with the new coronavirus, reported Changjiang Daily.
WHO cautious stance gets ignored: Even if the WHO, via a spokesman, stated that “there are no known effective therapeutics against this coronavirus” when asked about reports of possible treatment breakthroughs, the market shrugged off these comments with risk appetite well sustained throughout the day. Later on the day, the Director-General of The World Health Organization - who has been down-playing the pandemic for days - admitted that the last 24 hours saw the biggest surge in coronavirus cases worldwide since the crisis began. Again, the market has ignored the news.
China prepares more easing measures: China continues to show a firm stance in its fight to keep the mainland markets calm as further reports suggest China is preparing to issue more tax and fiscal measures to aid the fight against the coronavirus impact in order to ensure economic stability. As part of these measures, it is planning to support banks to offer lower rates on loans to smaller firms. This news comes after the draconian measures in the money markets via massive injections of liquidity.
Nothing news from Lagarde: ECB’s Lagarde gave a speech, with the transcript found here, where she outlined that short-term uncertainties are mainly related to global risks. Lagarde went on to say that risks include trade, geopolitical and now the coronavirus outbreak. Lagarde then stated that forward guidance on rates and asset purchases act as an effective automatic stabiliser, and that climate change will be a key part of this year’s ongoing strategy review at the helm of the ECB.
CAD boosted by BOC’s Wilkins: BOC Senior Deputy Governor Carolyn Wilkins delivered a speech titled "Our Economic Destiny: Written in R-stars?" at the Economic Club of Canada, in Toronto. The net effect in the CAD after the speech was positive. In it, she sounded more optimistic than expected, especially judging by the latest dovish tilt in the BOC policy statement. The policy maker said that Canada “has avoided secular stagnation and has a strong fundamentals including the central banks policy framework”. Wilkins went on saying that “Canada is well-positioned to avoid a long period of slow growth if the right steps are taken. On rates, she said that “lower neutral rate of interest rates means central banks have less room to stimulate the economy by cutting rates; central banks have 200 basis points less room to stimulate in the traditional way.”
Russia not supporting output cuts: The price of Oil also saw a round in line with the jump in risk assets, even if news broke out later on the day that Russia is not supporting a deeper output OPEC+ cut and instead it prefers and extension of the current pact, according to Reuters sources. It appears as though finding consensus among the cartel amid a slowdown in the consumption of demand via China is, as usual, in shaky grounds, with Saudi Arabia the one, as usual, willing to kickstart cuts.
GBP falls amid MiFID 2 rewrite talk: The Pound had a sharp dip from its high after news emerged that EU policymakers are reportedly taking aim at the City of London financial industry w/ a MIFID 2 rewrite. The MiFID 2 stands for Markets in Financial Instruments Directive, and is a legislative framework instituted by the EU to regulate financial markets in the bloc and improve protections for investors to ensure fairer, safer and more efficient markets and facilitate greater transparency for all participants via the standardization of practices across the EU.
Green shoots in EZ/UZ services PMIs: European services PMI data for January came better in Italy, while in France it disappointed a tad. However, in the engine of growth for Europe, that is Germany, it recorded an impressive 54.2, which was unchanged from the flash estimate but it confirmed the jump from the previous 52.9 in December. The Euro Zone services activity also vindicated its pick up, which plays into the view of a slightly more optimistic ECB when it comes to economic stabilisation. In the UK, the January services activity also increased at 53.9 from 52.9.
Strong data out of the US: We had two strong fundamental readings out of the US. First off, the ADP US January employment data came at +291K vs +158K expected, which to put things into perspective, represents the best print in about half a decade. Secondly, the January ISM non-manufacturing came slightly better at 55.5 vs 55.1 expected, with the comments as part of the report a bit more optimistic. For a full summary of the ISM report, it can be found here.
RBA retail sales disappoint: Australia Retail Sales for December came in at -0.5% m/m vs -0.2%, leading to an initial fall in the Aussie. In a way, this is an adjustment lower after the strong Nov figure, so the market was expecting a poor read, but not to such an extent.
If you found this fundamental summary helpful, just click here to share it!
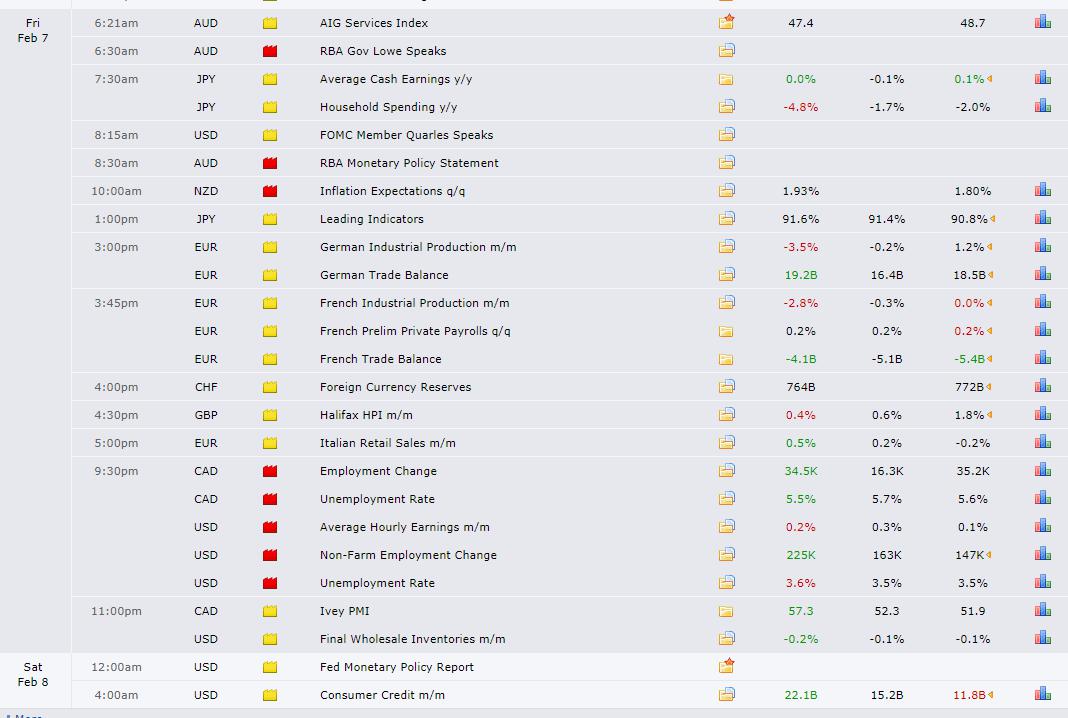
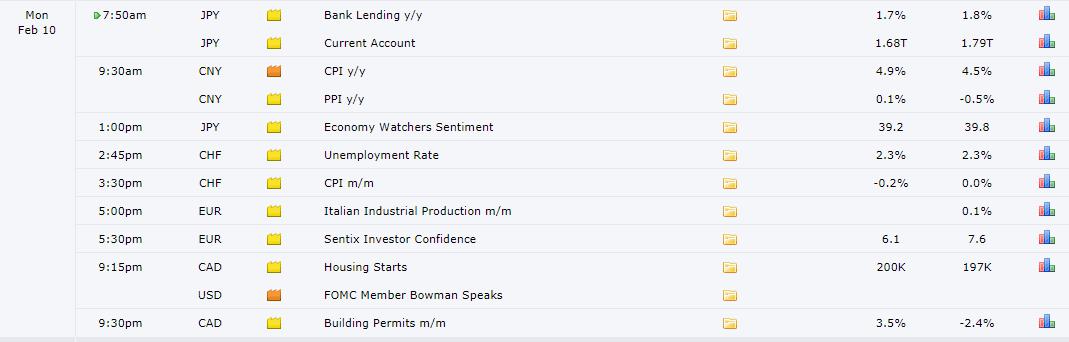
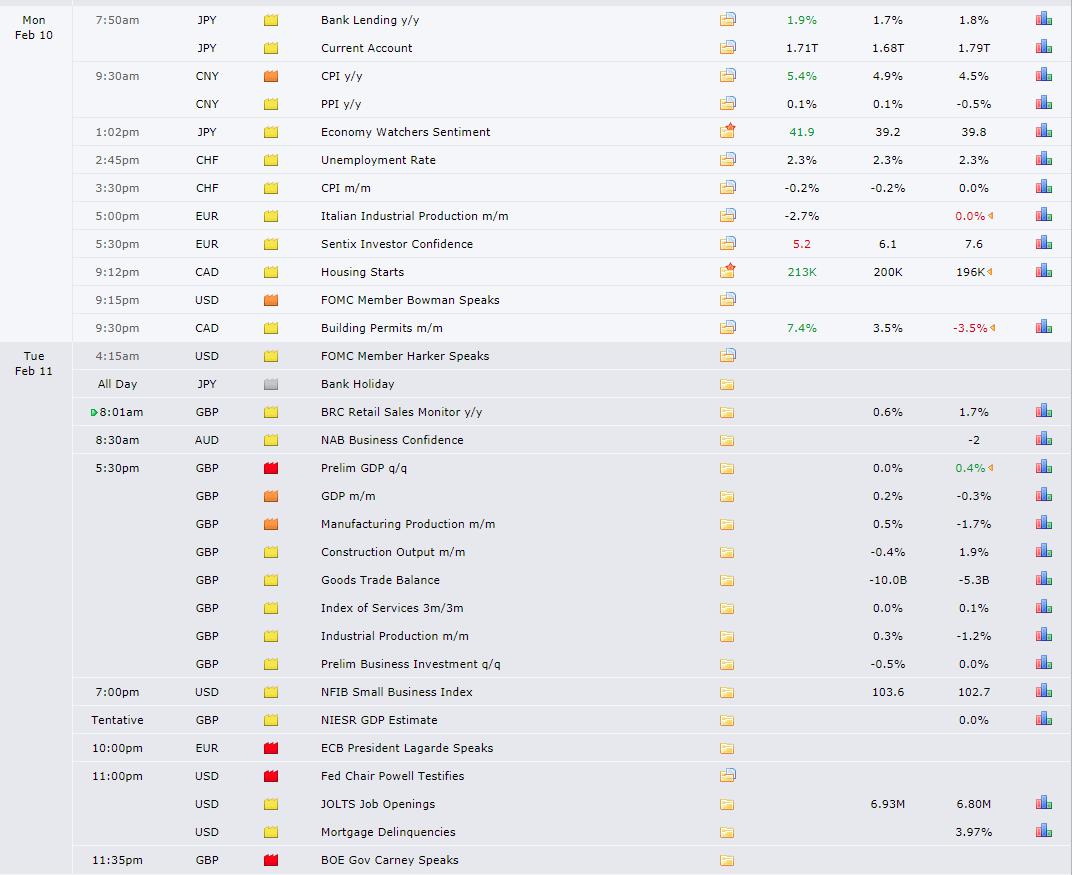
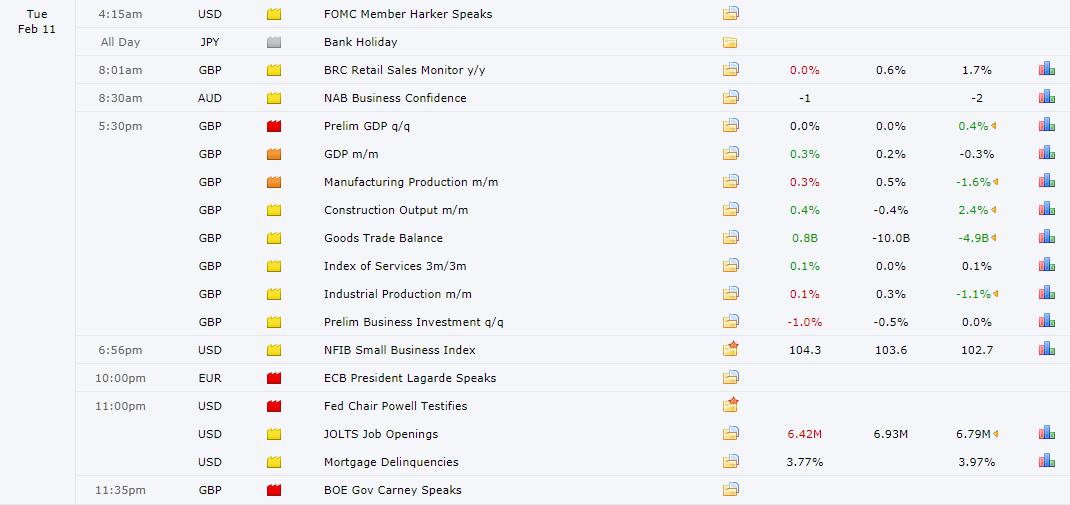
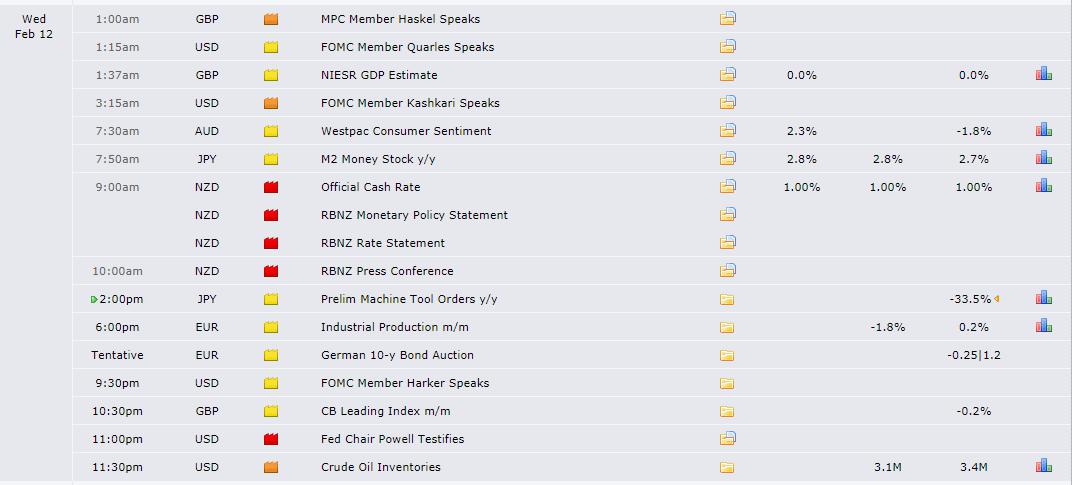
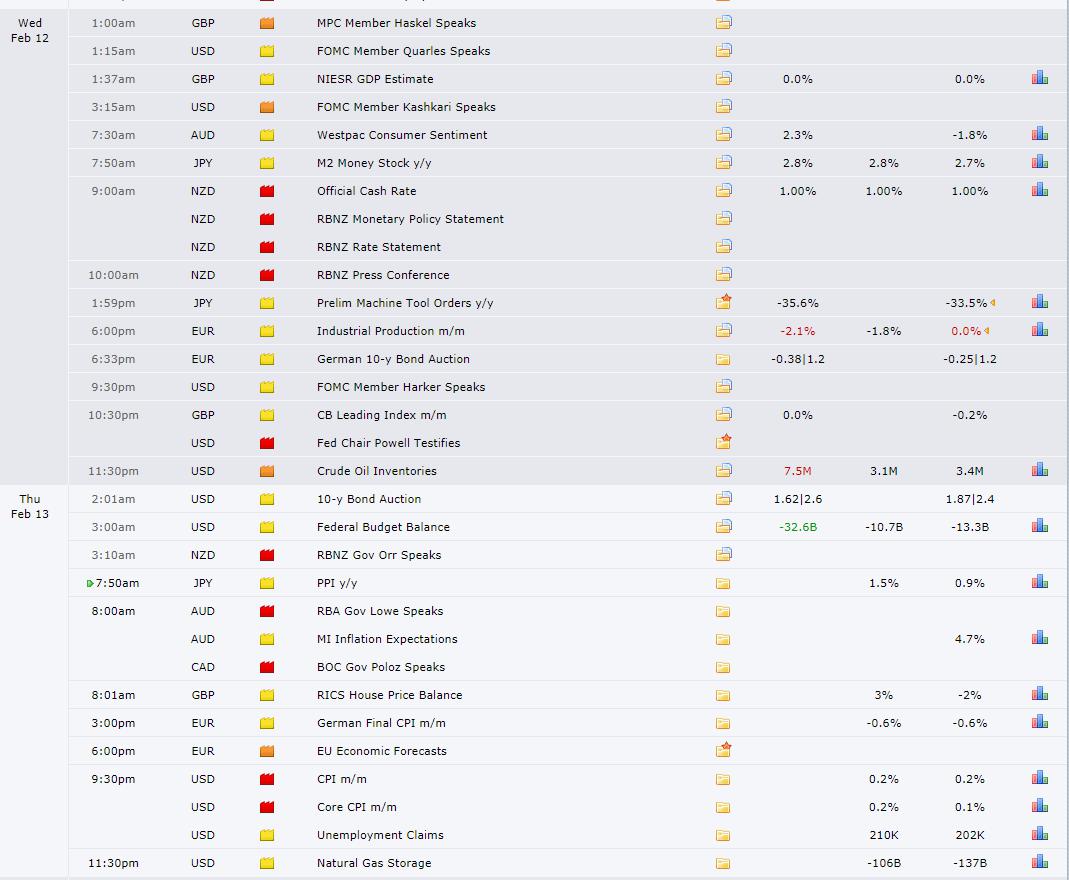
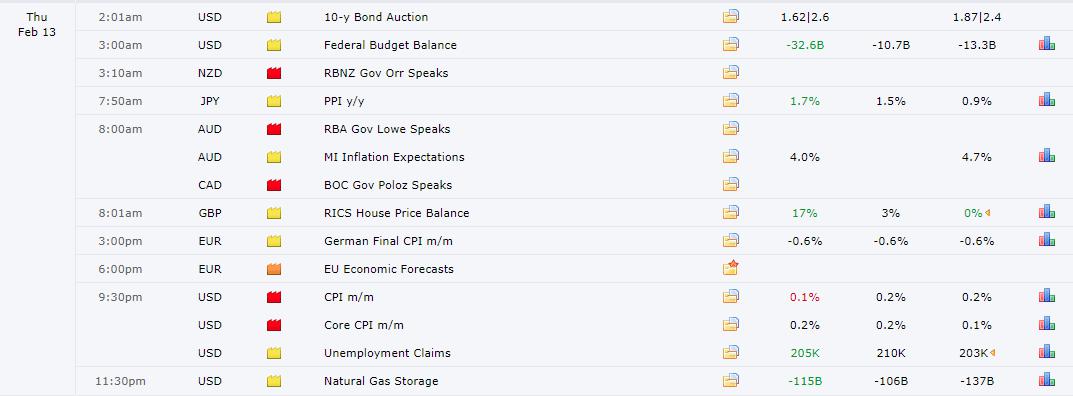
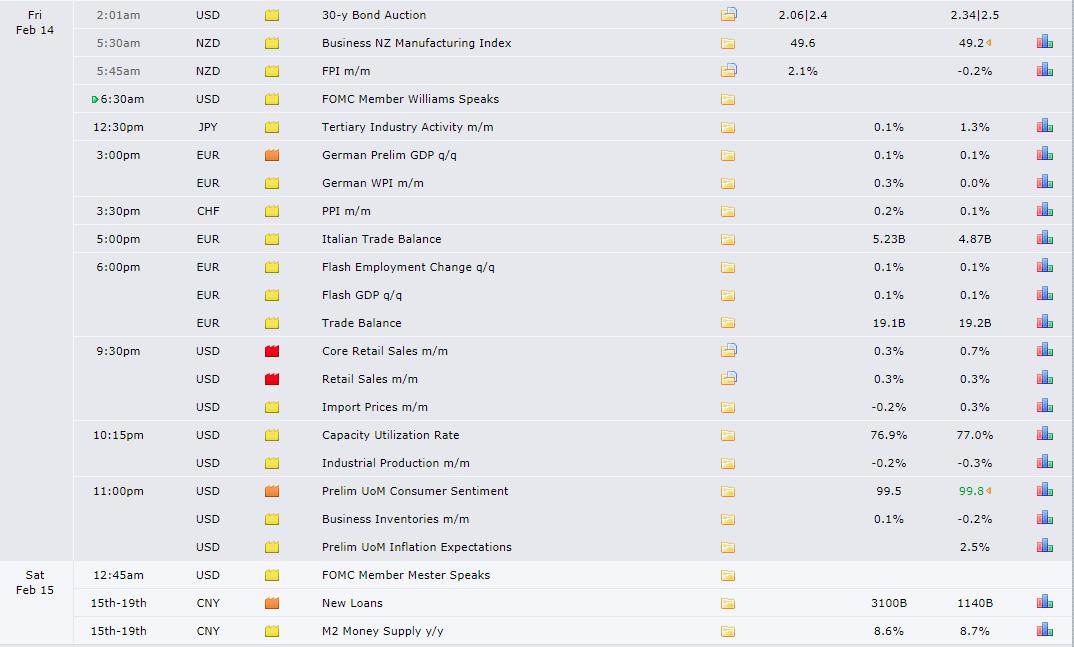
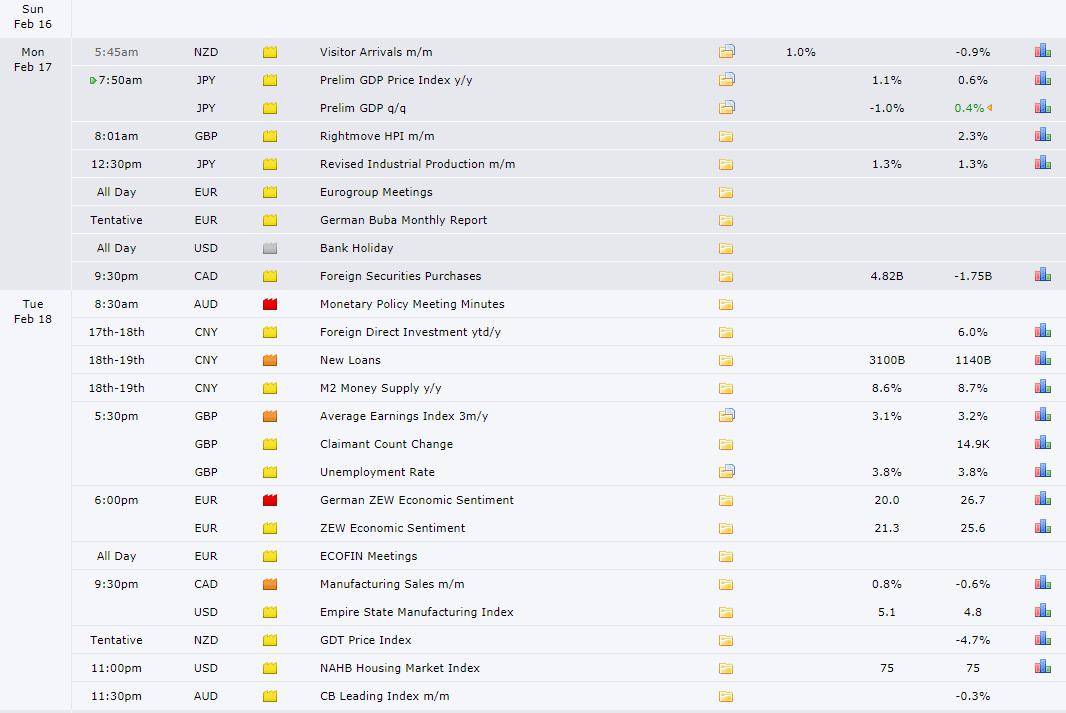
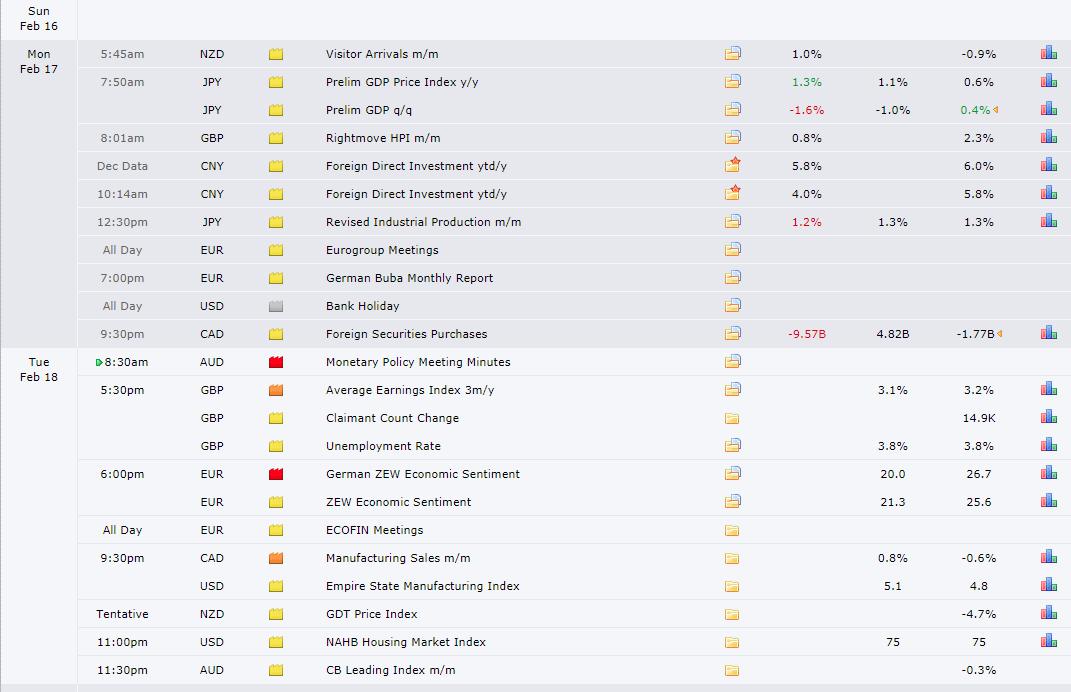
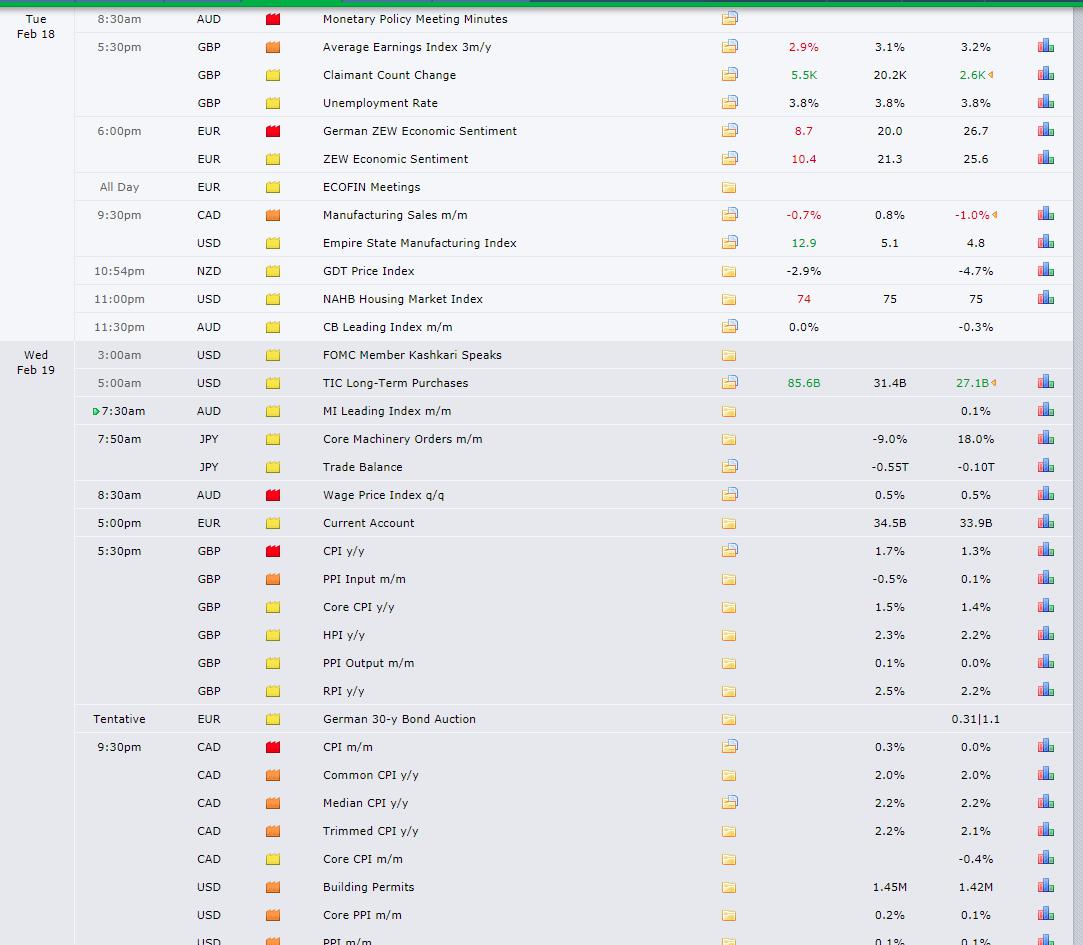
Recent Economic Indicators & Events Ahead
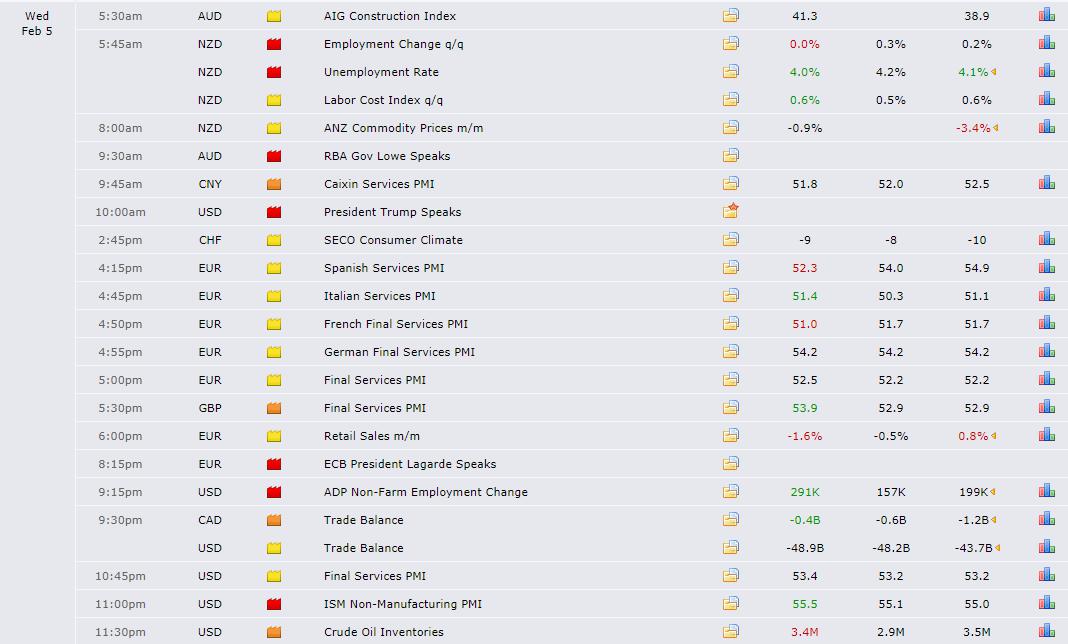
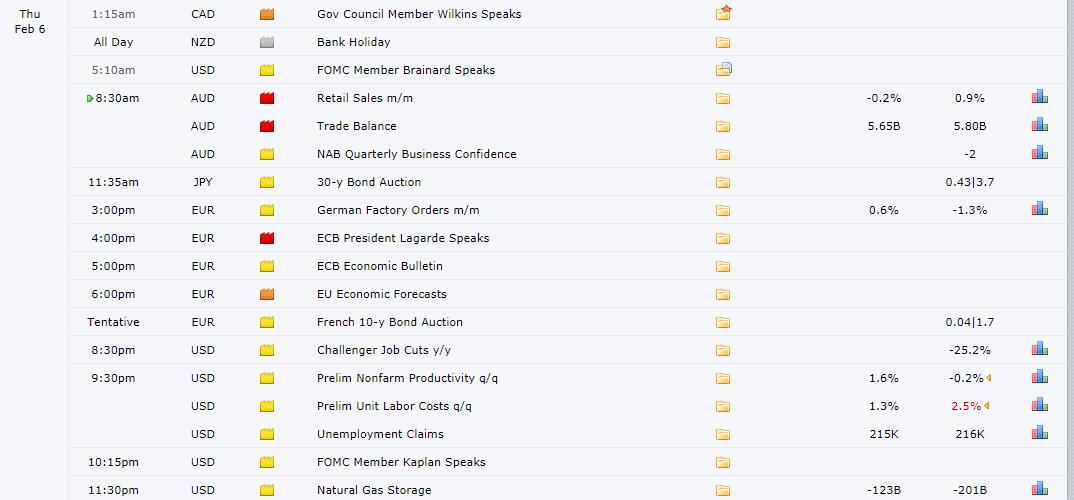
Source: Forexfactory
Insights Into FX Index Charts
The indices show the performance of a particular currency vs G8 FX. An educational video on how to interpret these indices can be found in the Global Prime's Research section. The idea of this analysis is to complement one’s daily bias by accounting for this holistic analysis.
If you found the content in this section valuable, give us a share by just clicking here!
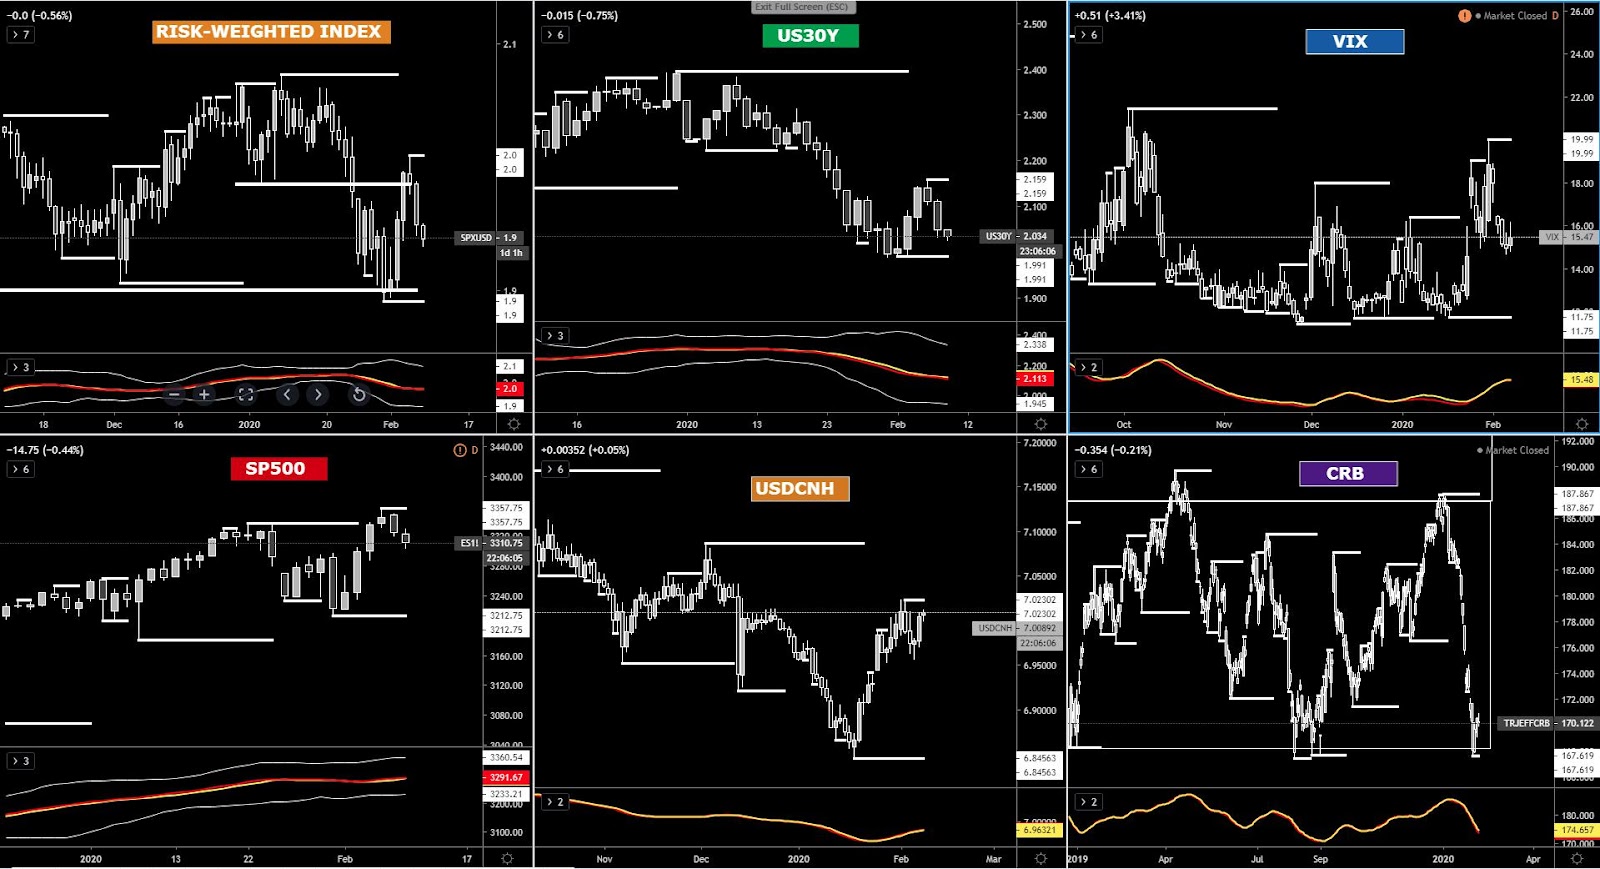
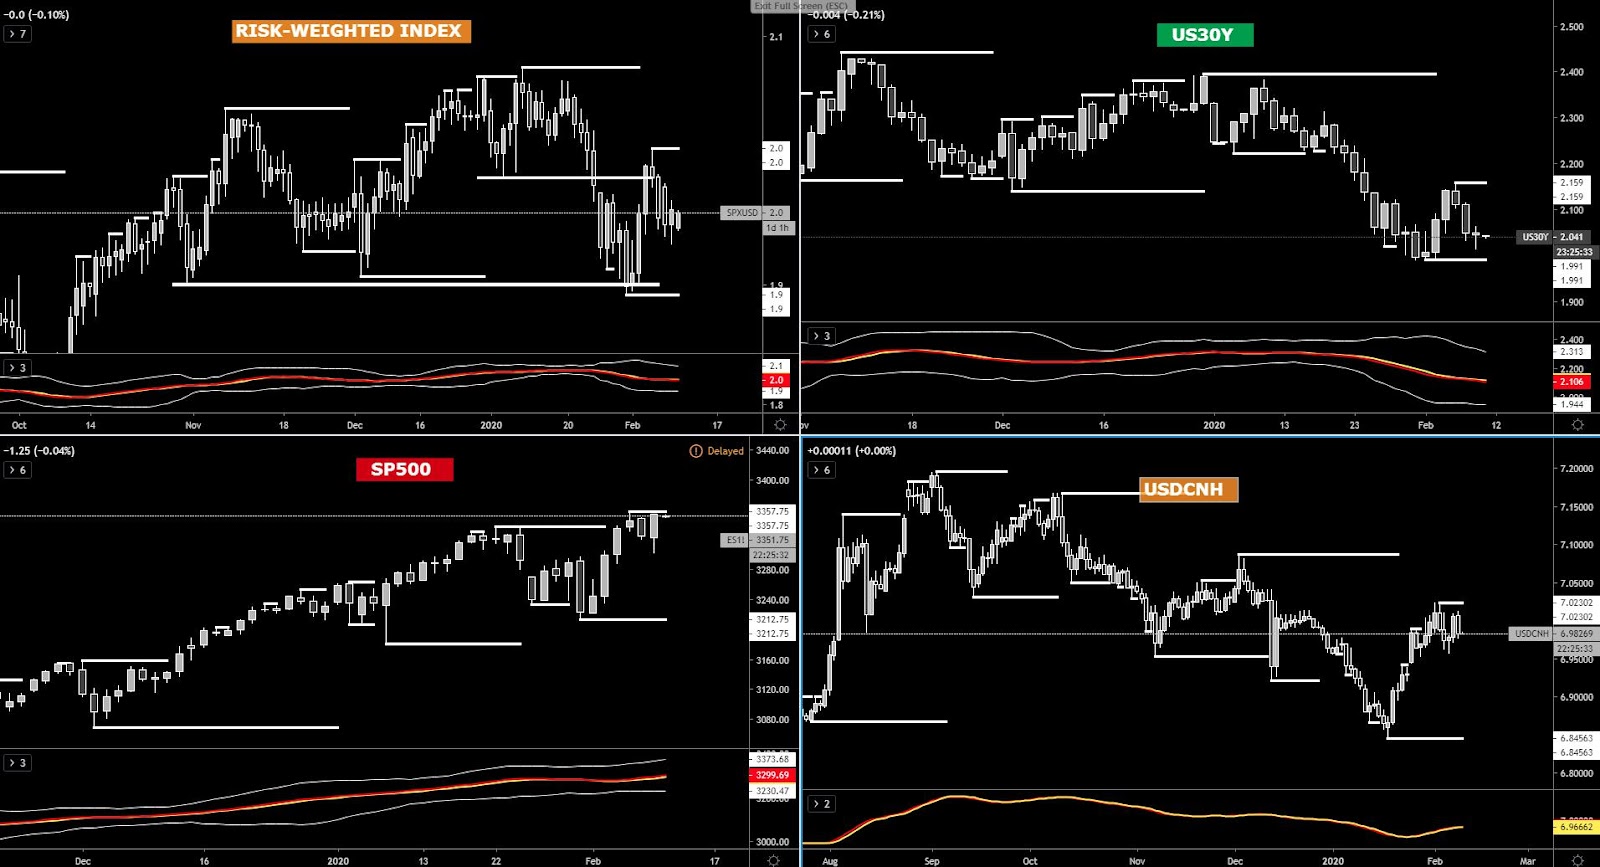
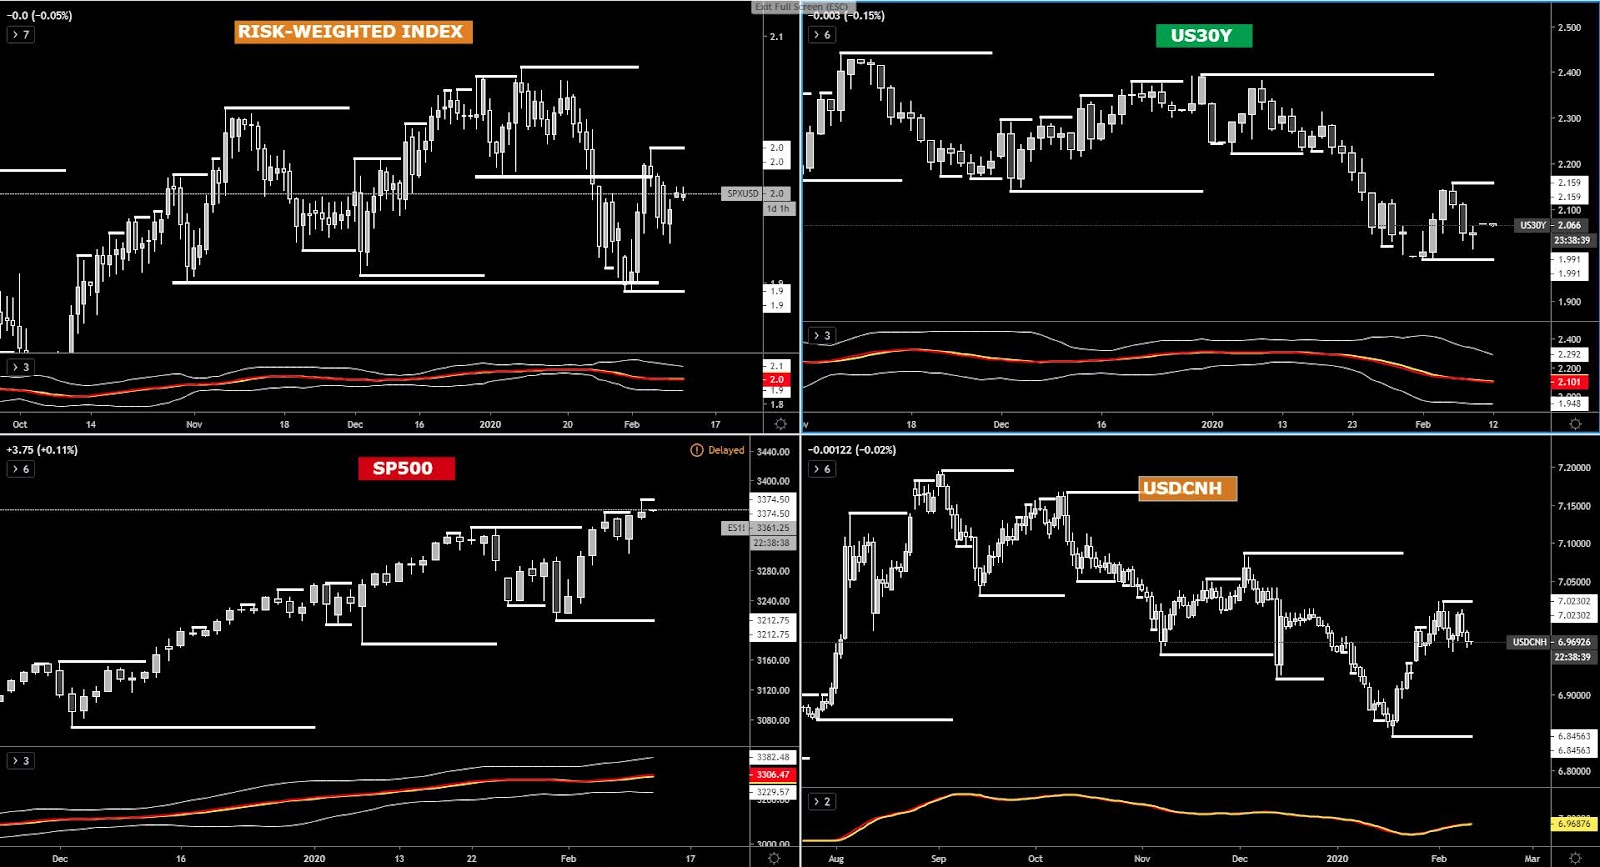
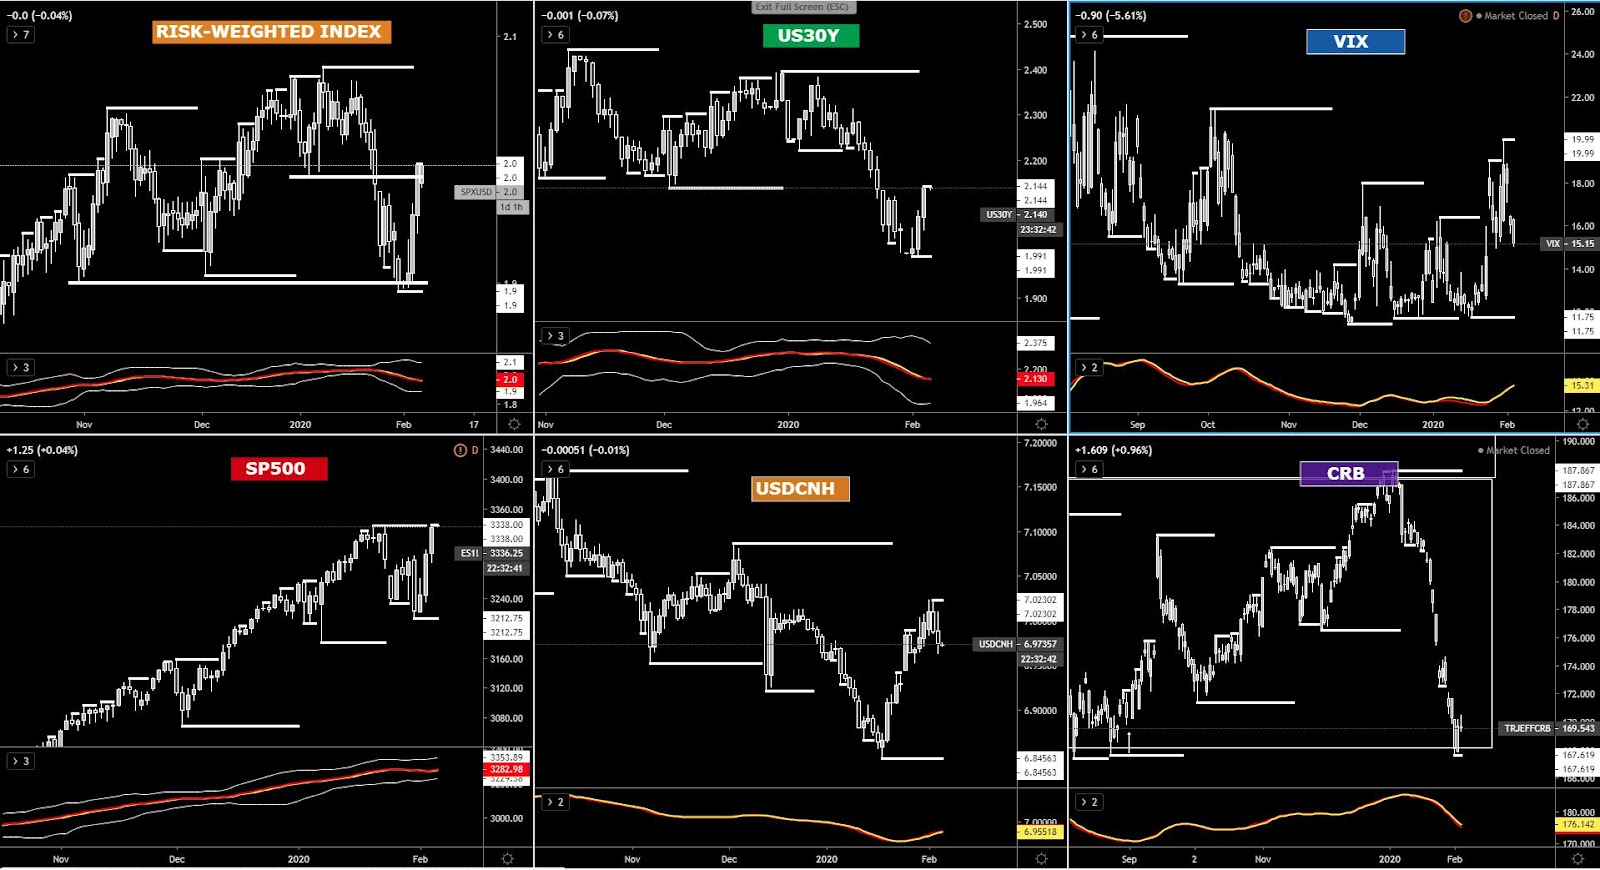
The risk dynamics keep improving. The S&P 500 is flirting with a new record high at a time when US bond yields (long-duration) keep rising. This move up in locksteps during this week sets up the stage for a perfect bearish storm in the Yen or Gold, the latter subject to USD strength, which is what we are seeing, hence why Gold is also plummeting. The reinvigorated risk profile comes as the Yuan also keeps strengthening or the VIX keeps easing from its elevated levels of 20.00, last close around the 15.00.
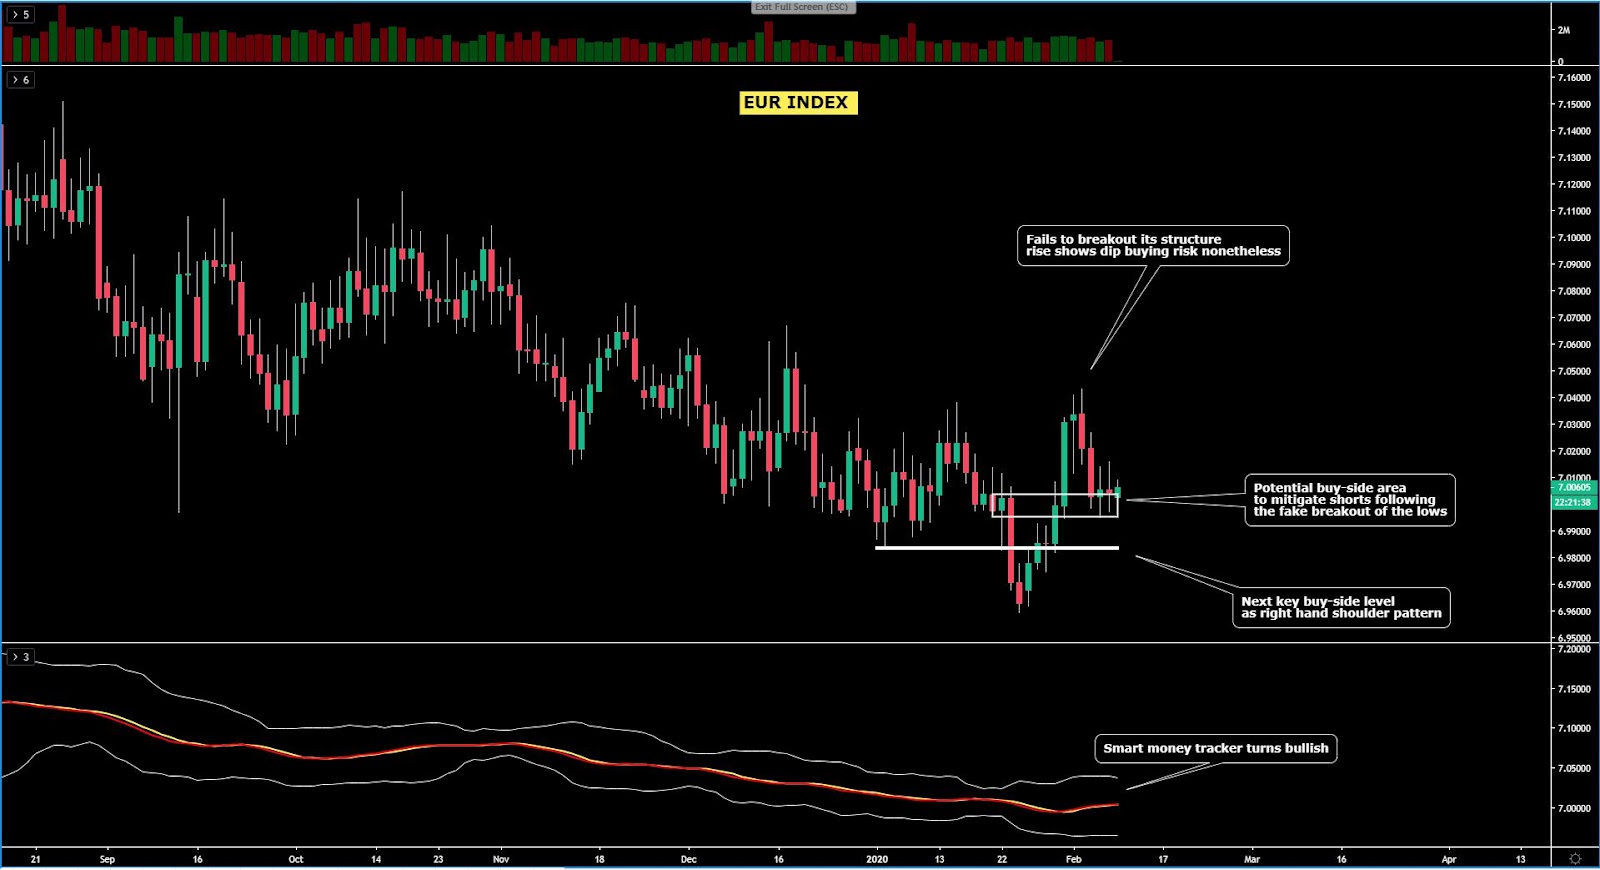
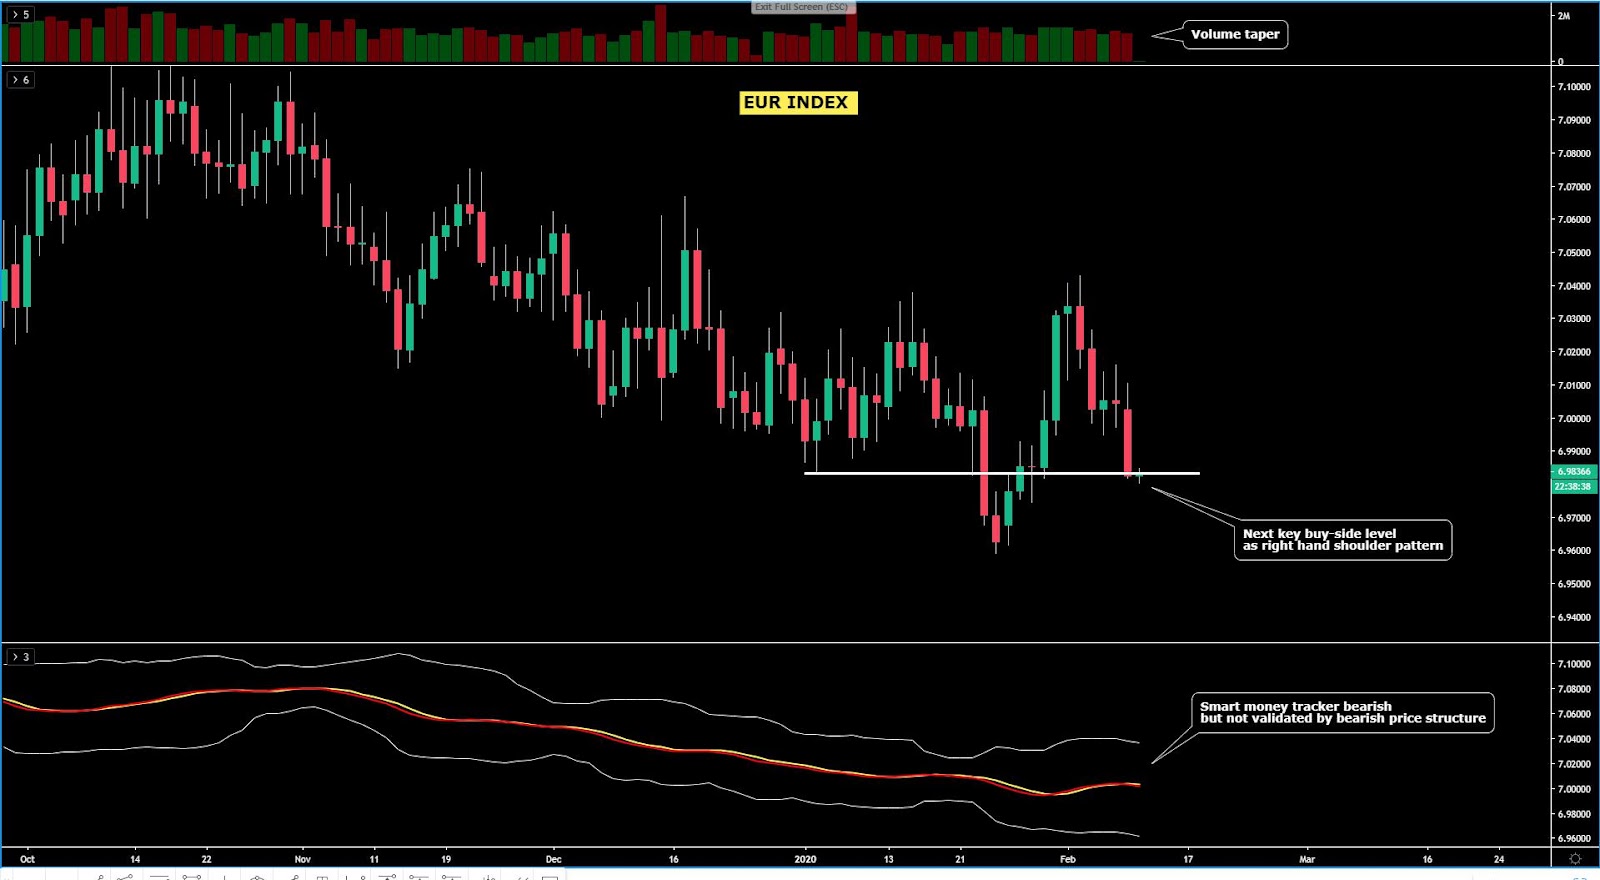
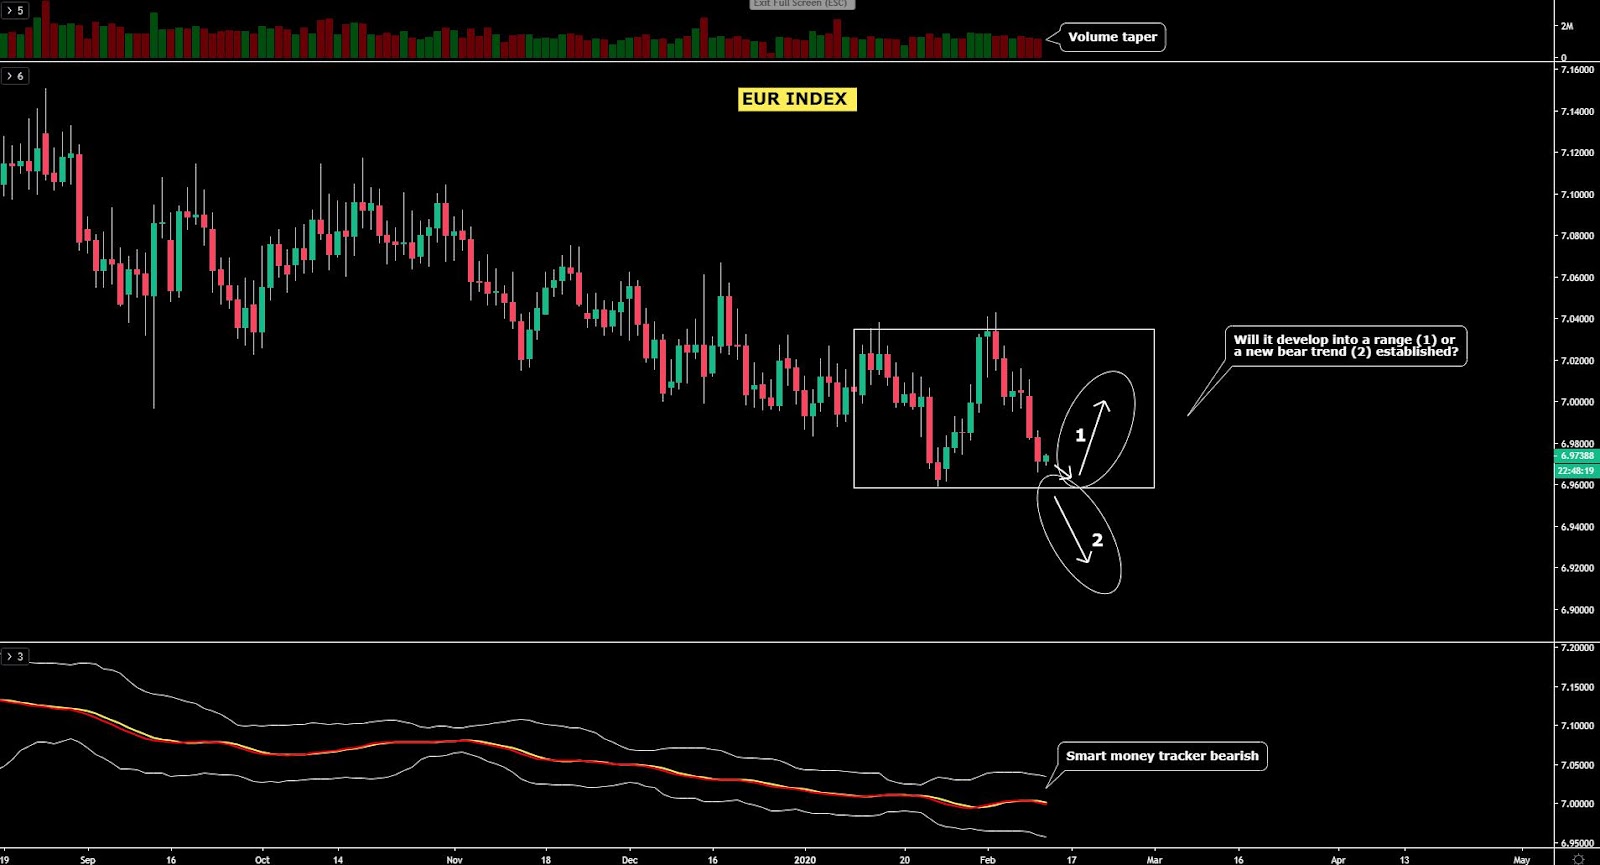
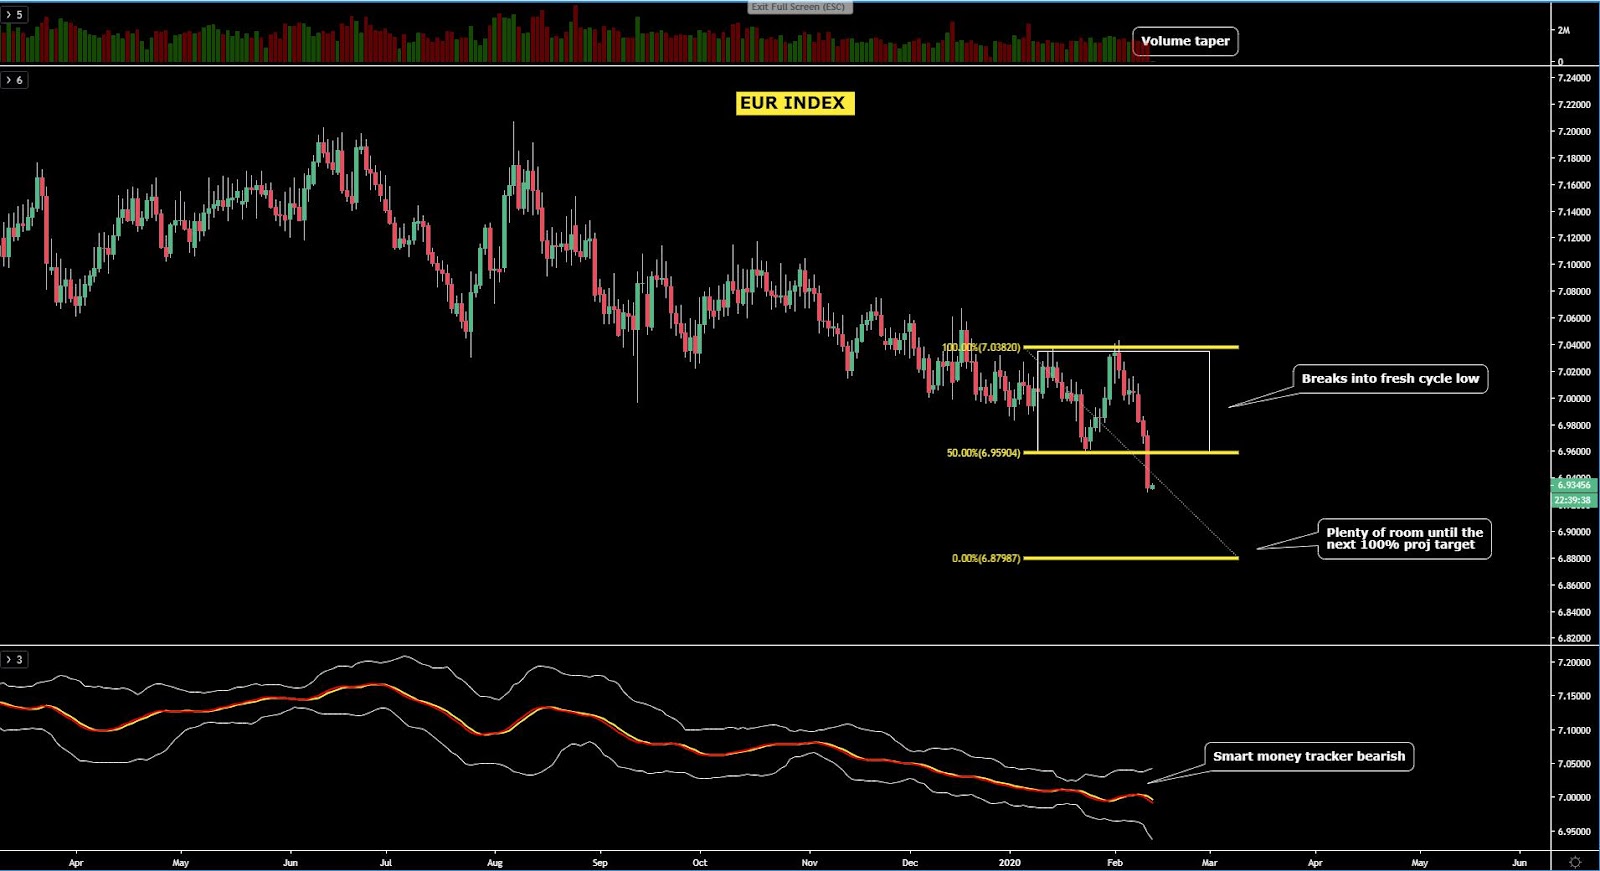
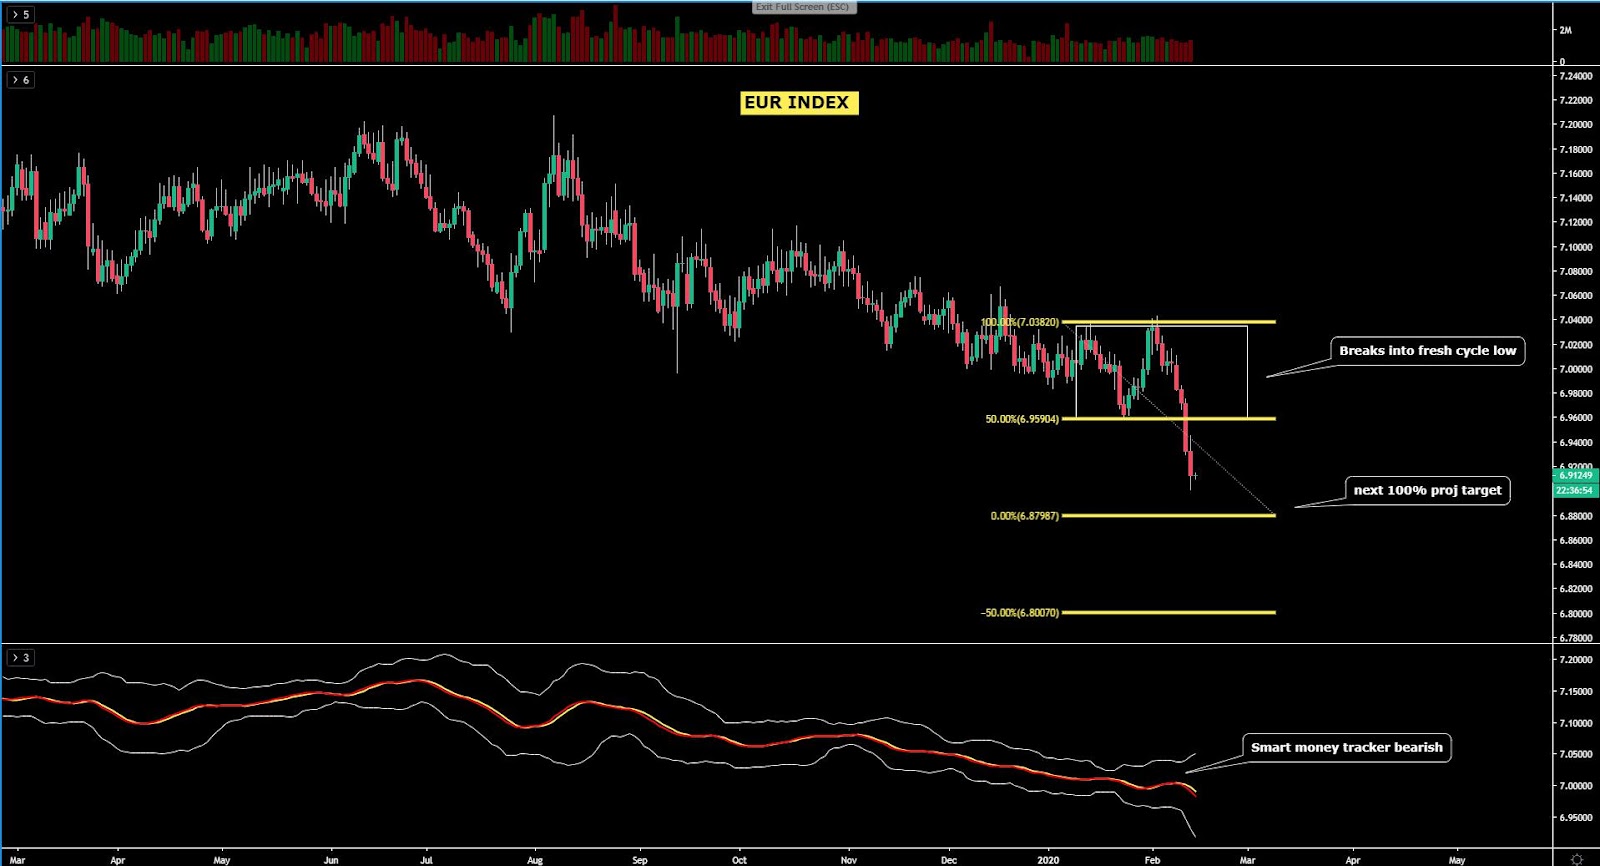
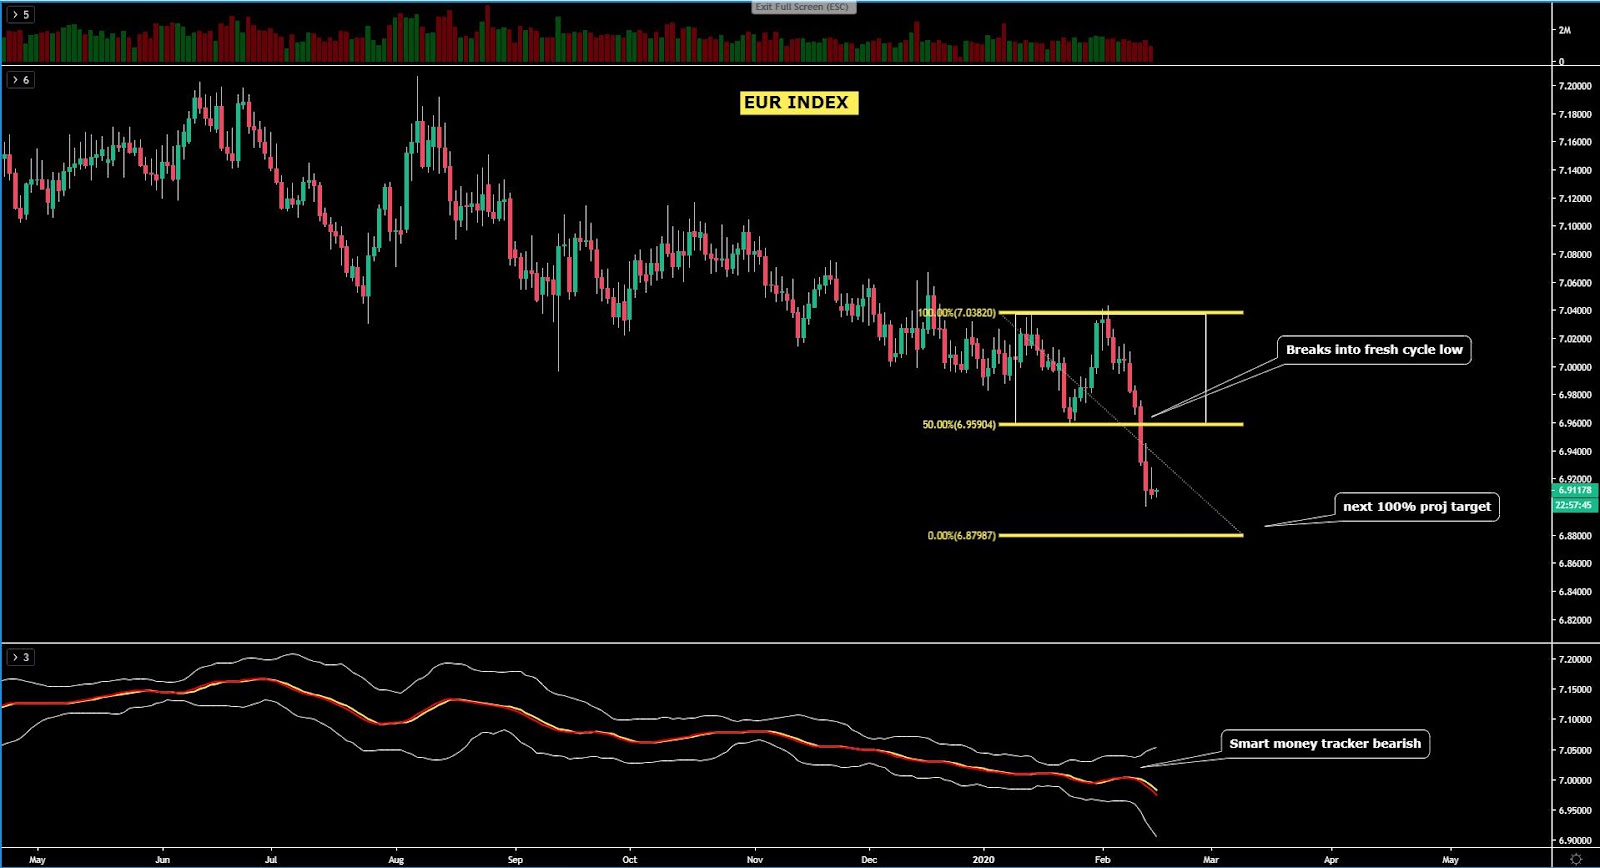
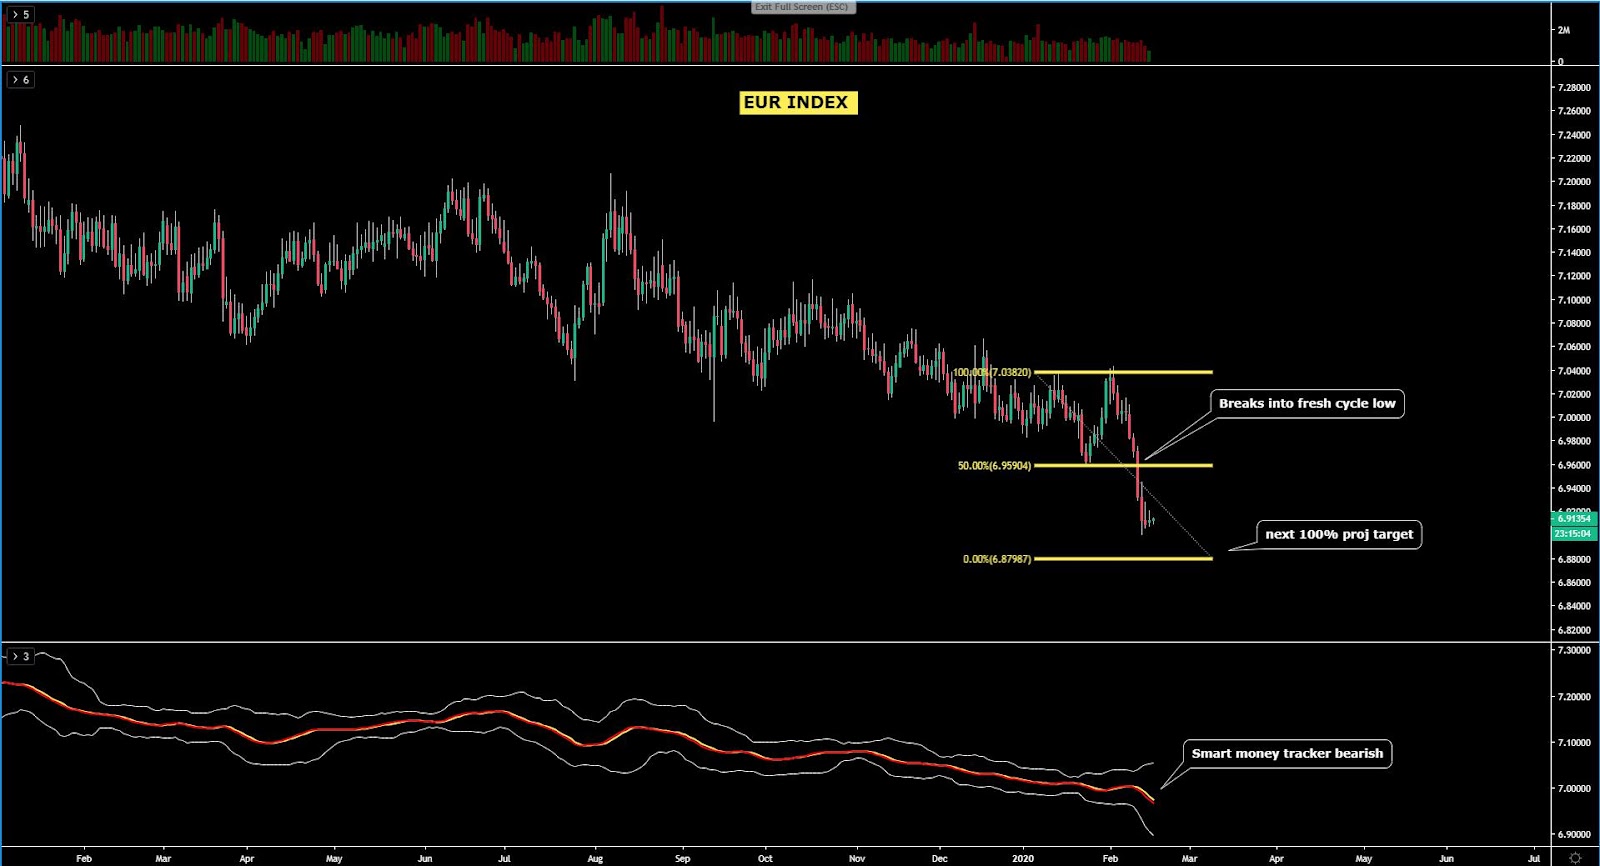
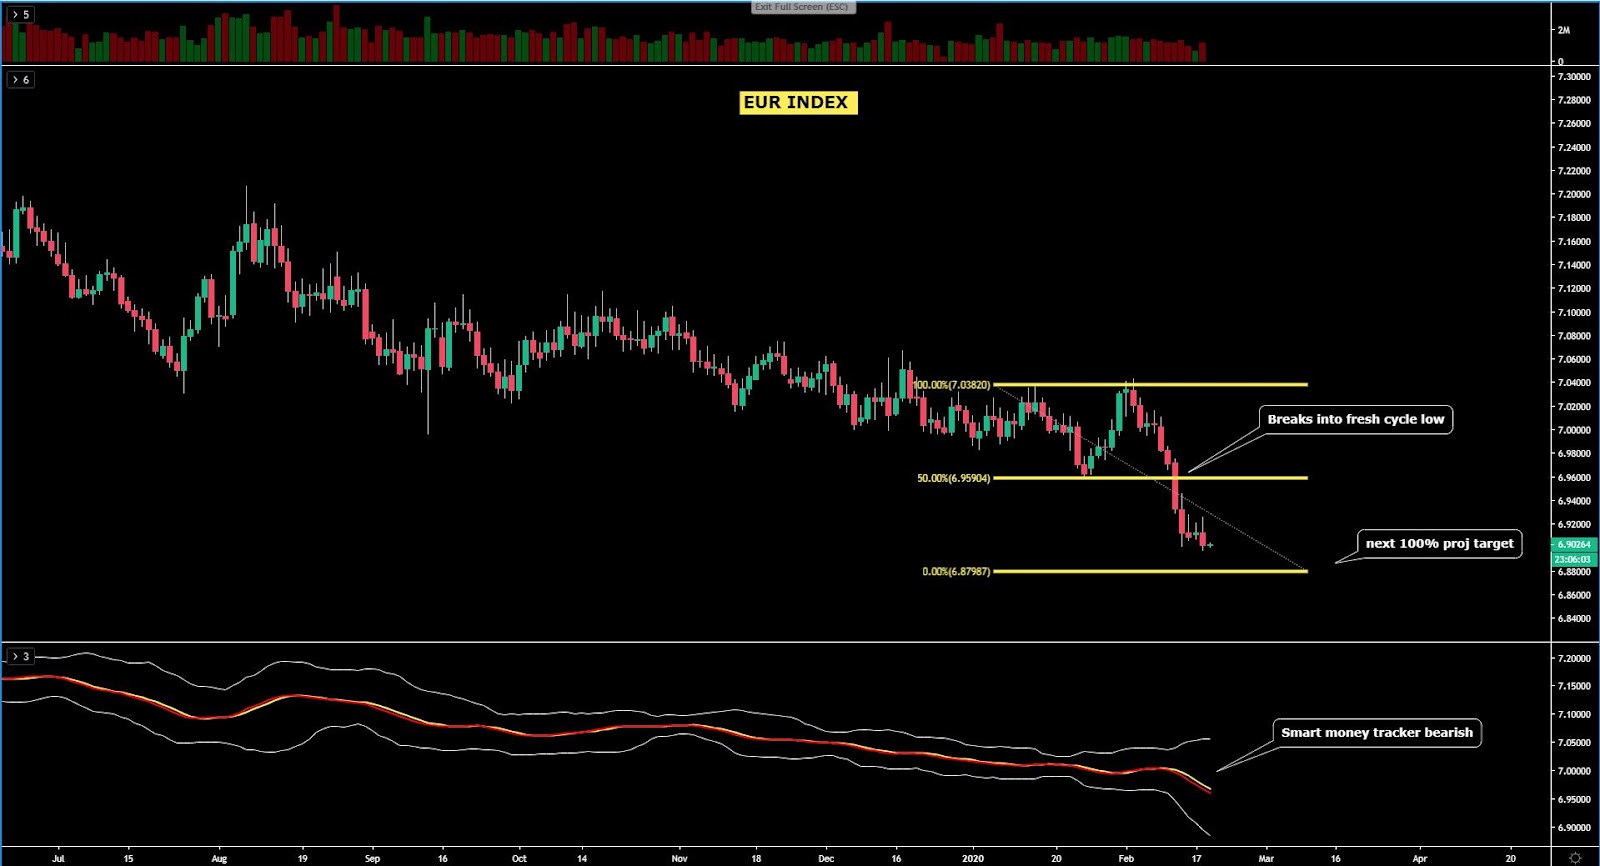
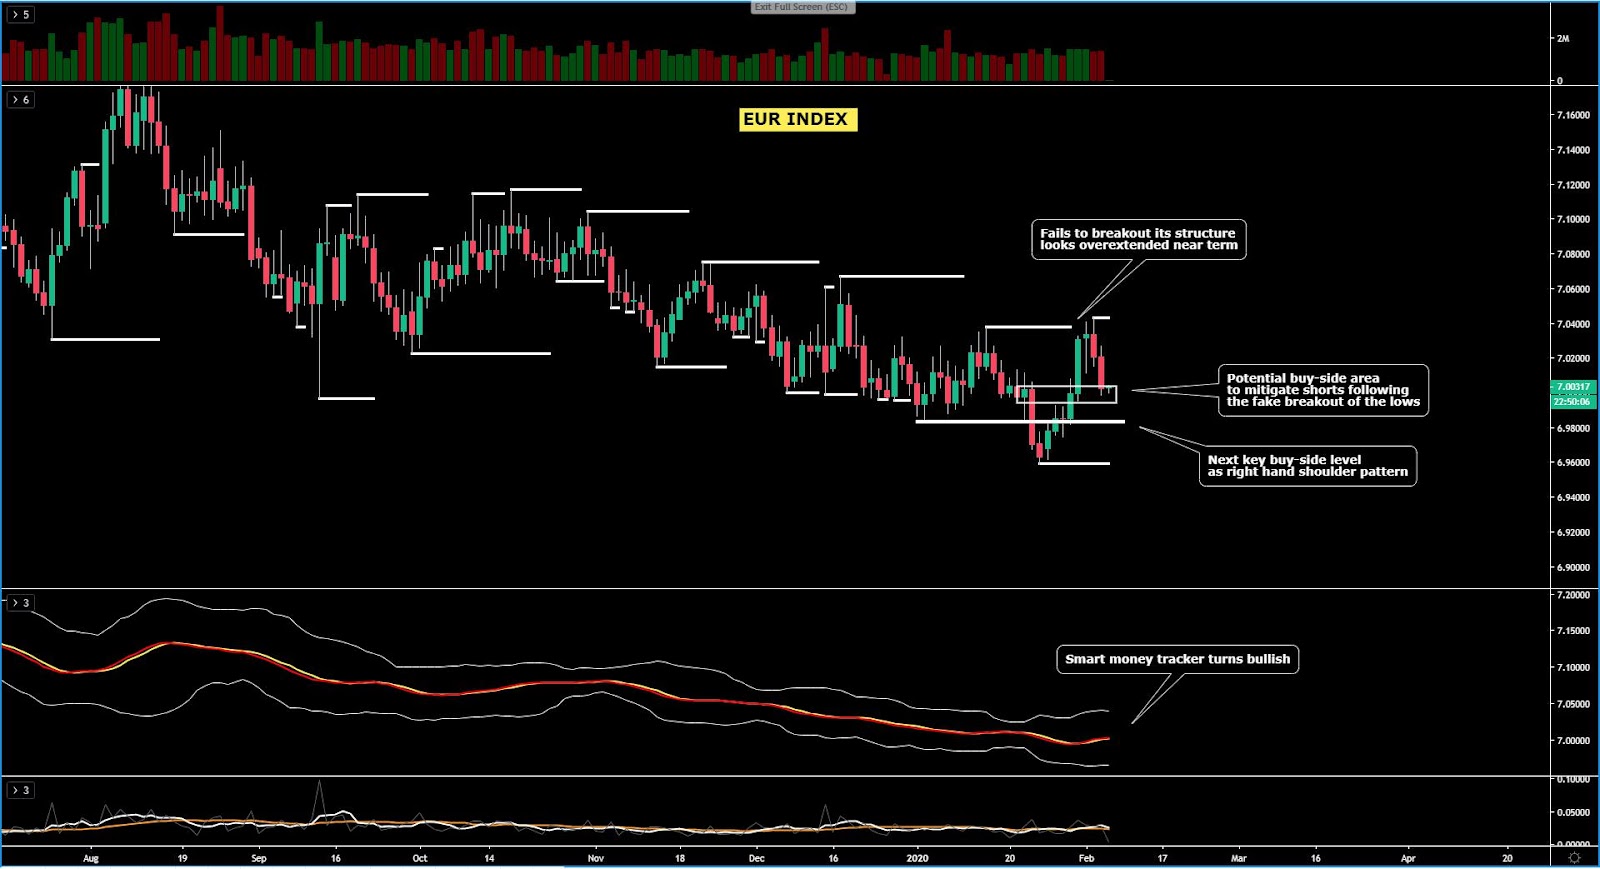
The EUR index, despite the latest two days of sell-off from a critical resistance, should see buy-side interest emerging fairly soon, with the downside largely cap to a maximum fall of around 0.2% for today, based on the technical picture. The demand imbalance that I am envisioning is predicated on the basis of segmented cluster of bids to be found between the origin of the supply bar that led to the last breakout and a support line as per the multiple lows that were found prior to the mentioned downside breakout. Note, the bullish momentum off the daily is still valid based on the smart money tracker, despite the structure being range-bound.
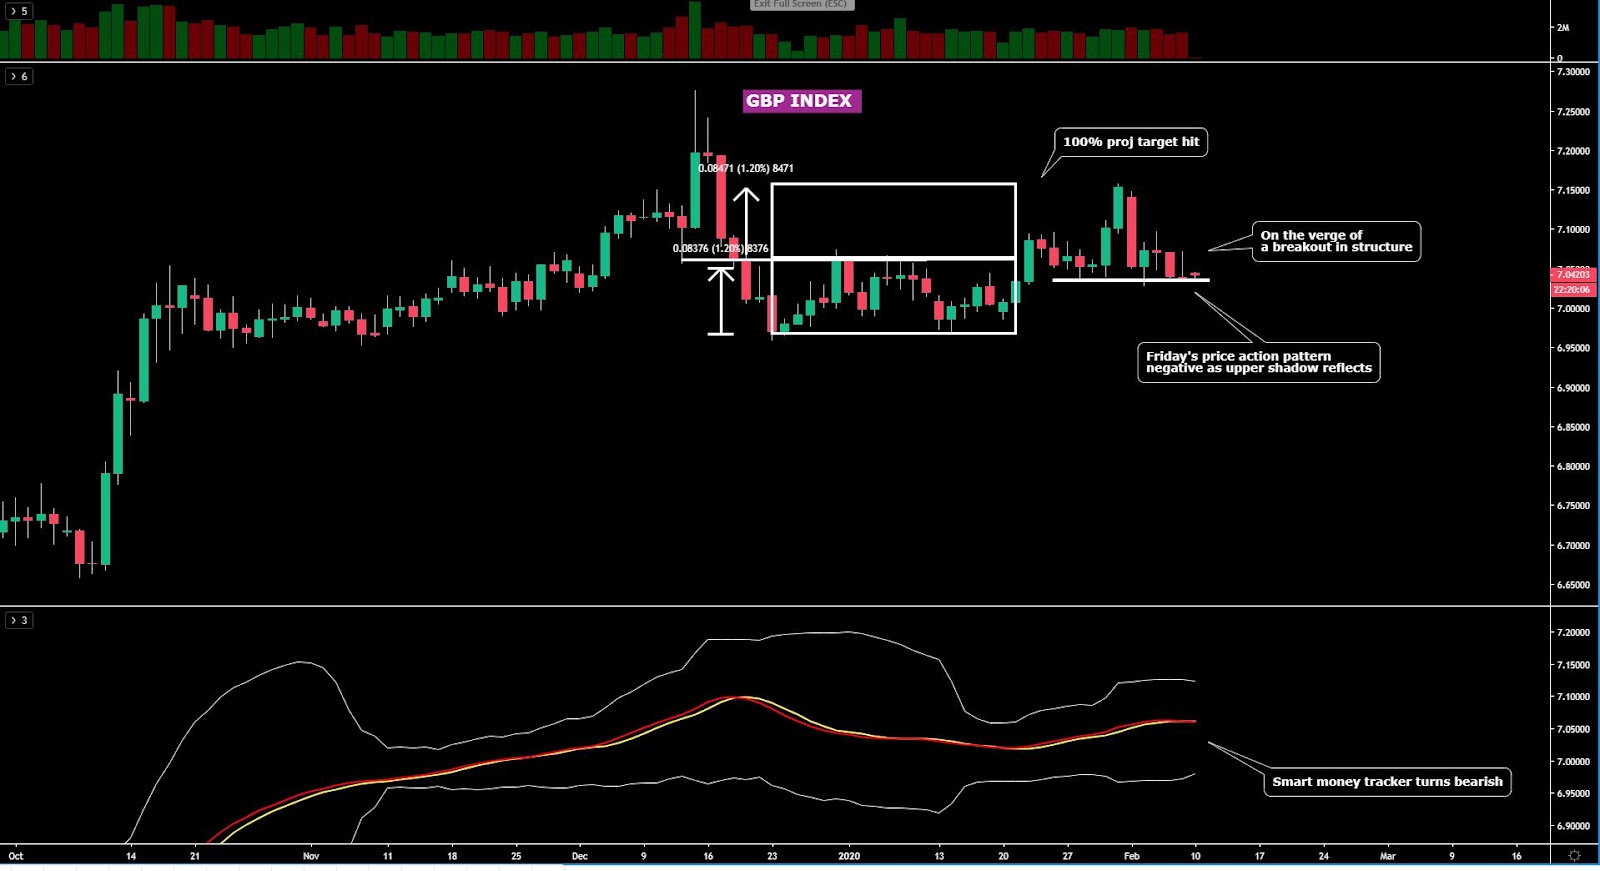
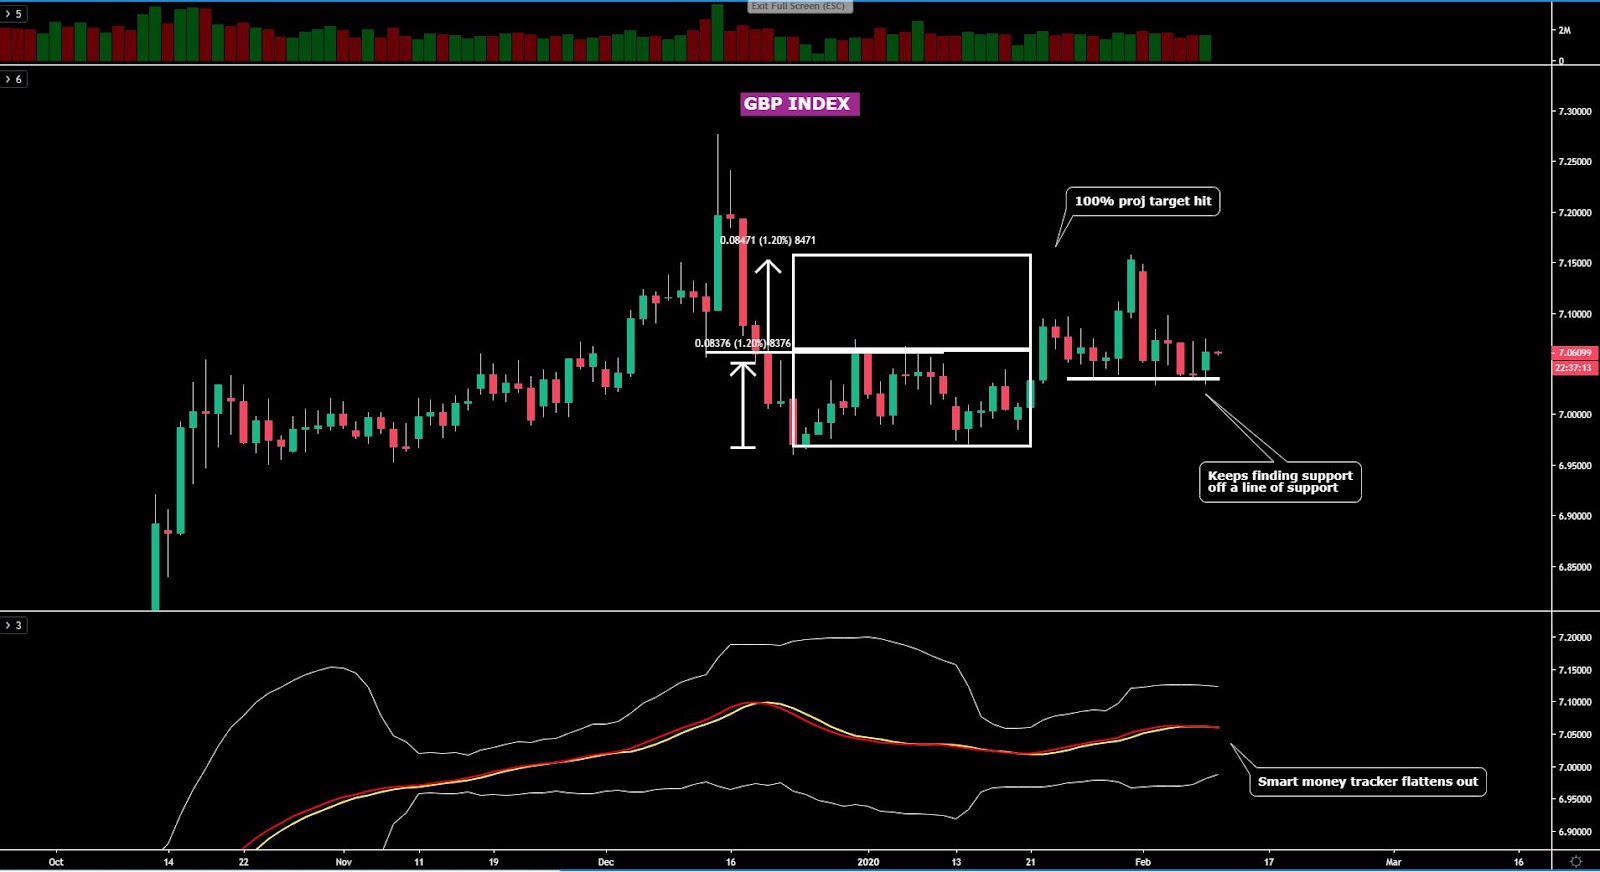
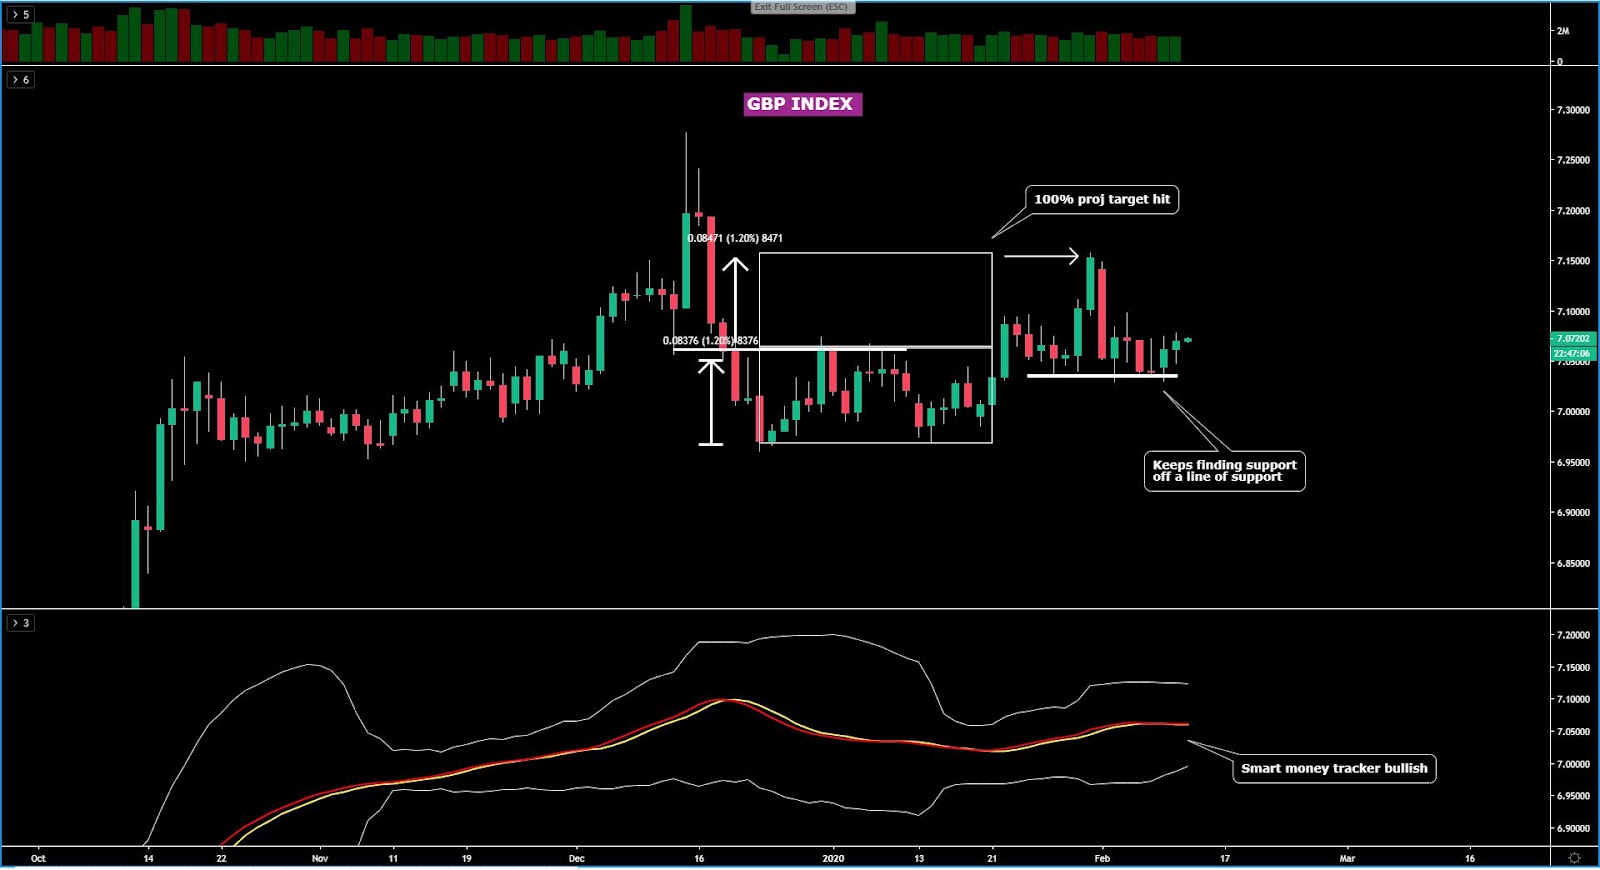
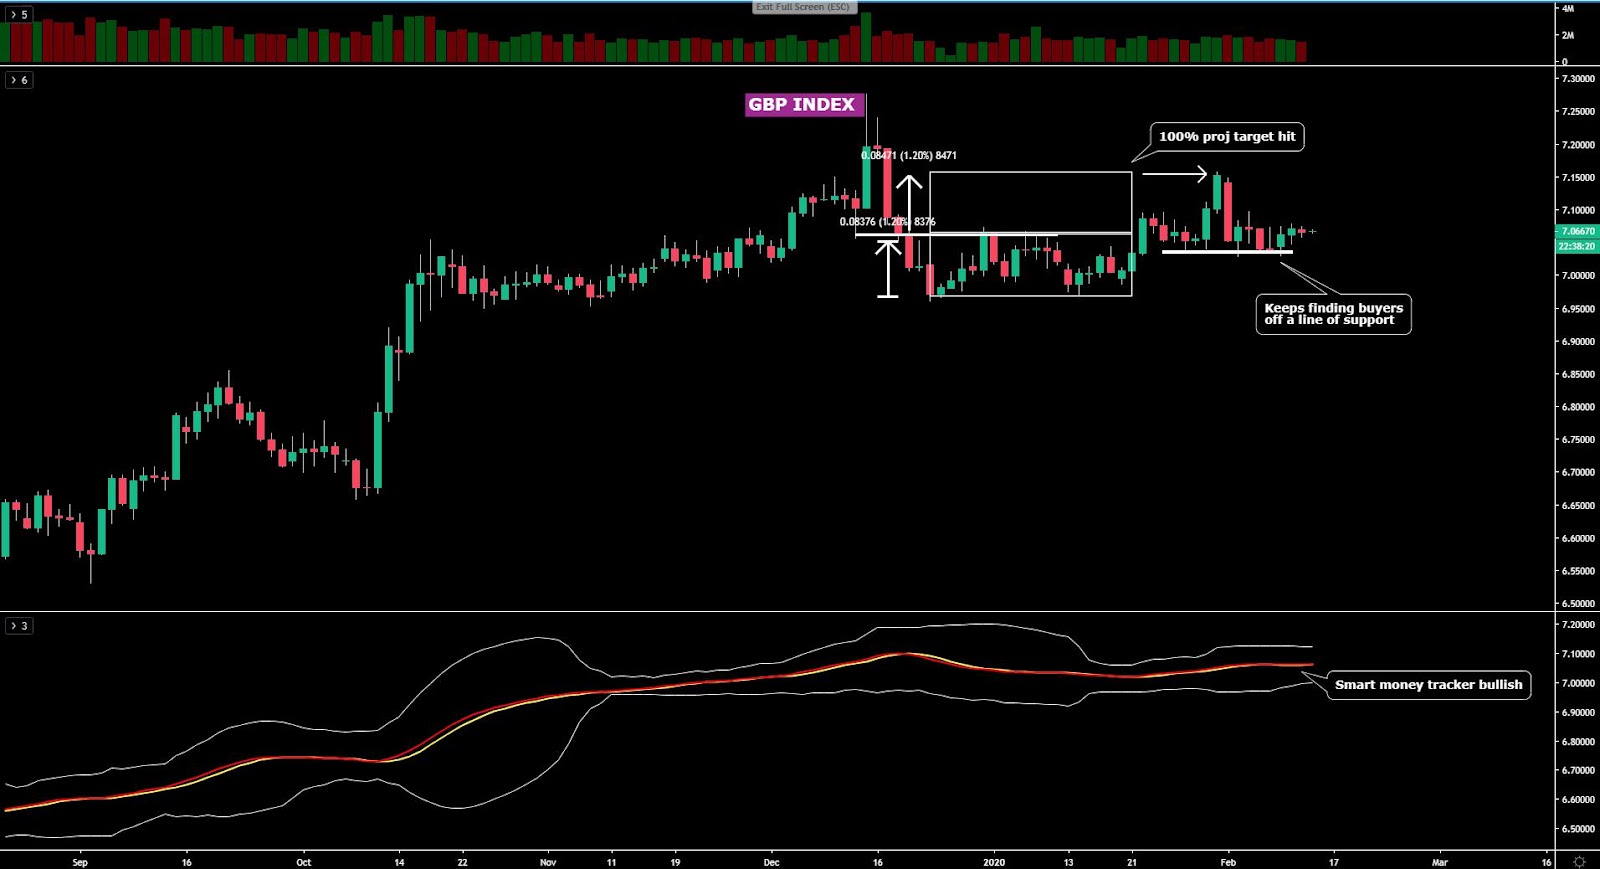
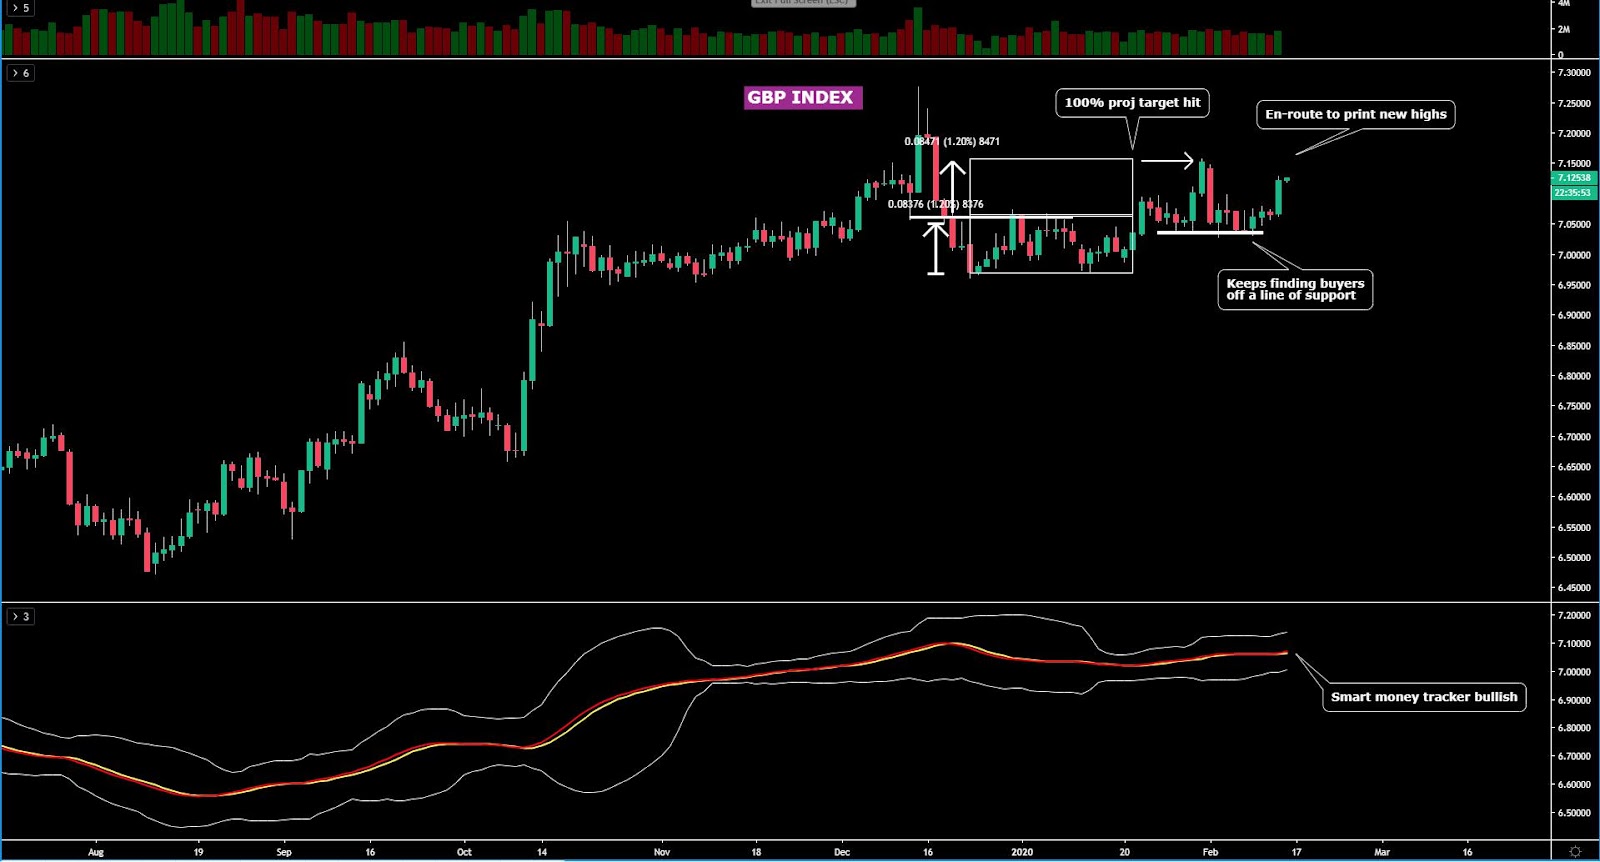
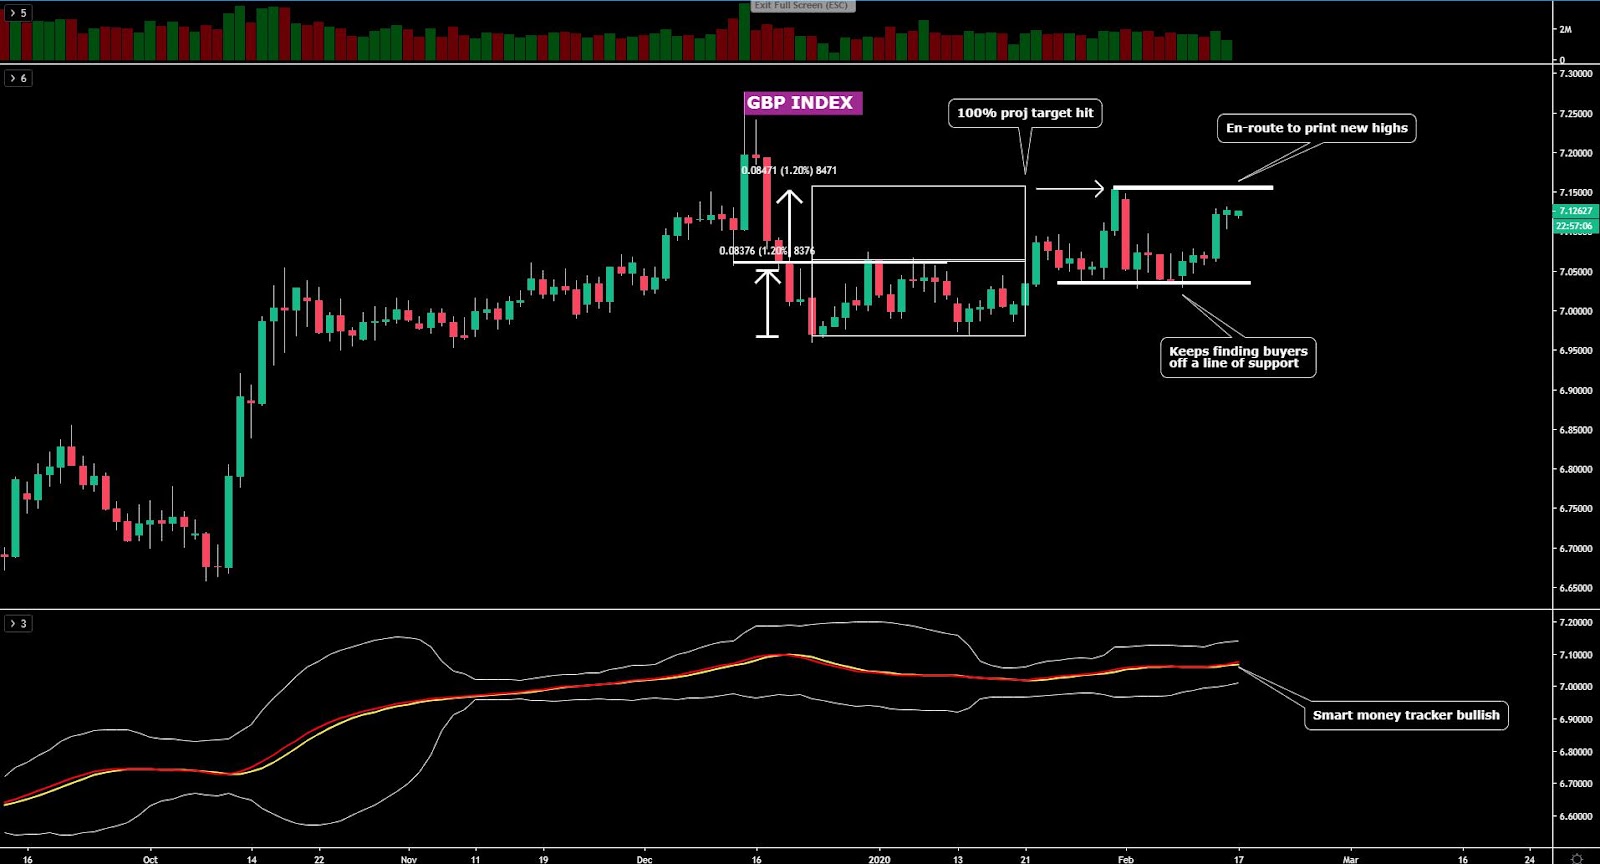
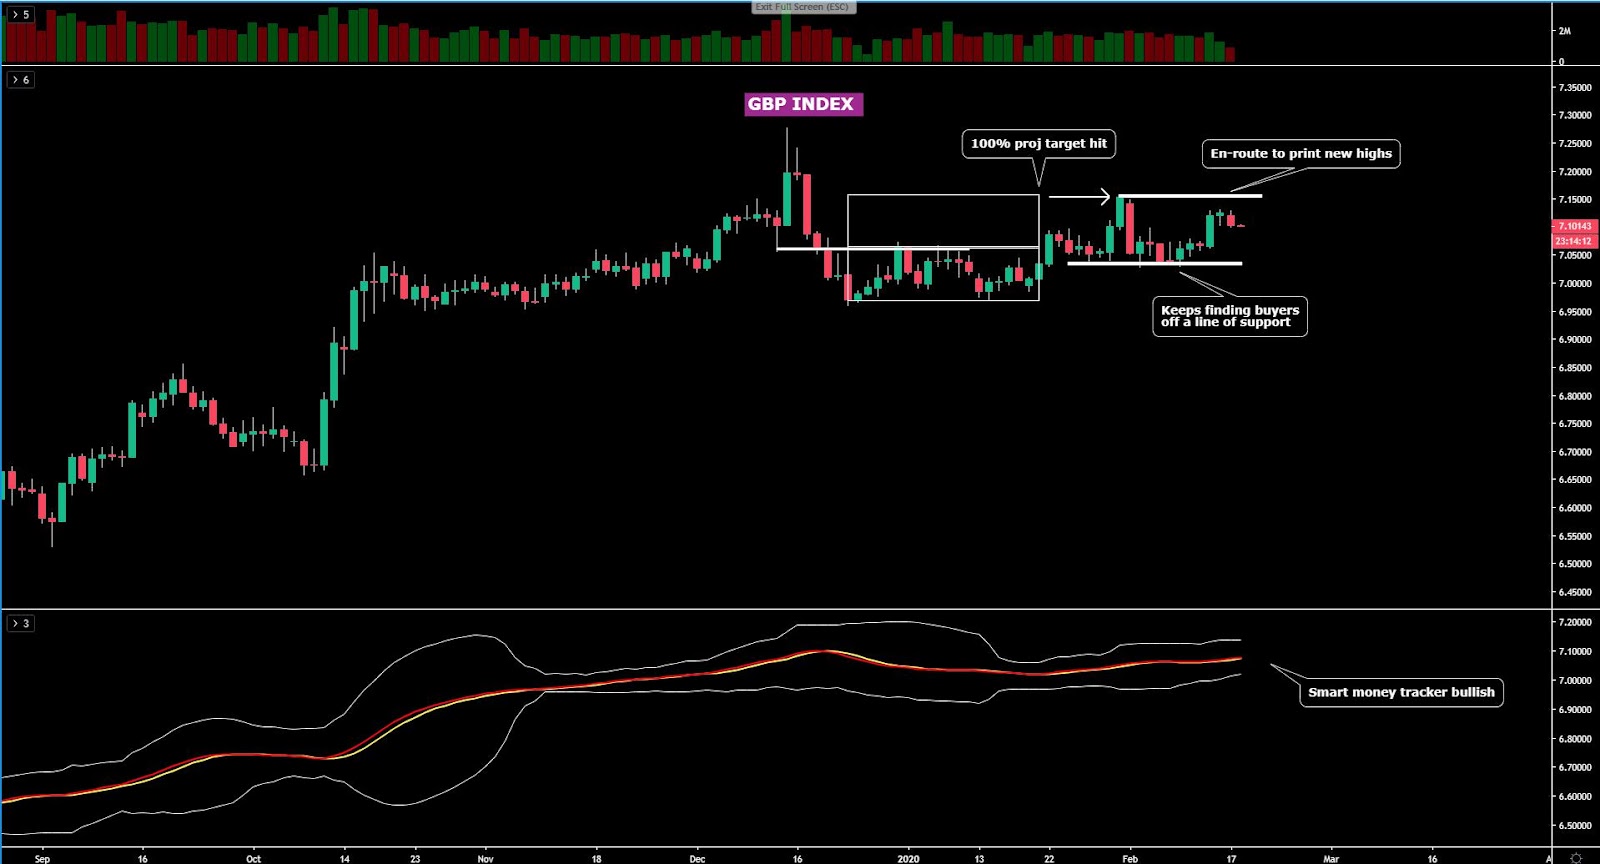
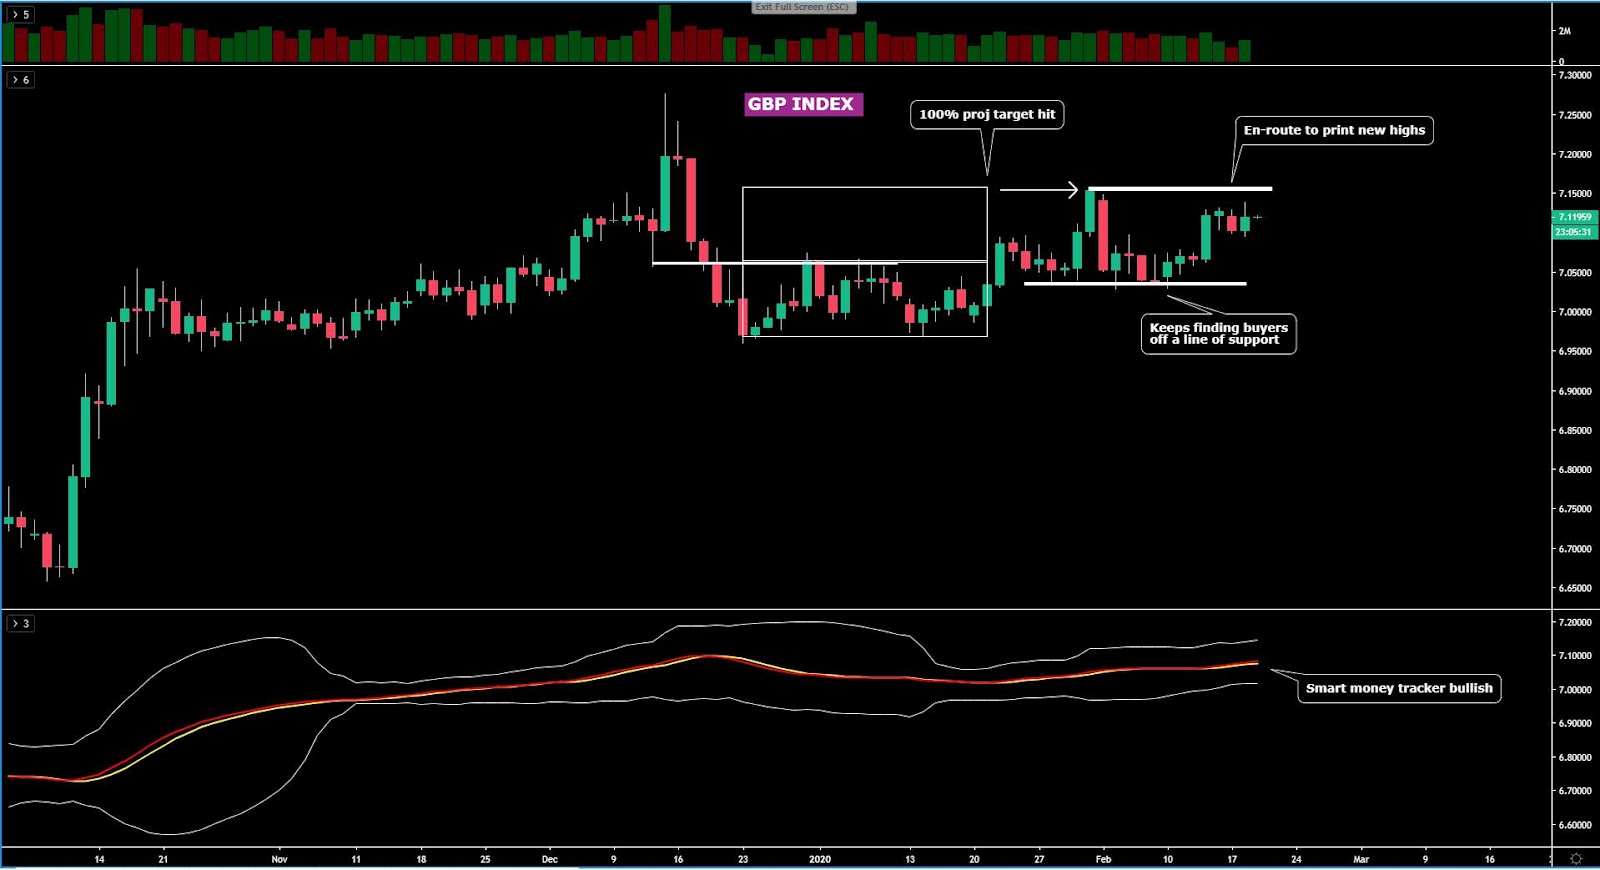
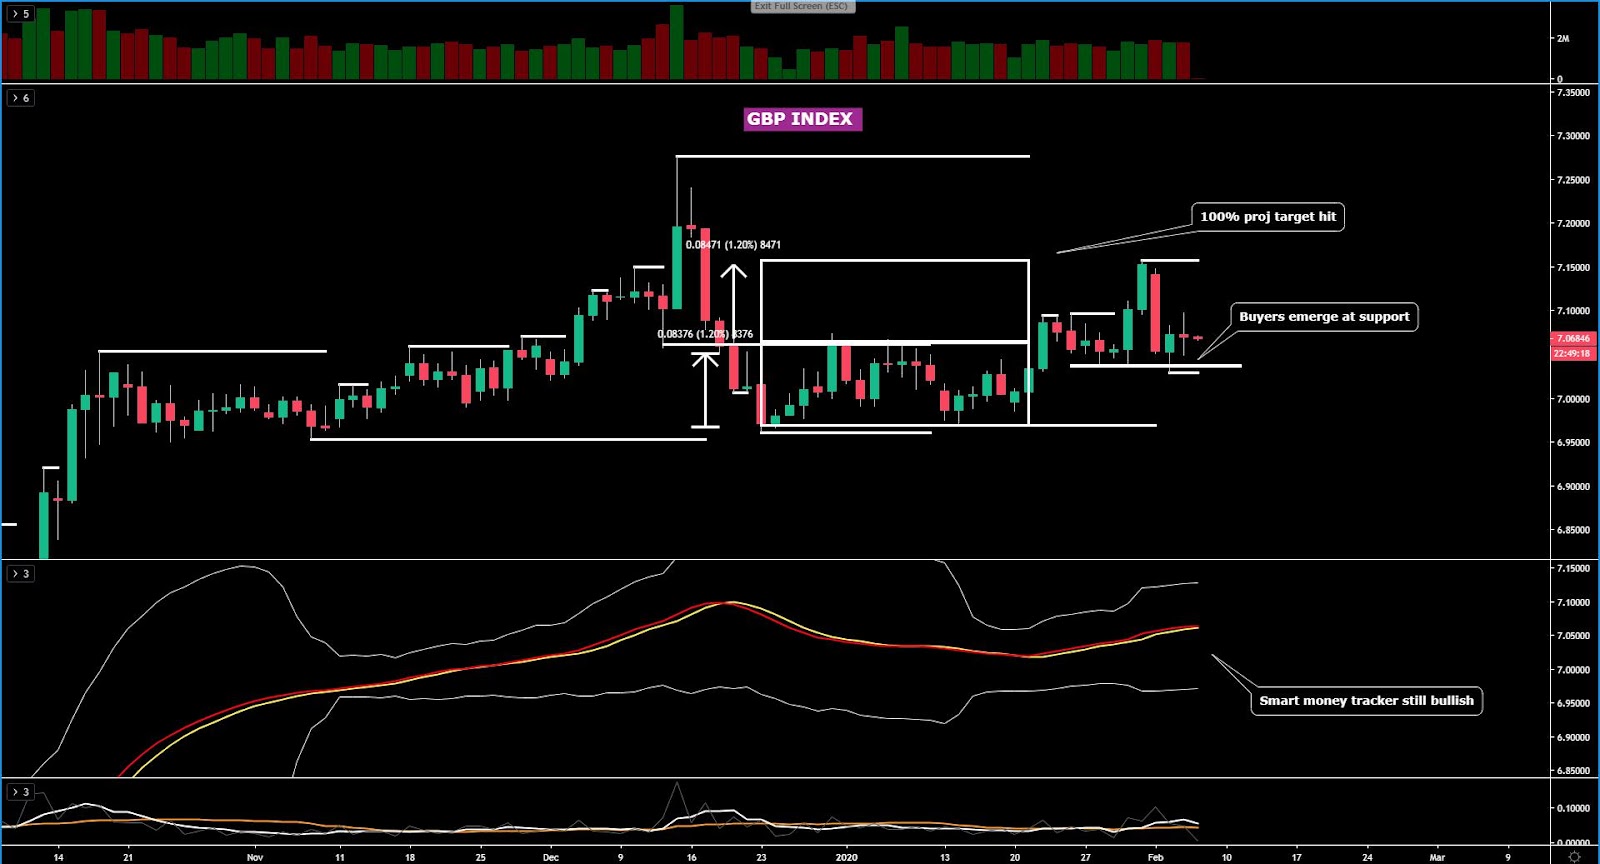
The GBP index, on the back of a rejection off its 100% projection target, got sold off in a strong fashion only to see the a horizontal support acts as a line of defence for buyers.Wednesday’s price action was largely inconclusive, in the context of a market that still needs to provide extra clues to gain more clarity on the next directional bias. For now, the fact that equal lows were formed during the flattening of the bollinger band suggests an expanded range formed. The establishment of a bearish cycle will only be validated if we see a breakout of the prior swing low with acceptance below. Until then, there is not enough evidence to overcommit on the GBP.
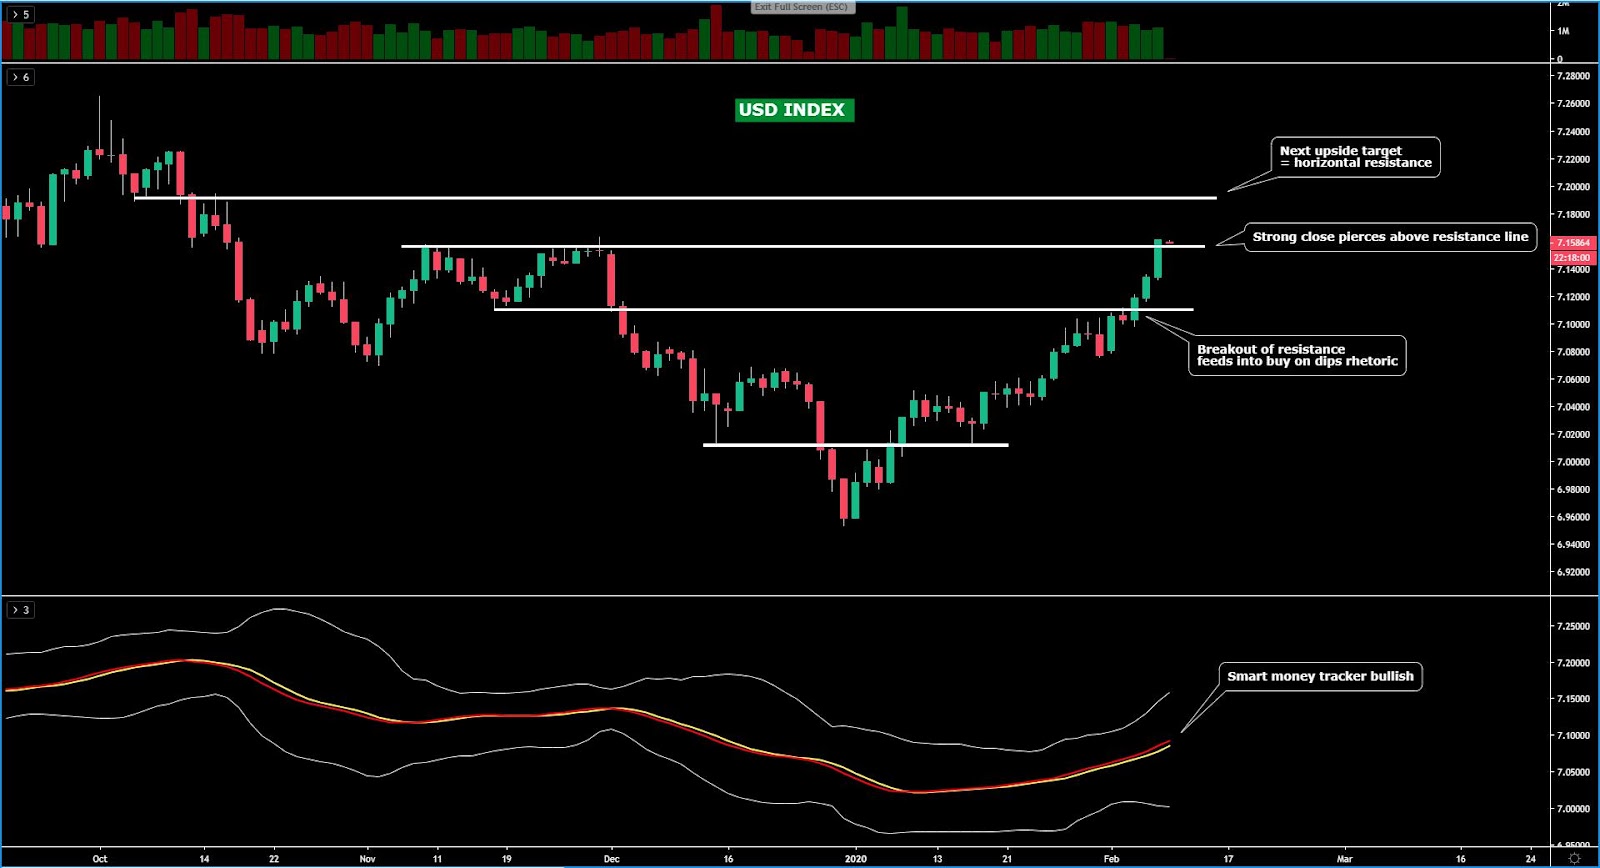
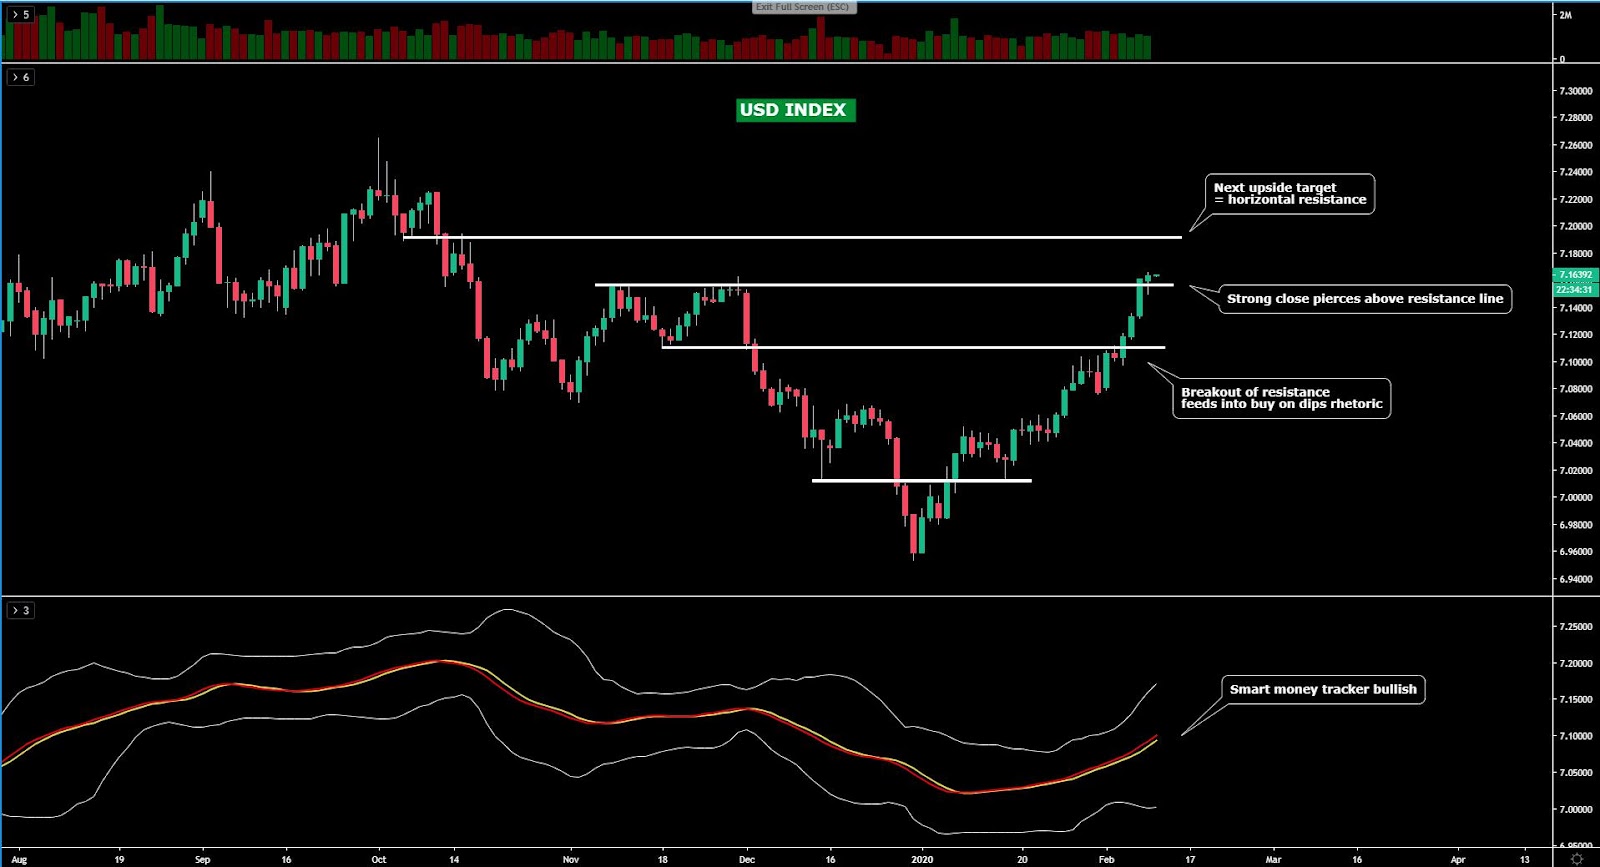
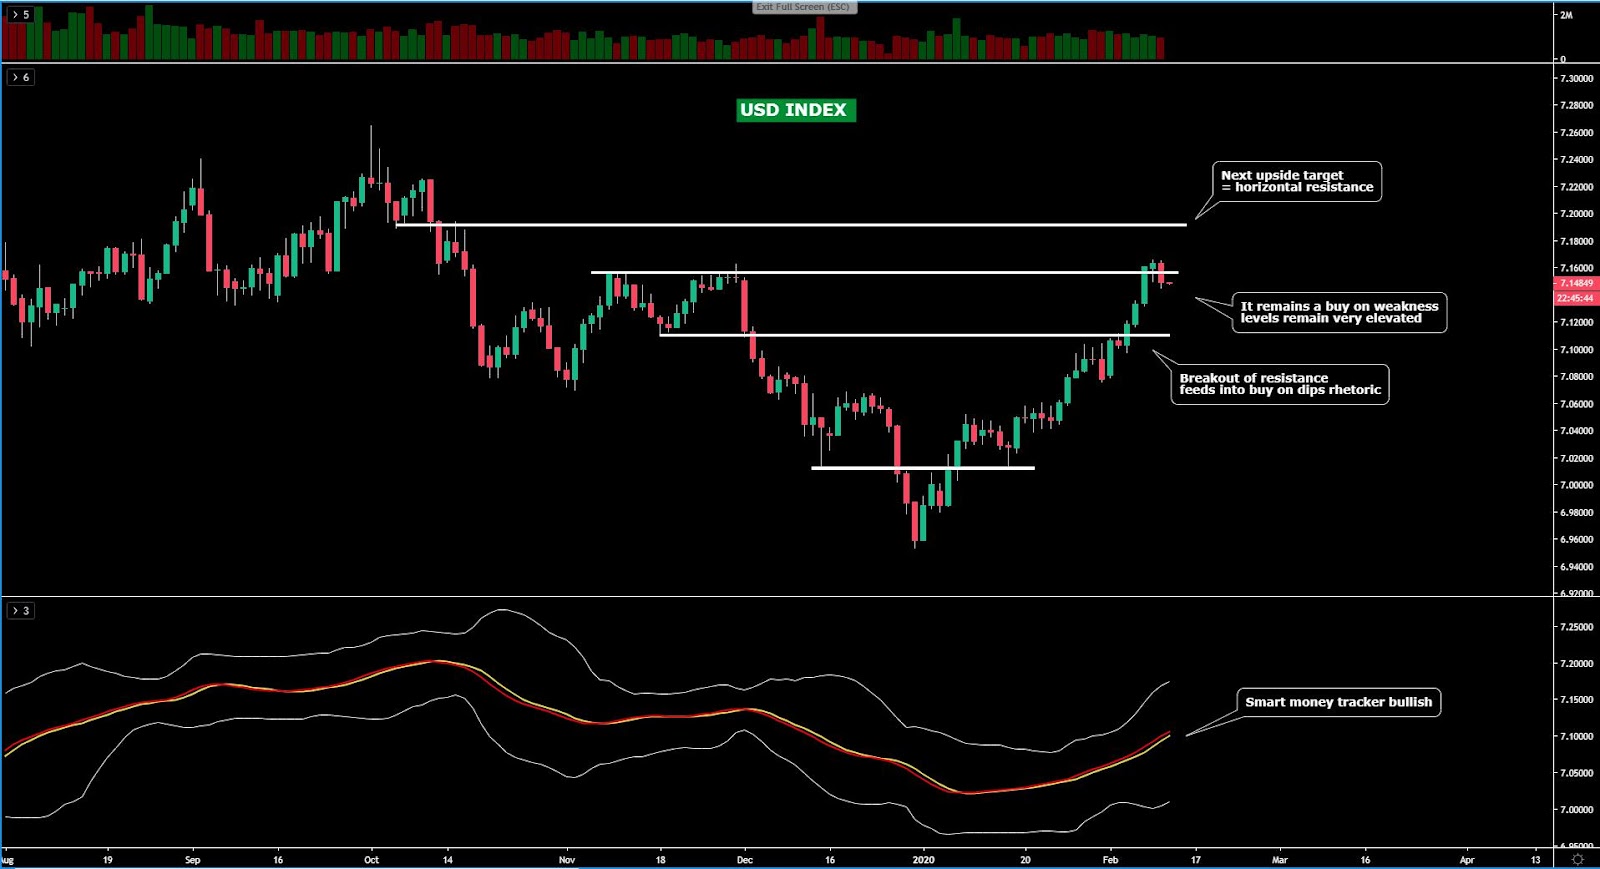
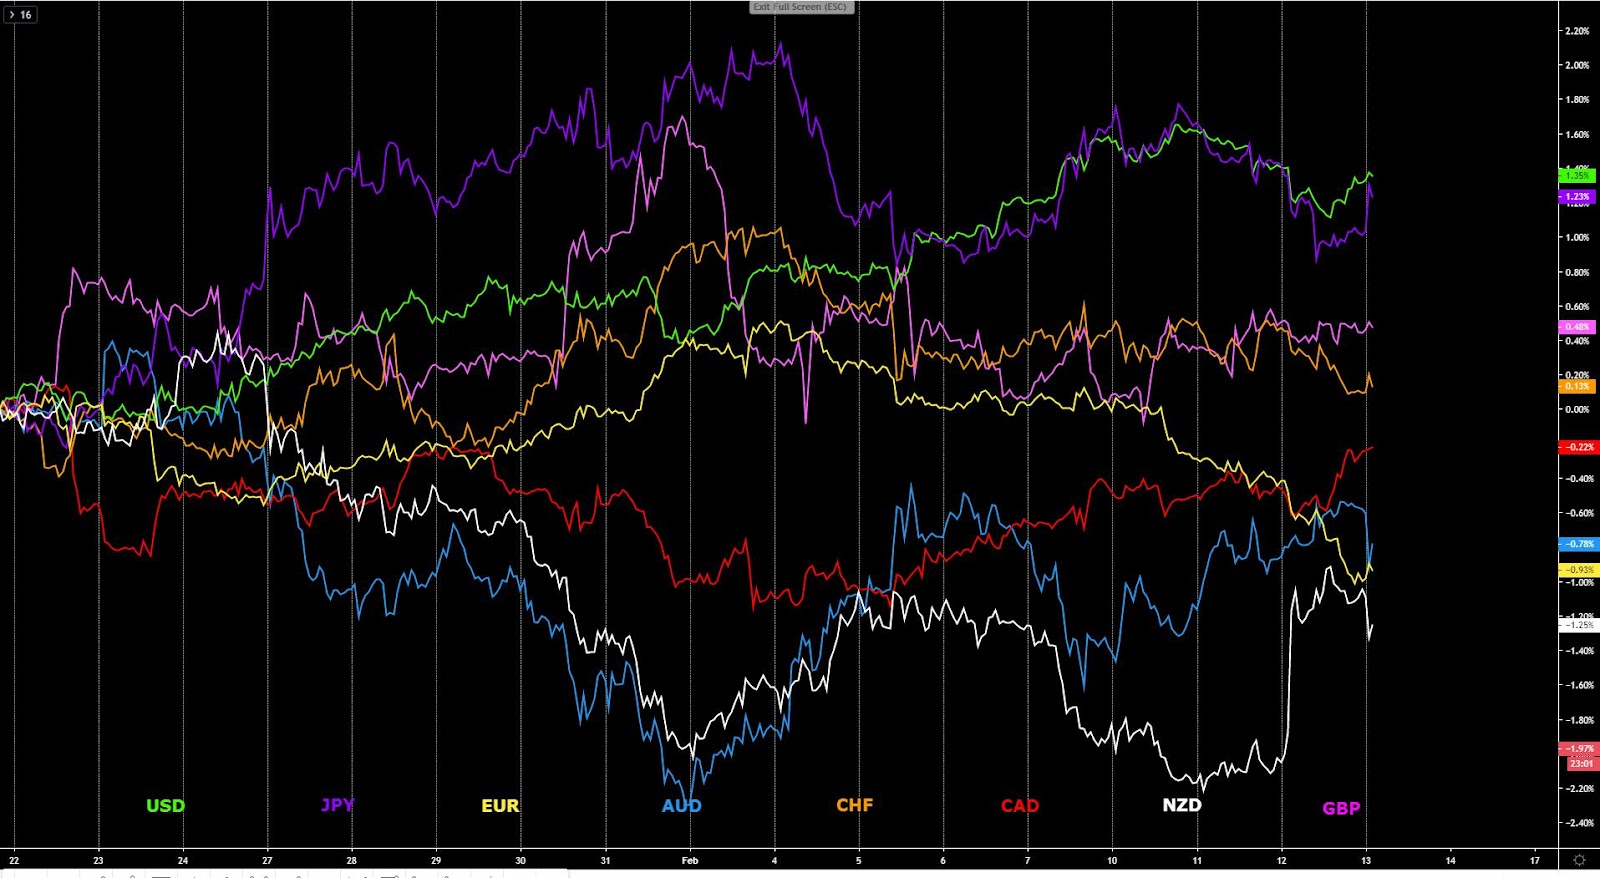
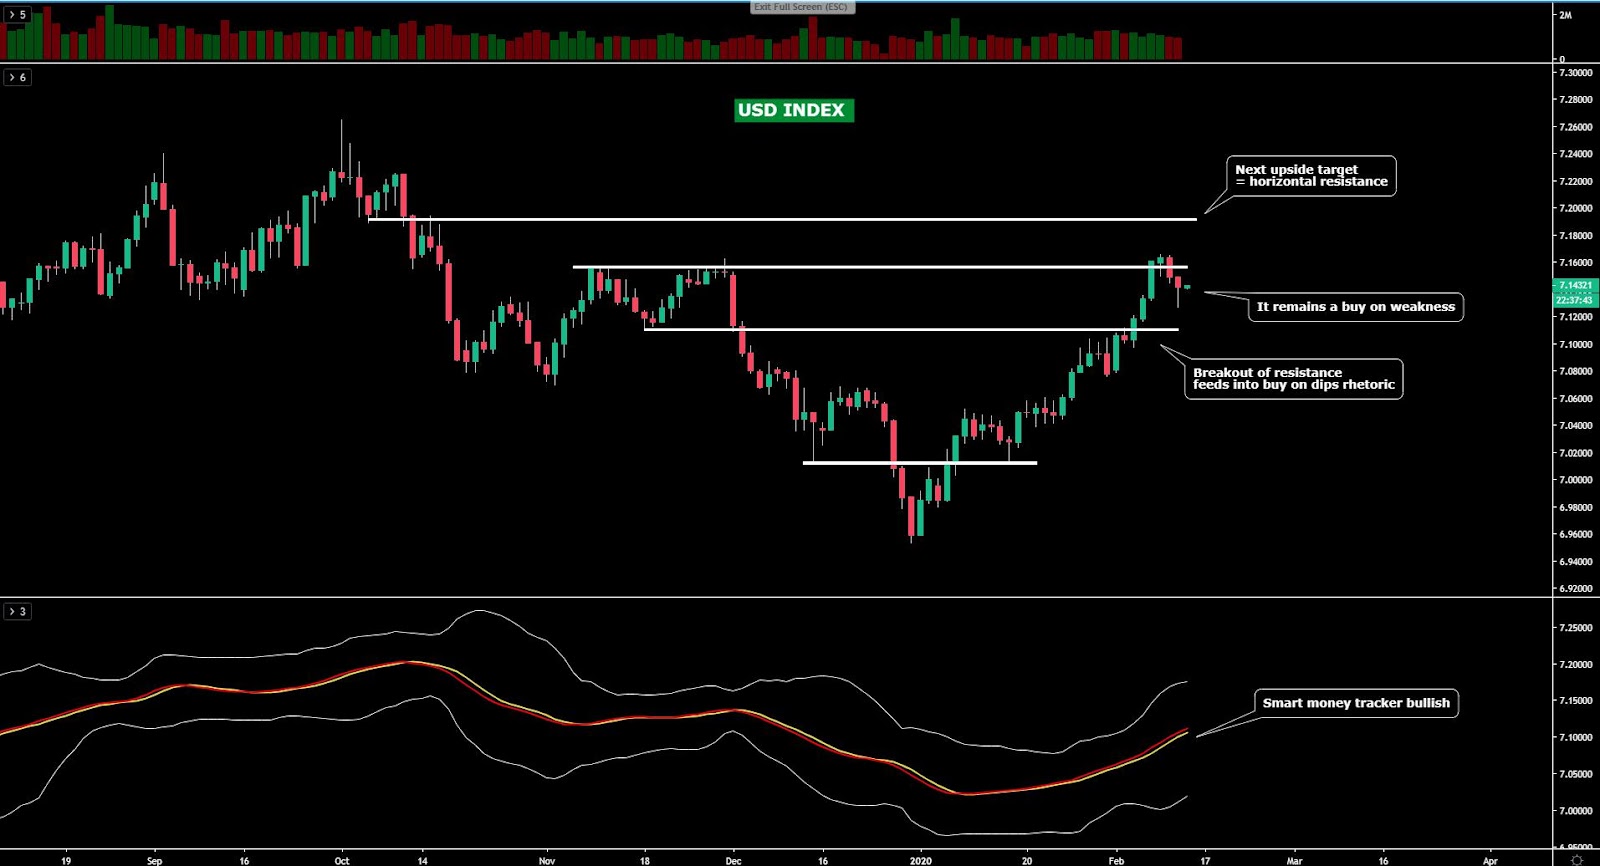
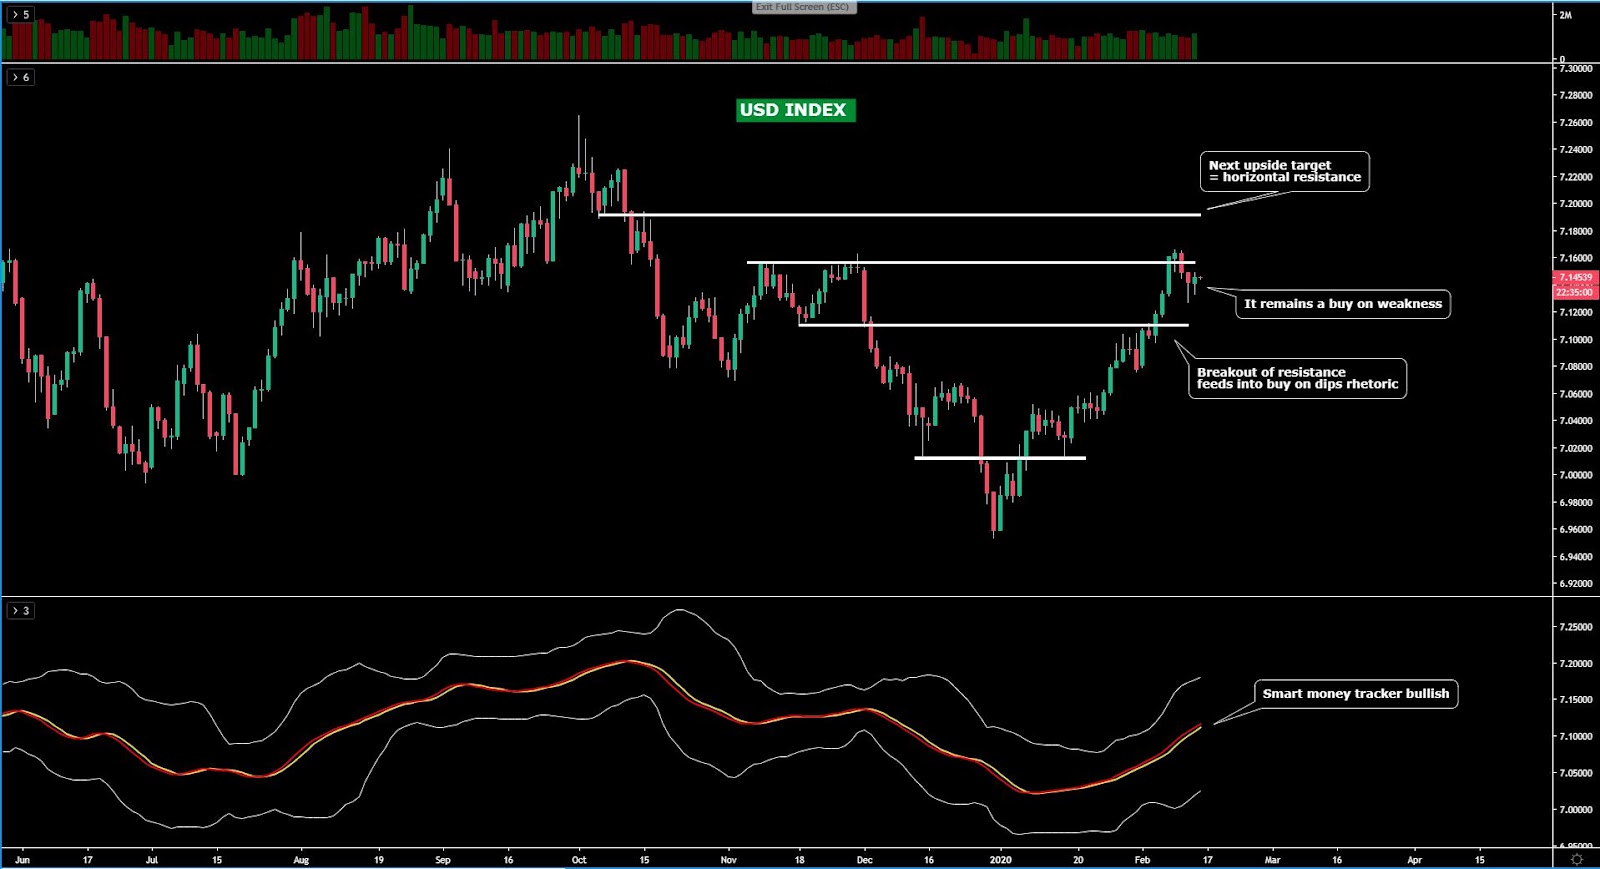
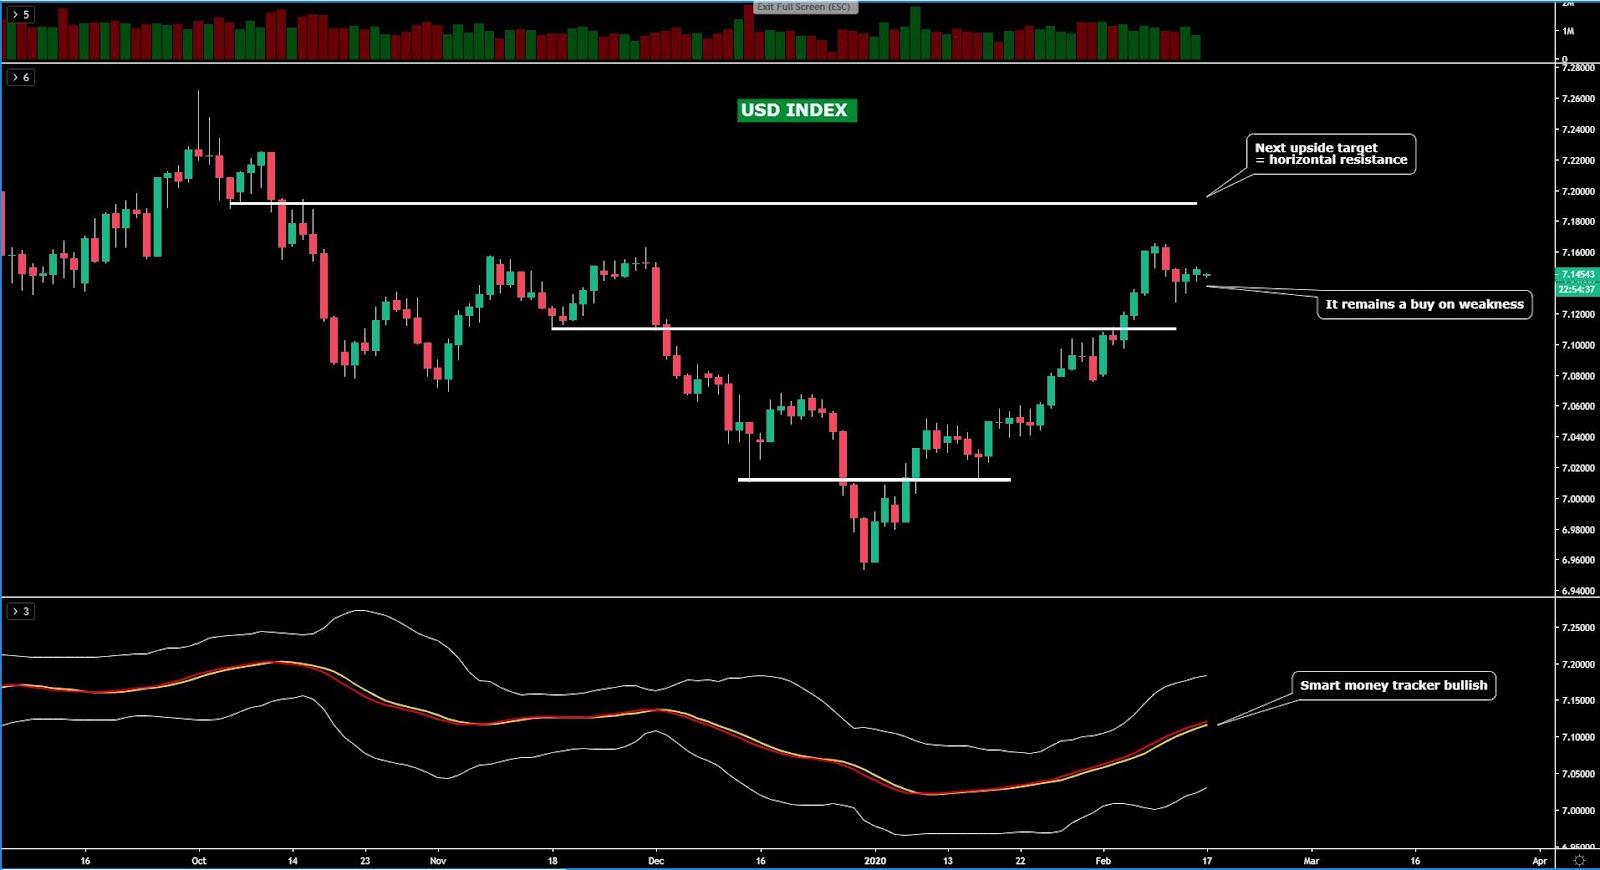
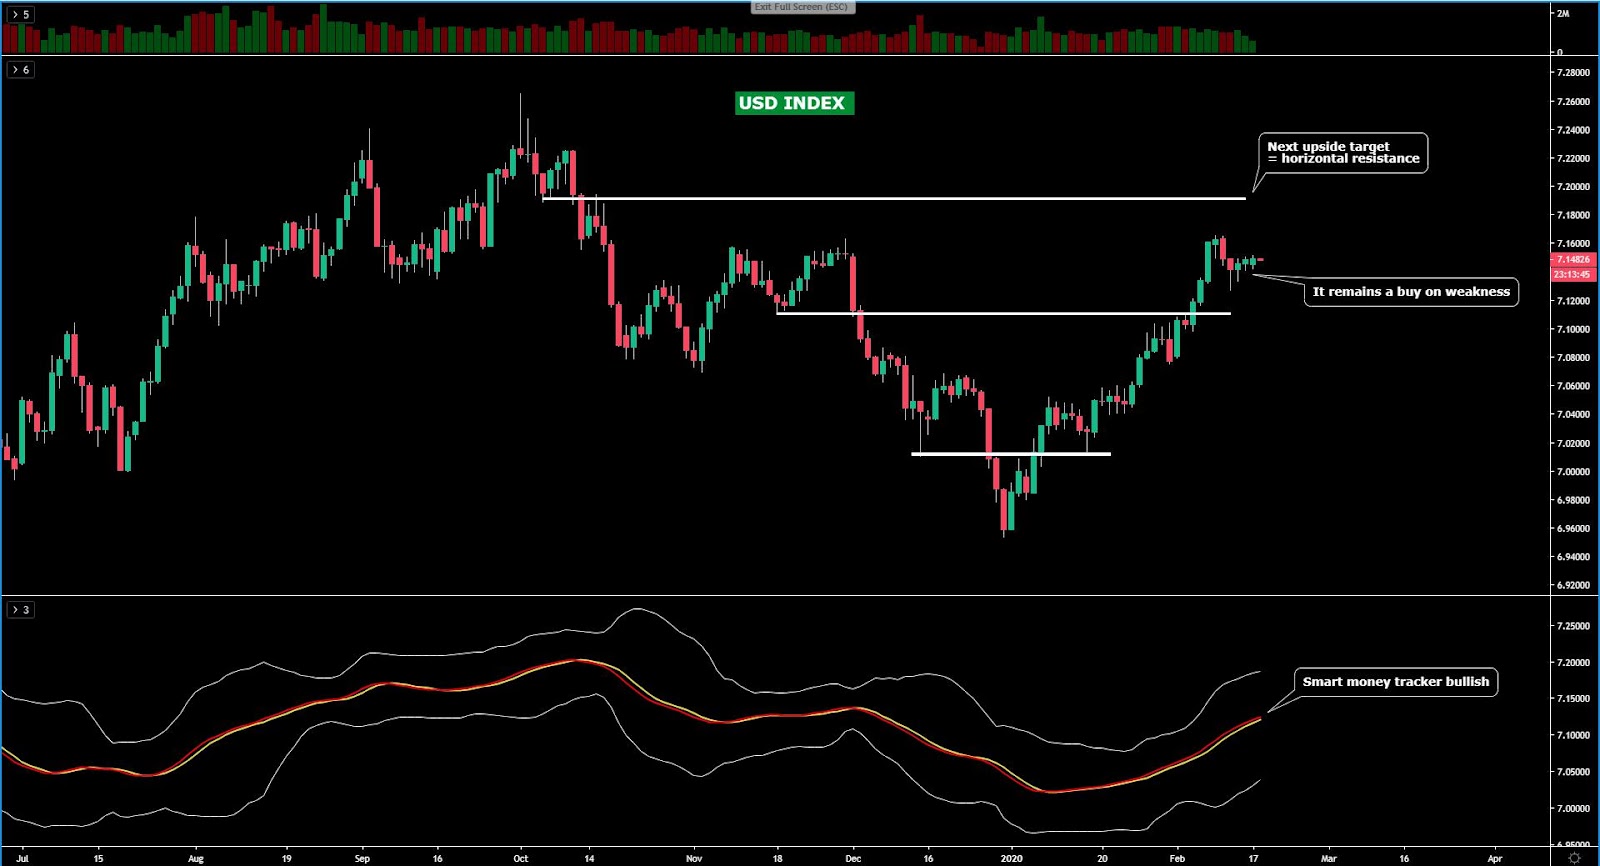
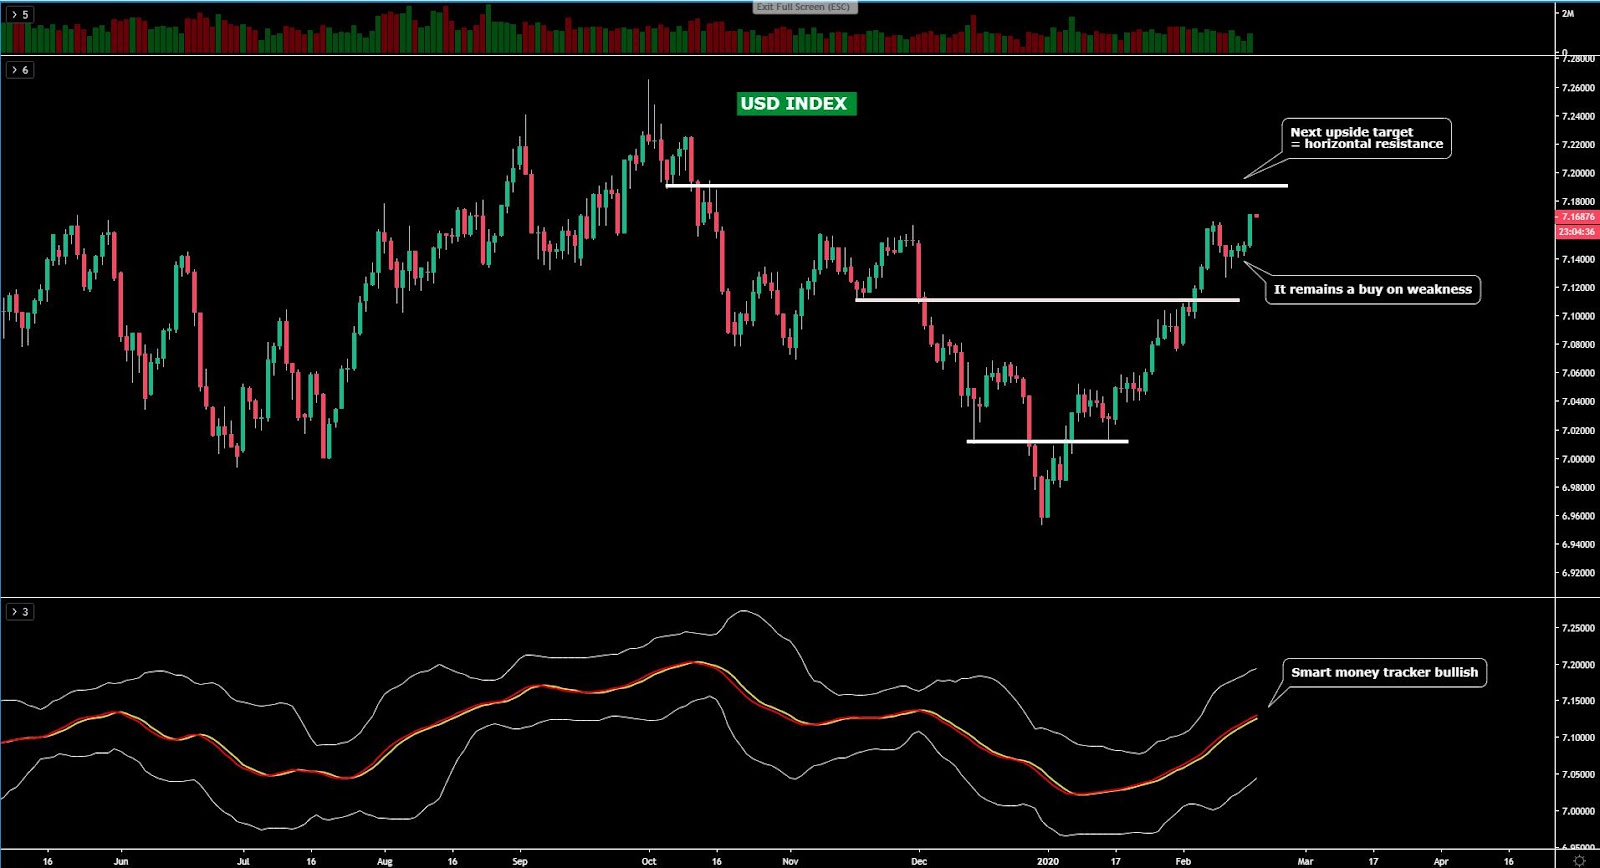
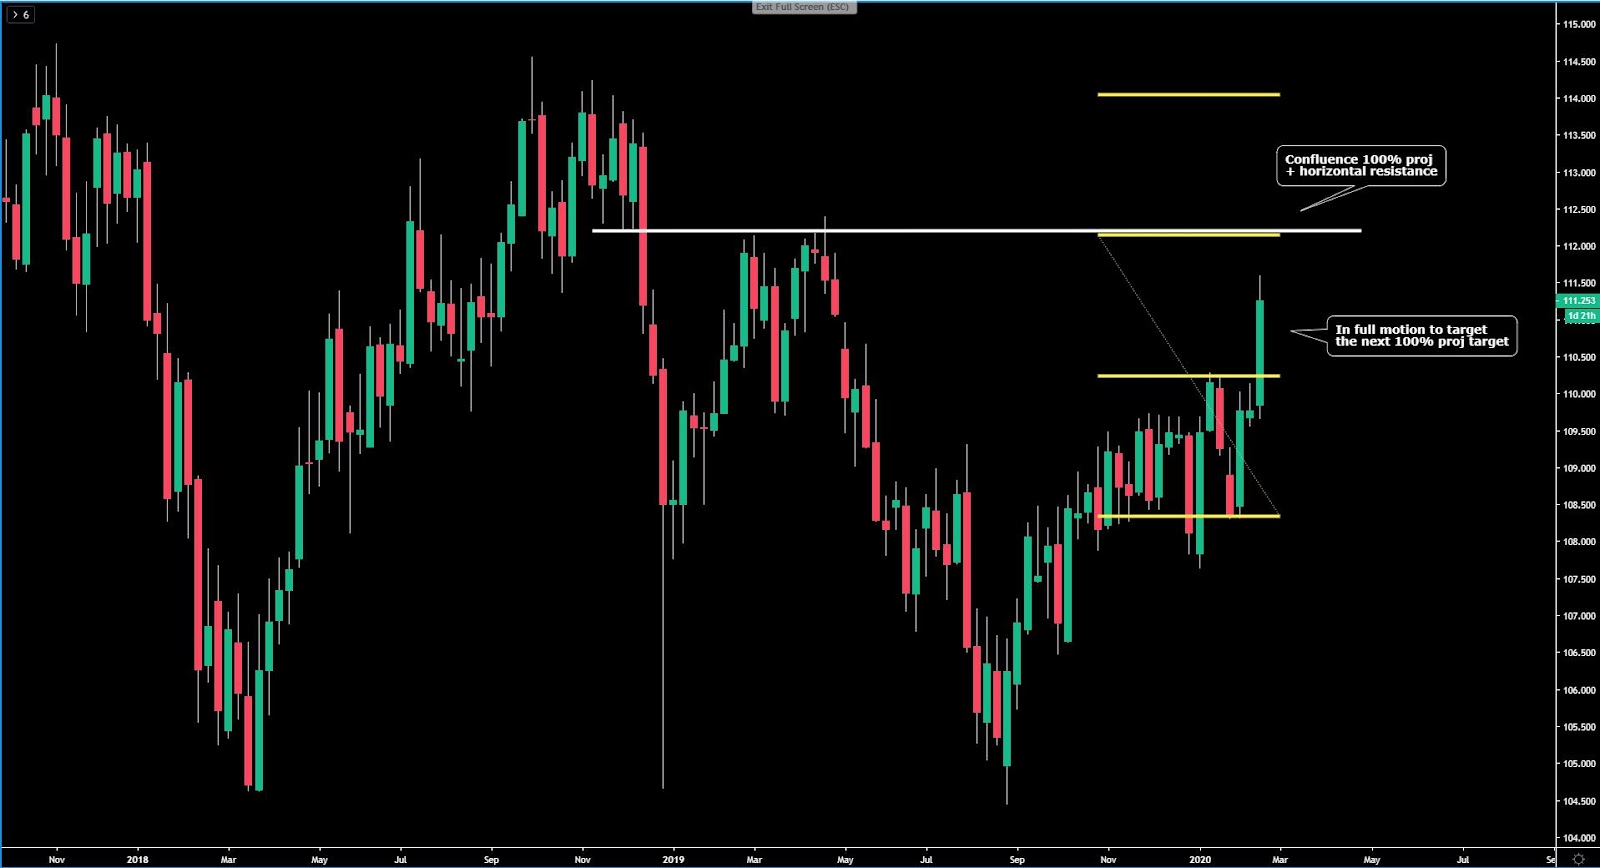
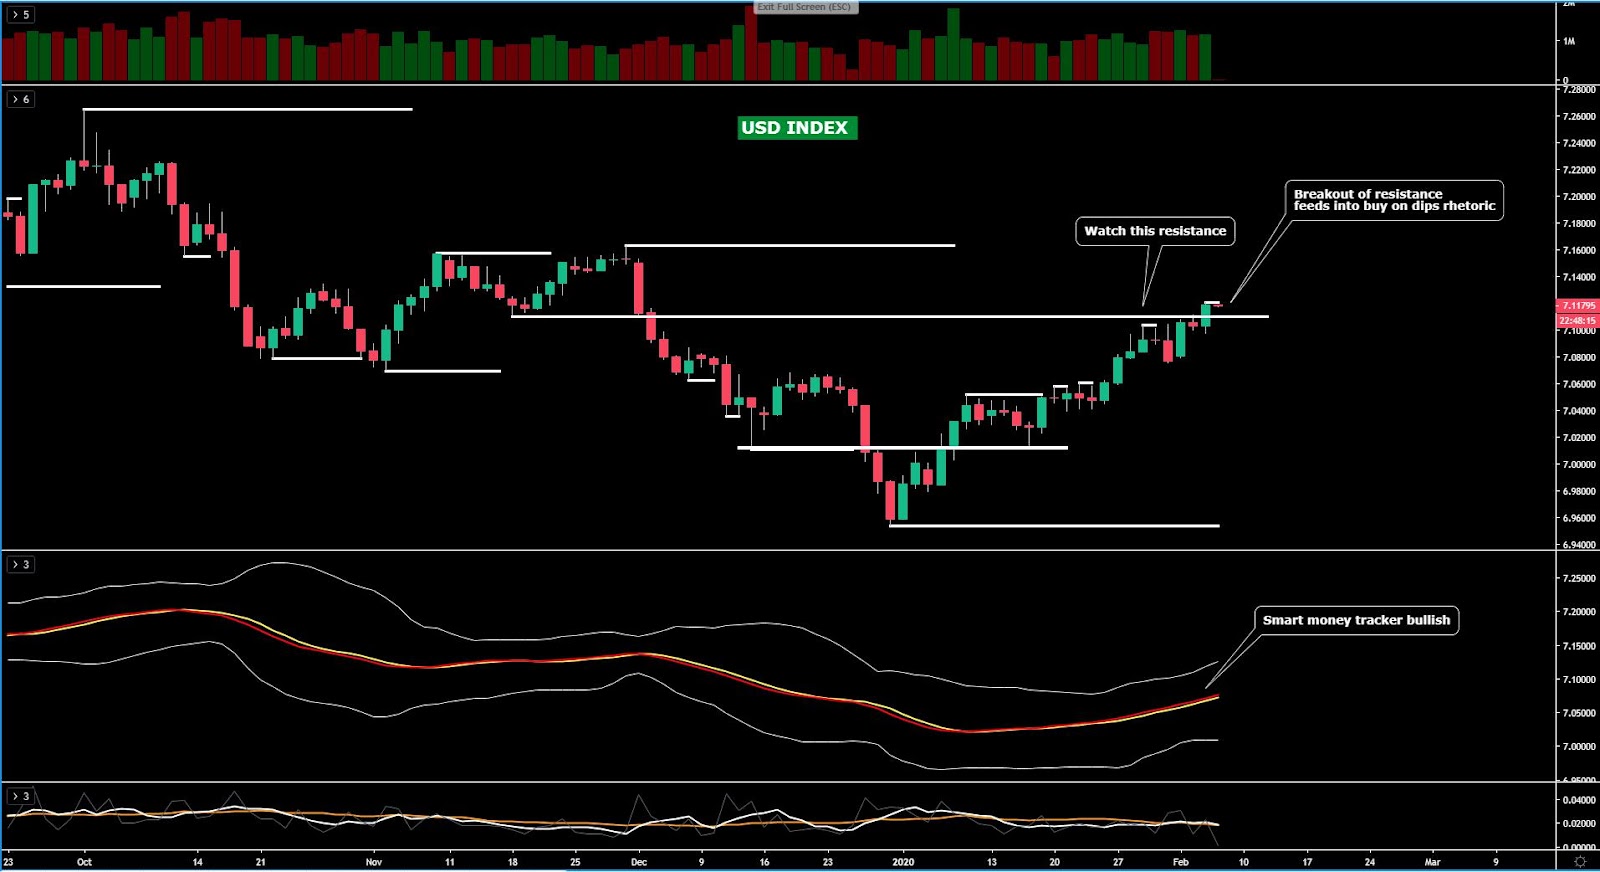
The USD index has, at last, confirmed a technical resolution above a critical resistance point that had led to a pause in the uptrend. However, the steady demand flows have not abated, and as the aggregate flows in the chart below suggest, the is fresh upside potential for a possible extension towards the double top seen through Nov last year, which translates in the prospects of additional gains to the tune of 0.8% from the current levels, so not too shabby. The technical indicators via price structure and bullish momentum point at the bull bias to stay intact.
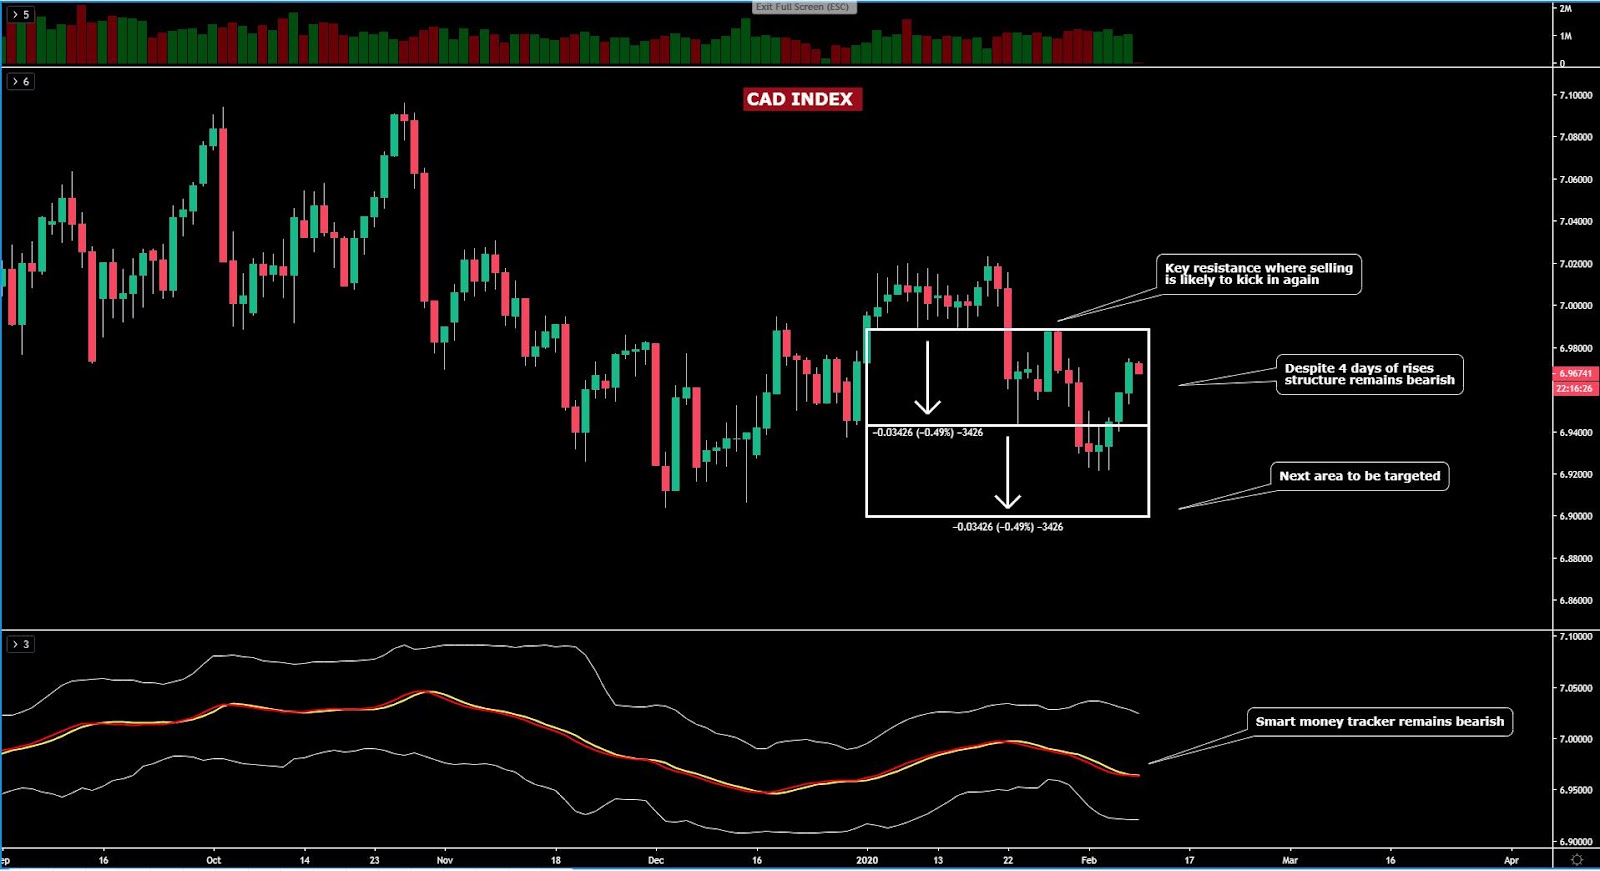
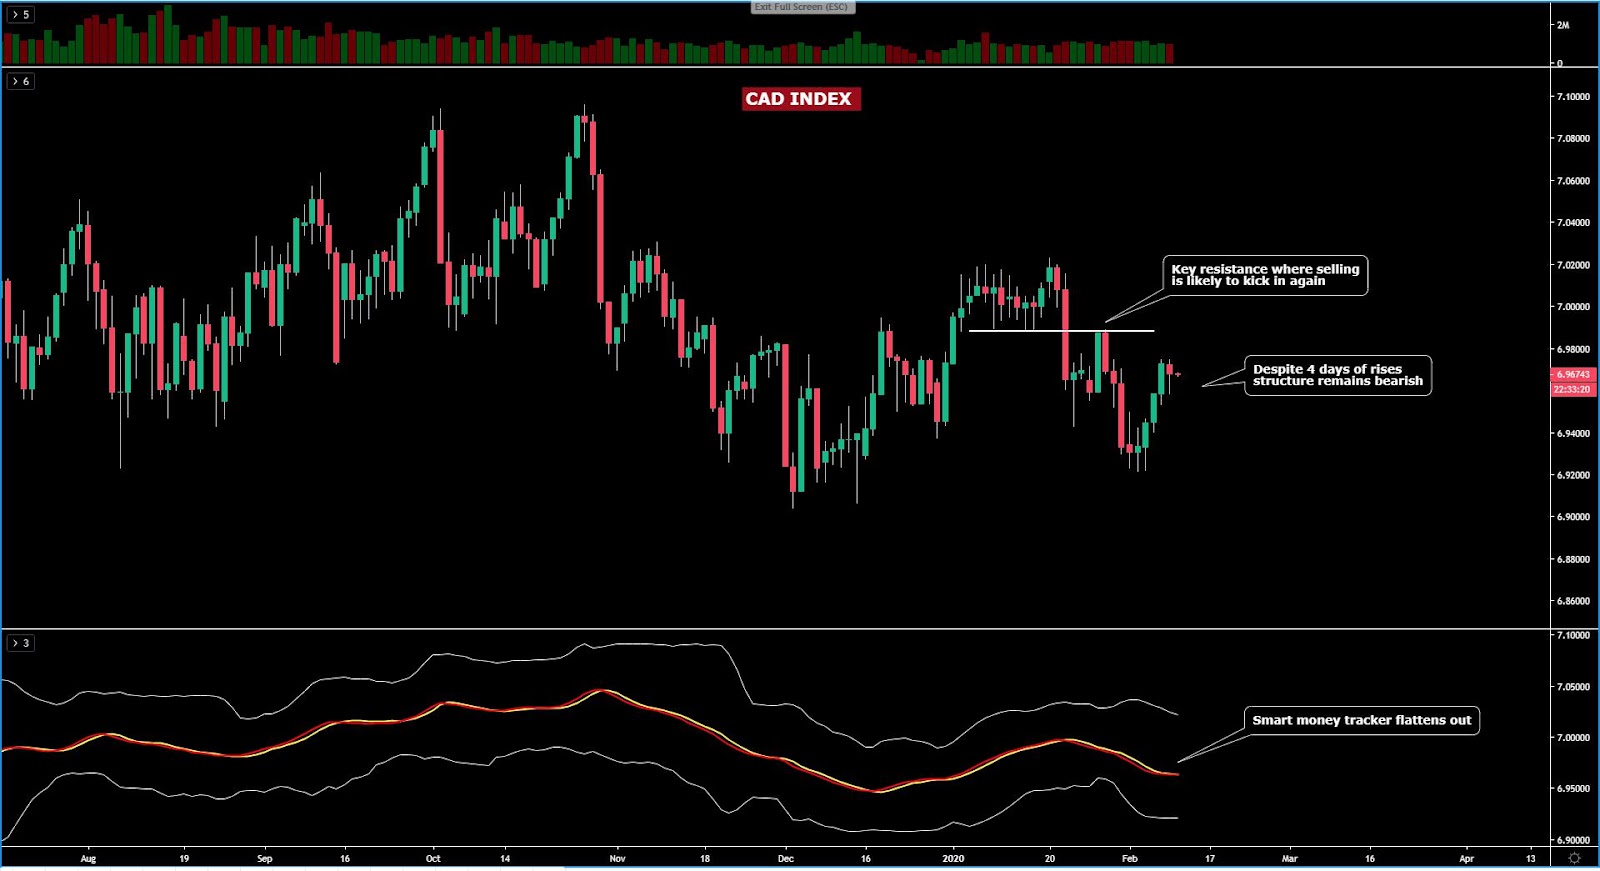
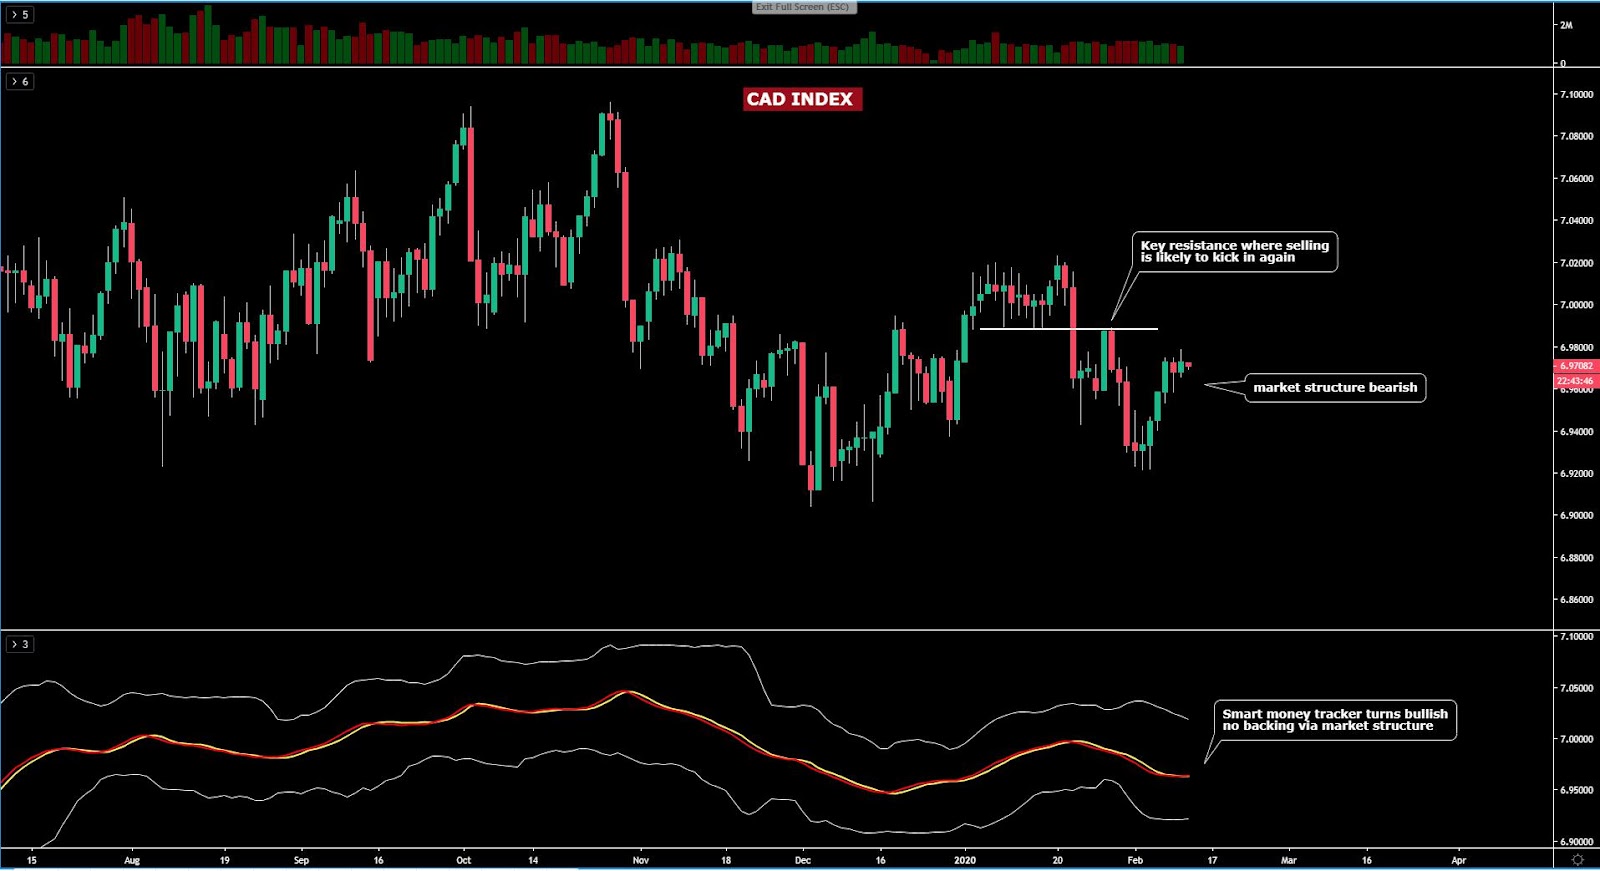
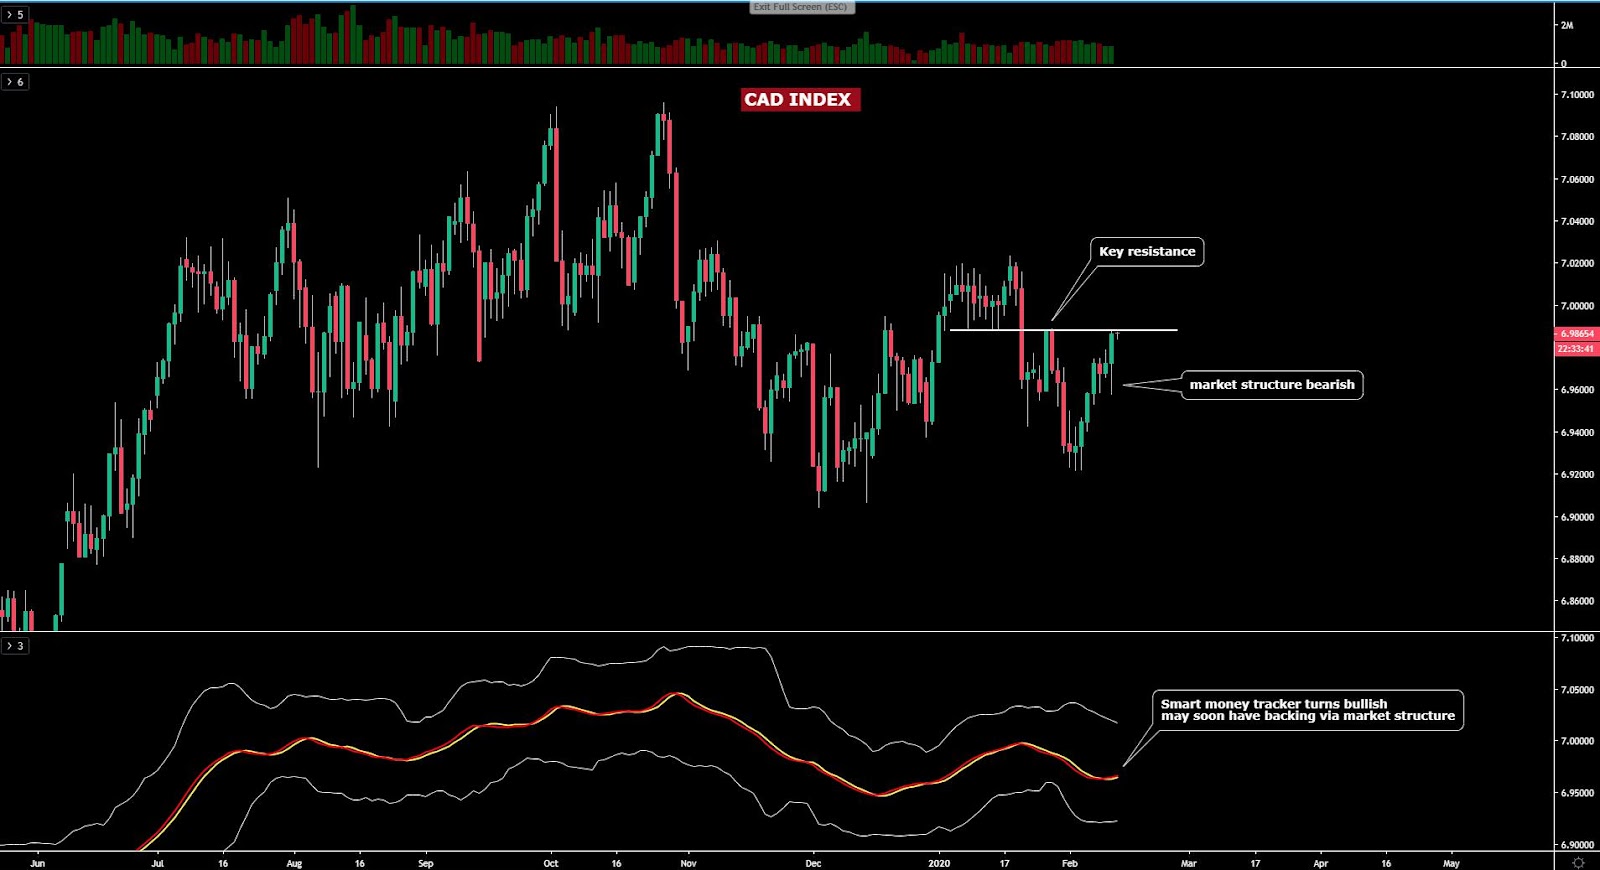
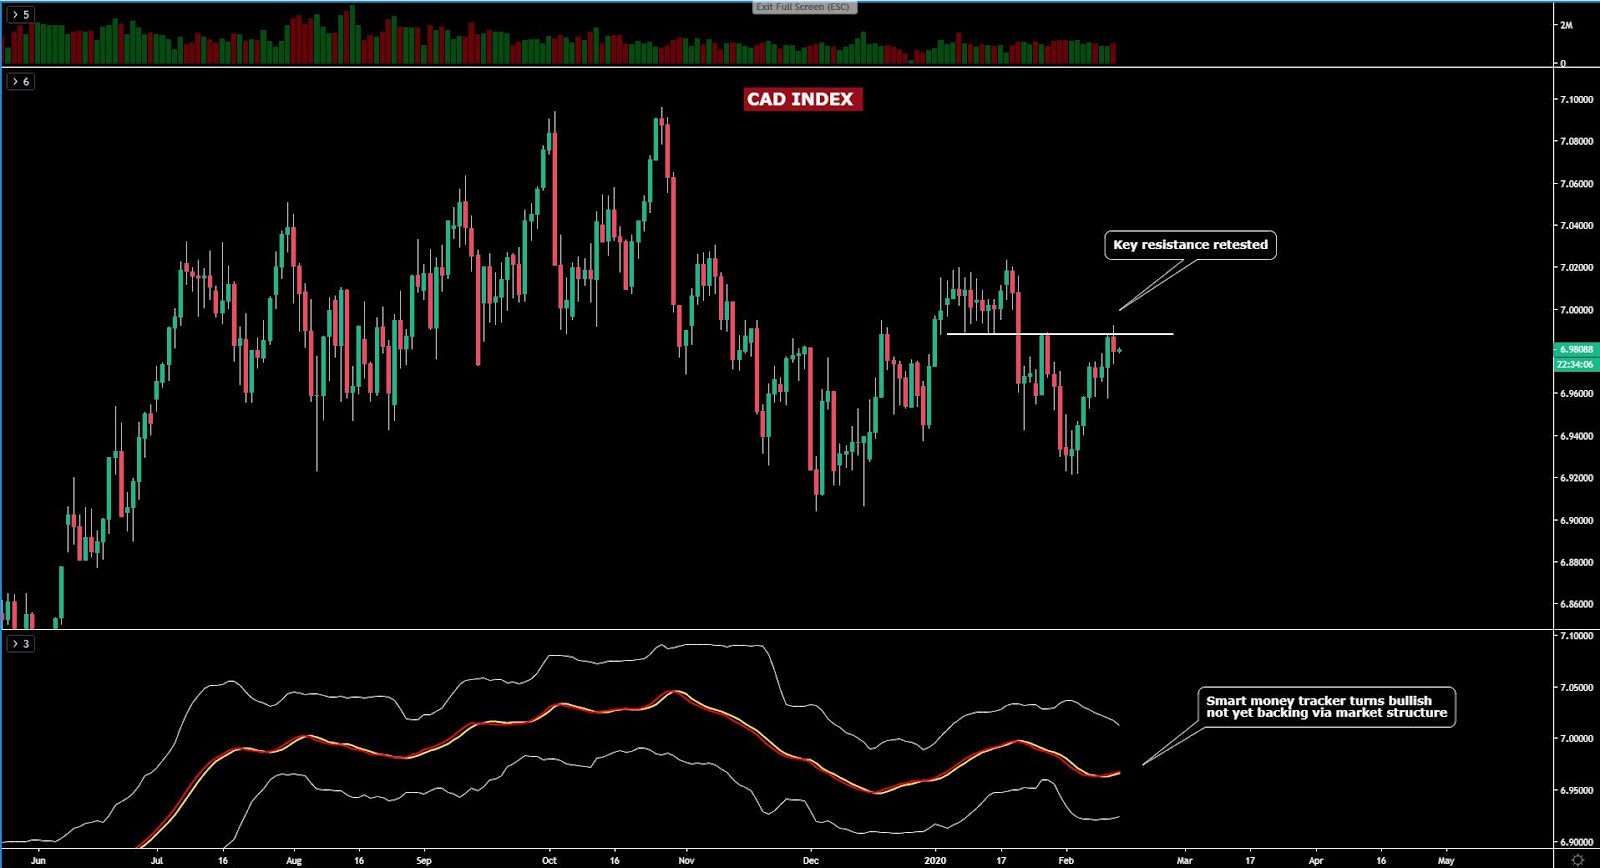
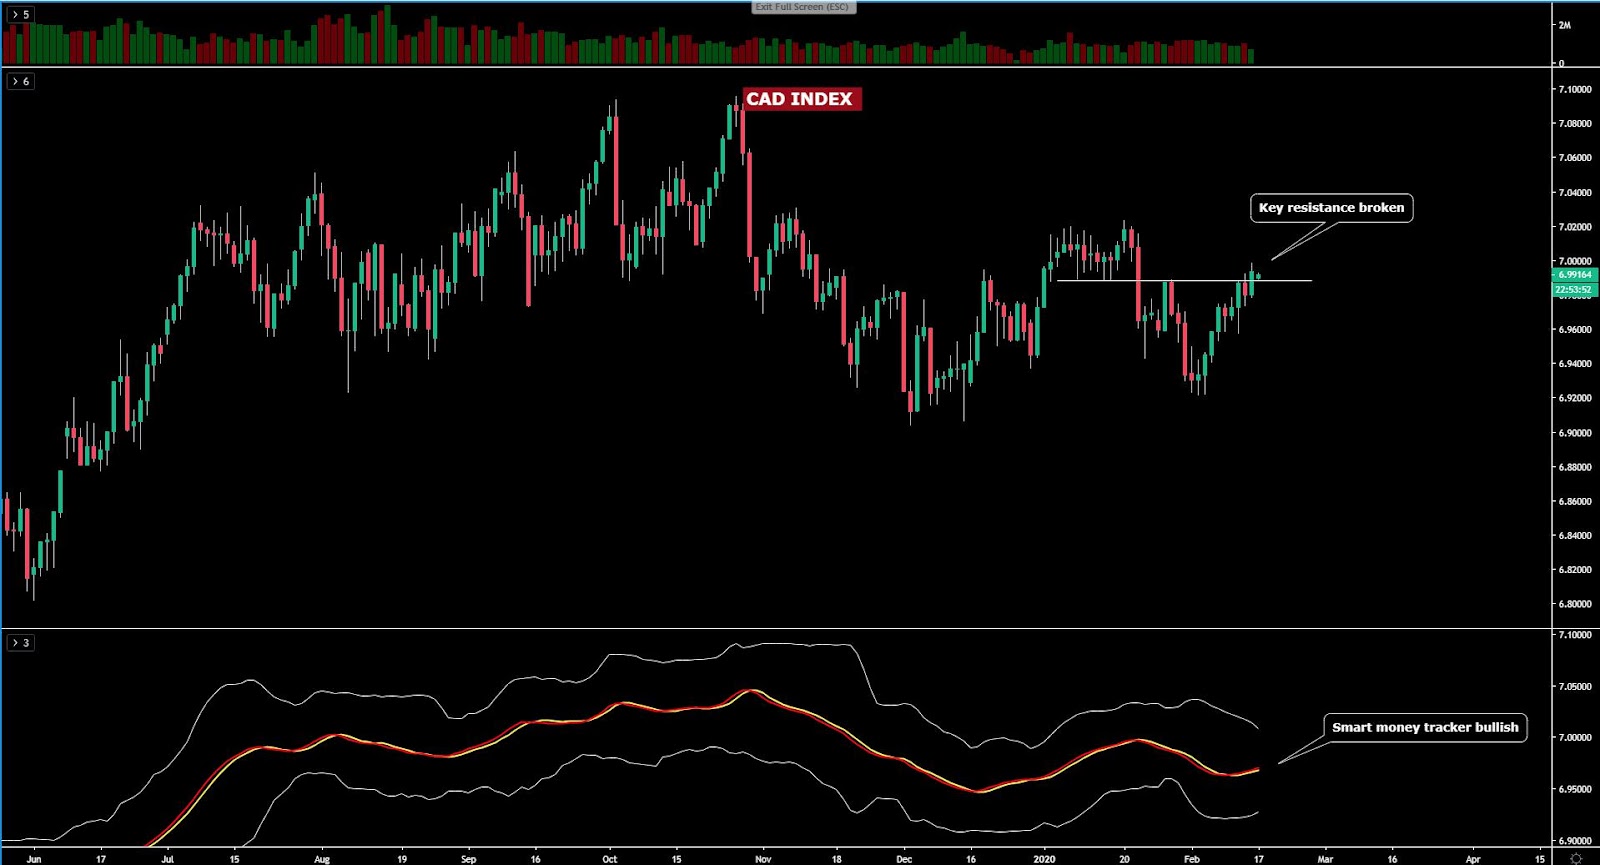
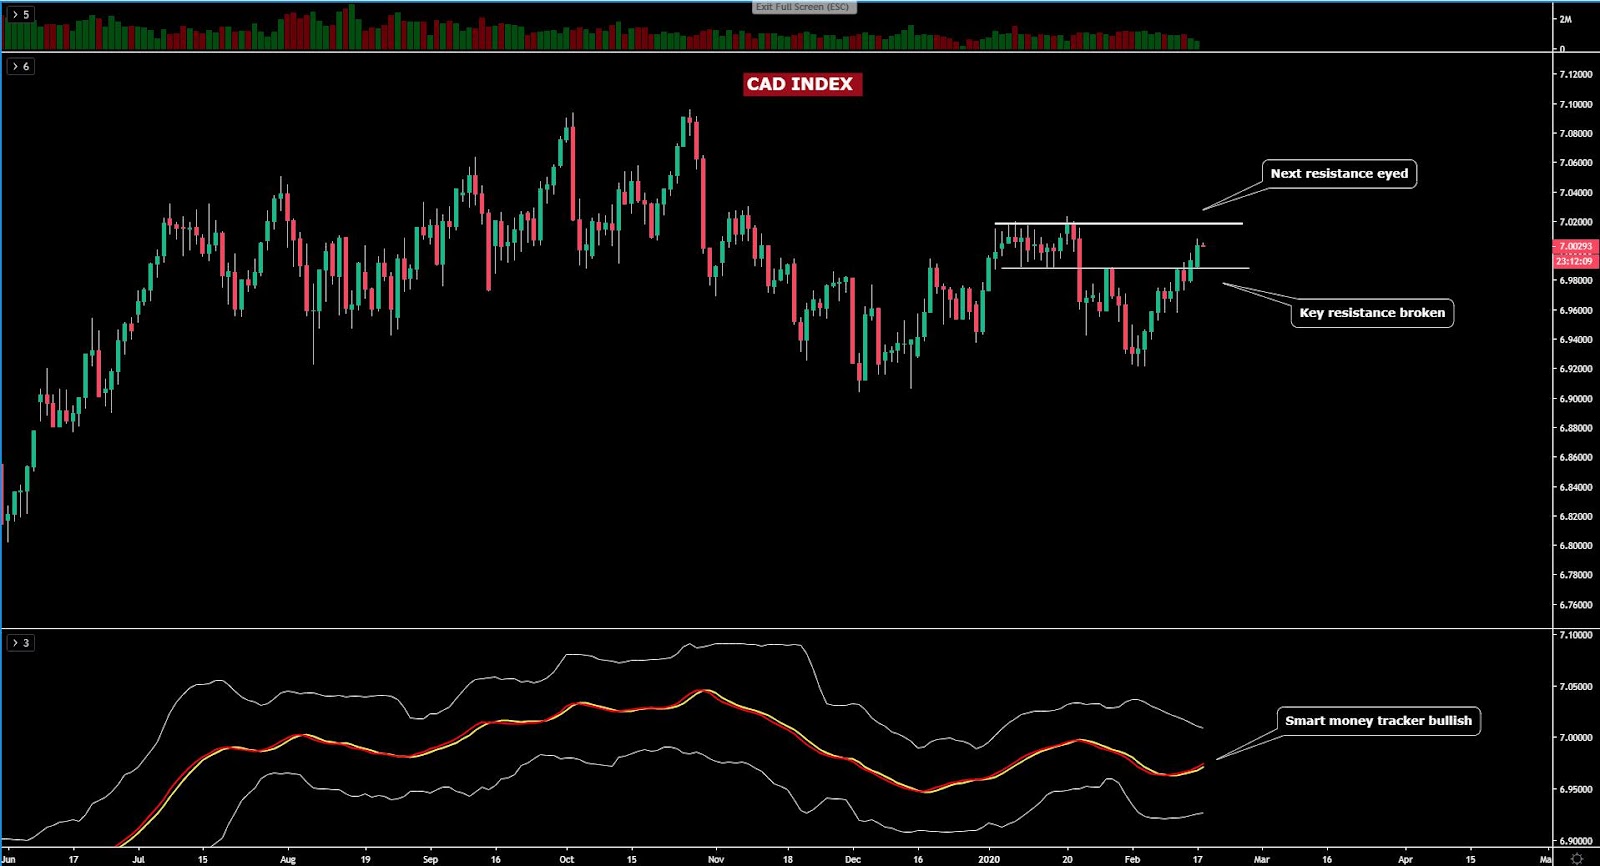
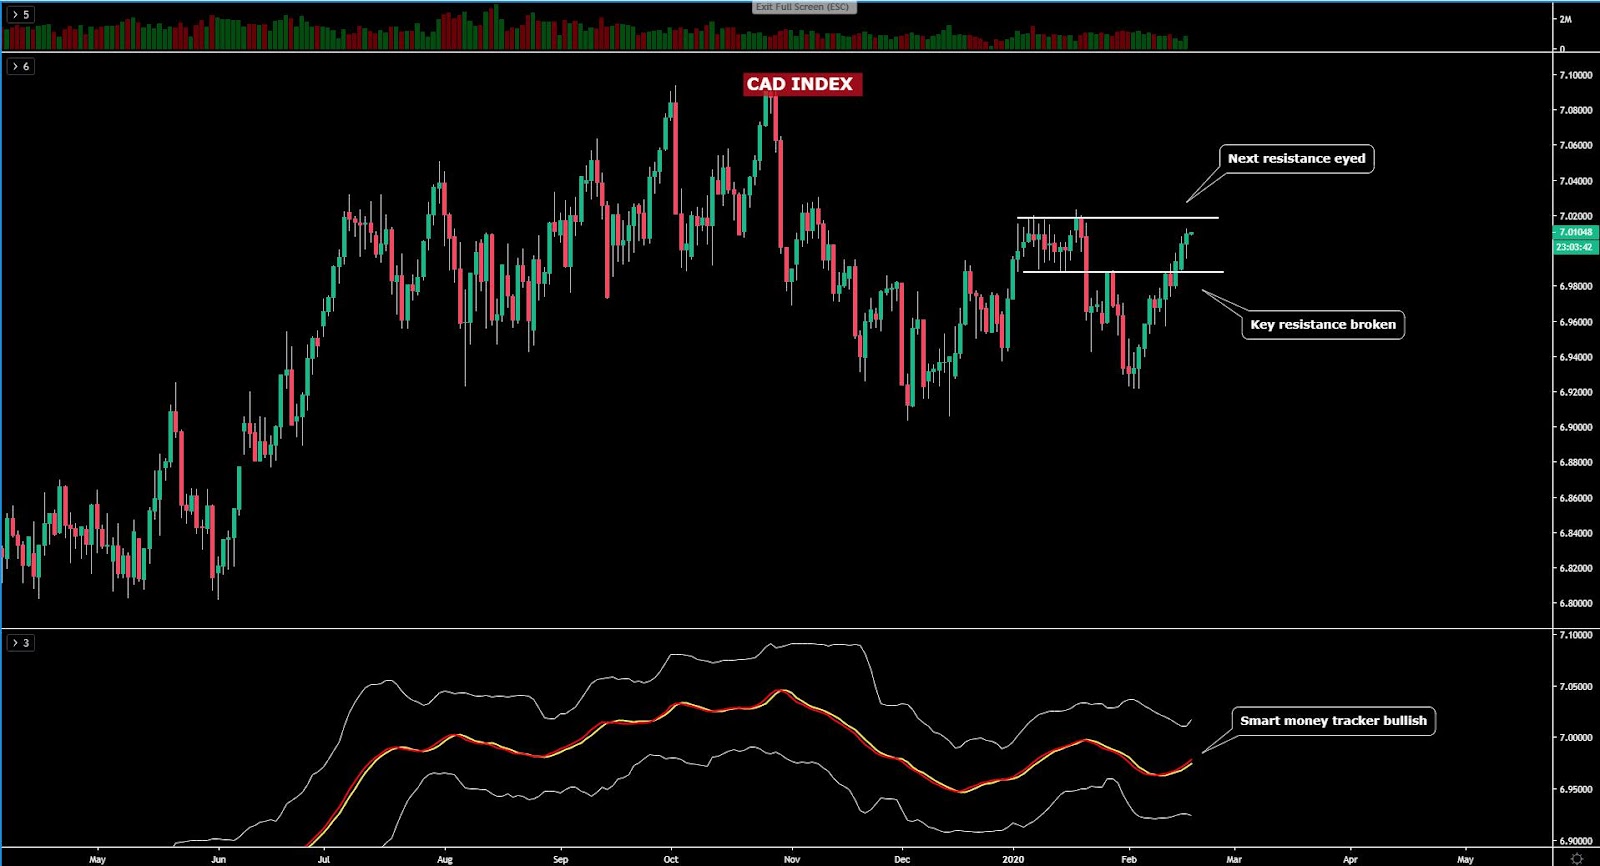
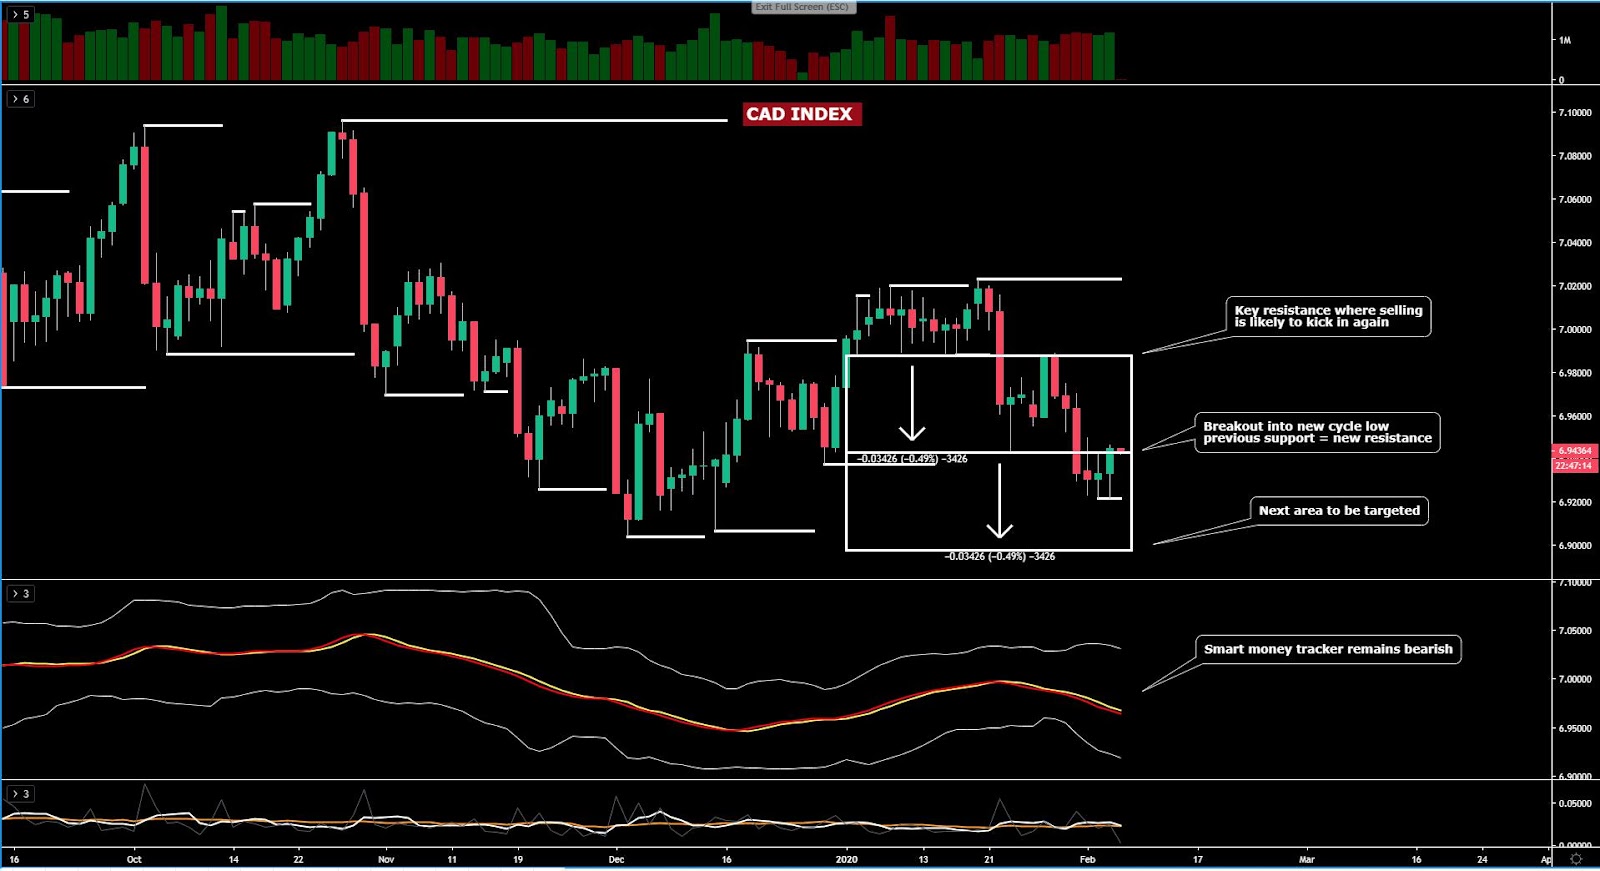
The CAD index, while rebounding strongly off the lows and printing a bullish engulfing pattern, still finds itself trading in a well established bearish trend. Therefore, the risk of further buying is likely to face substantial oppression as the price structure and the momentum via the smart money tracker are both pointing to more losses ahead. My base case is that the index is set to find further follow through continuation as part of its ongoing bearish cycle in a descend that may be targeting the next 100% projection target at the Dec double bottom.
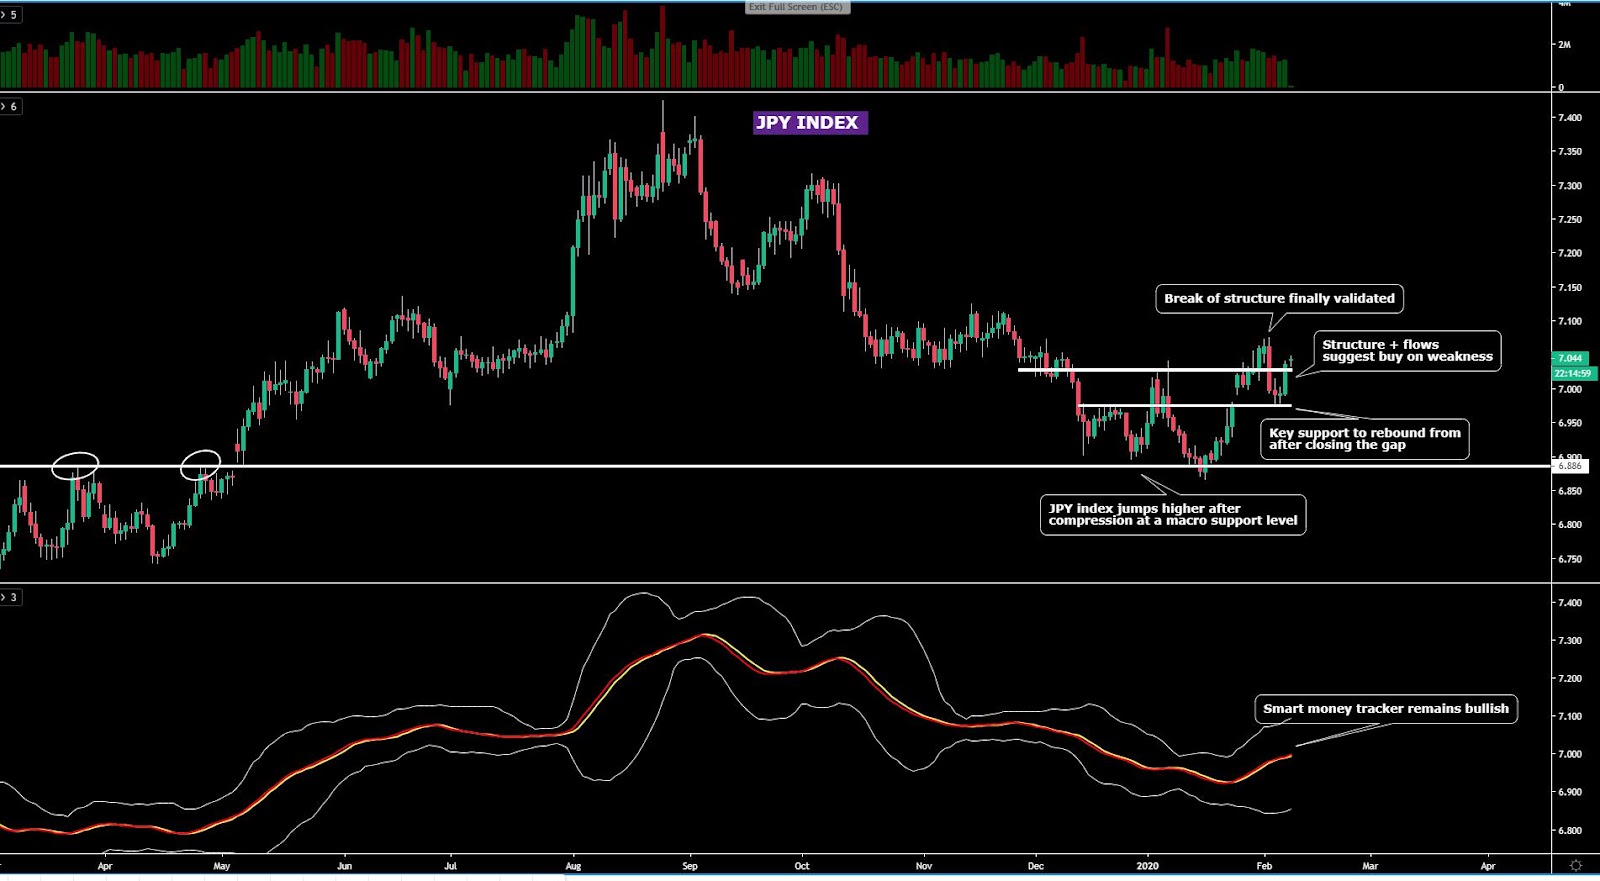
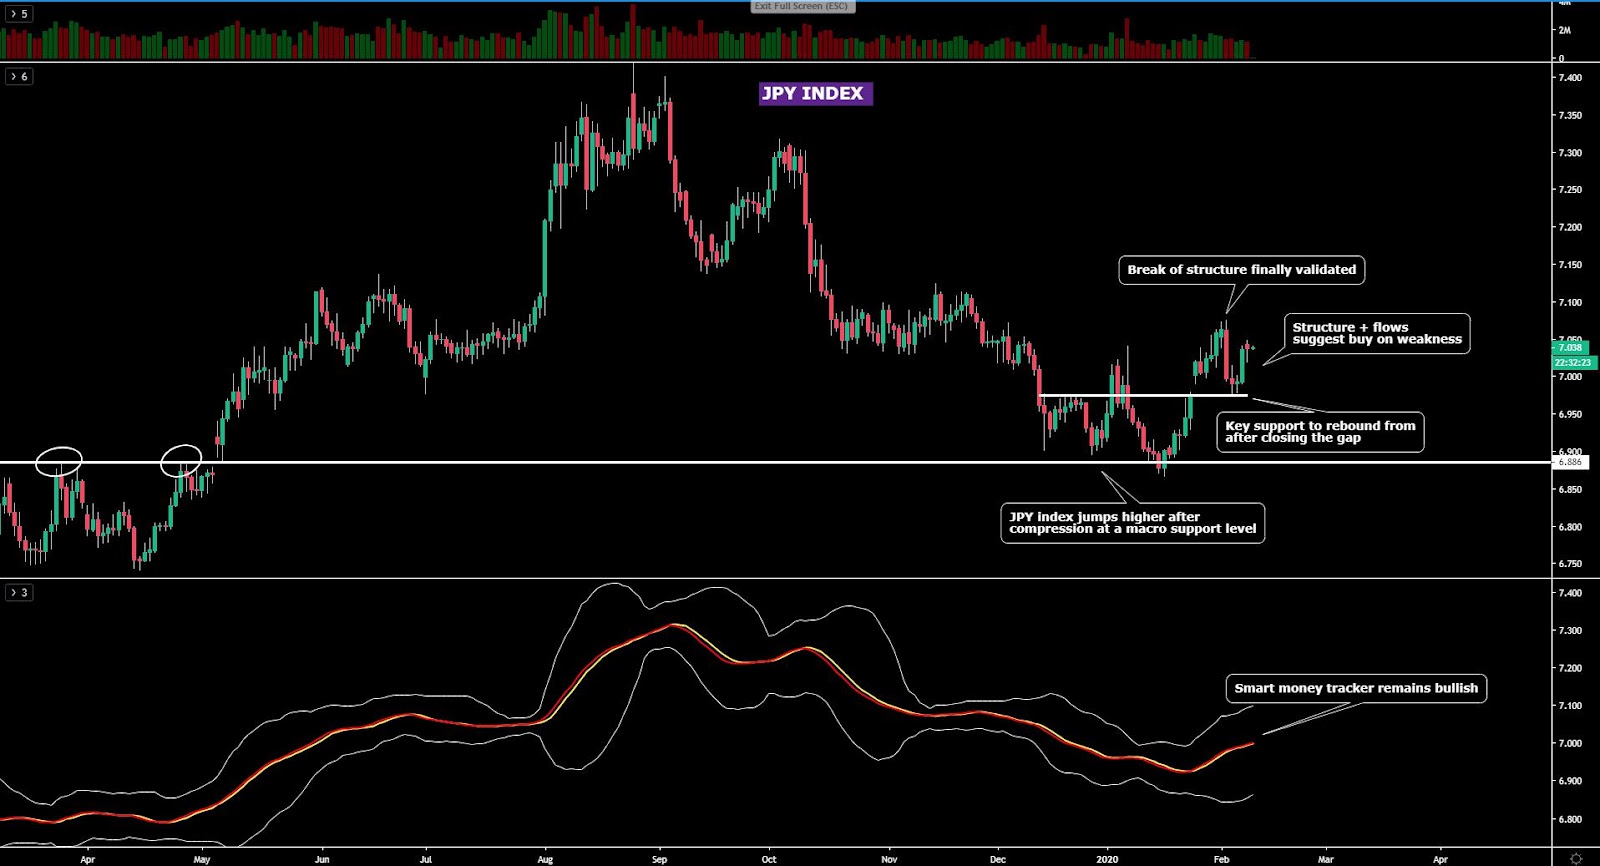
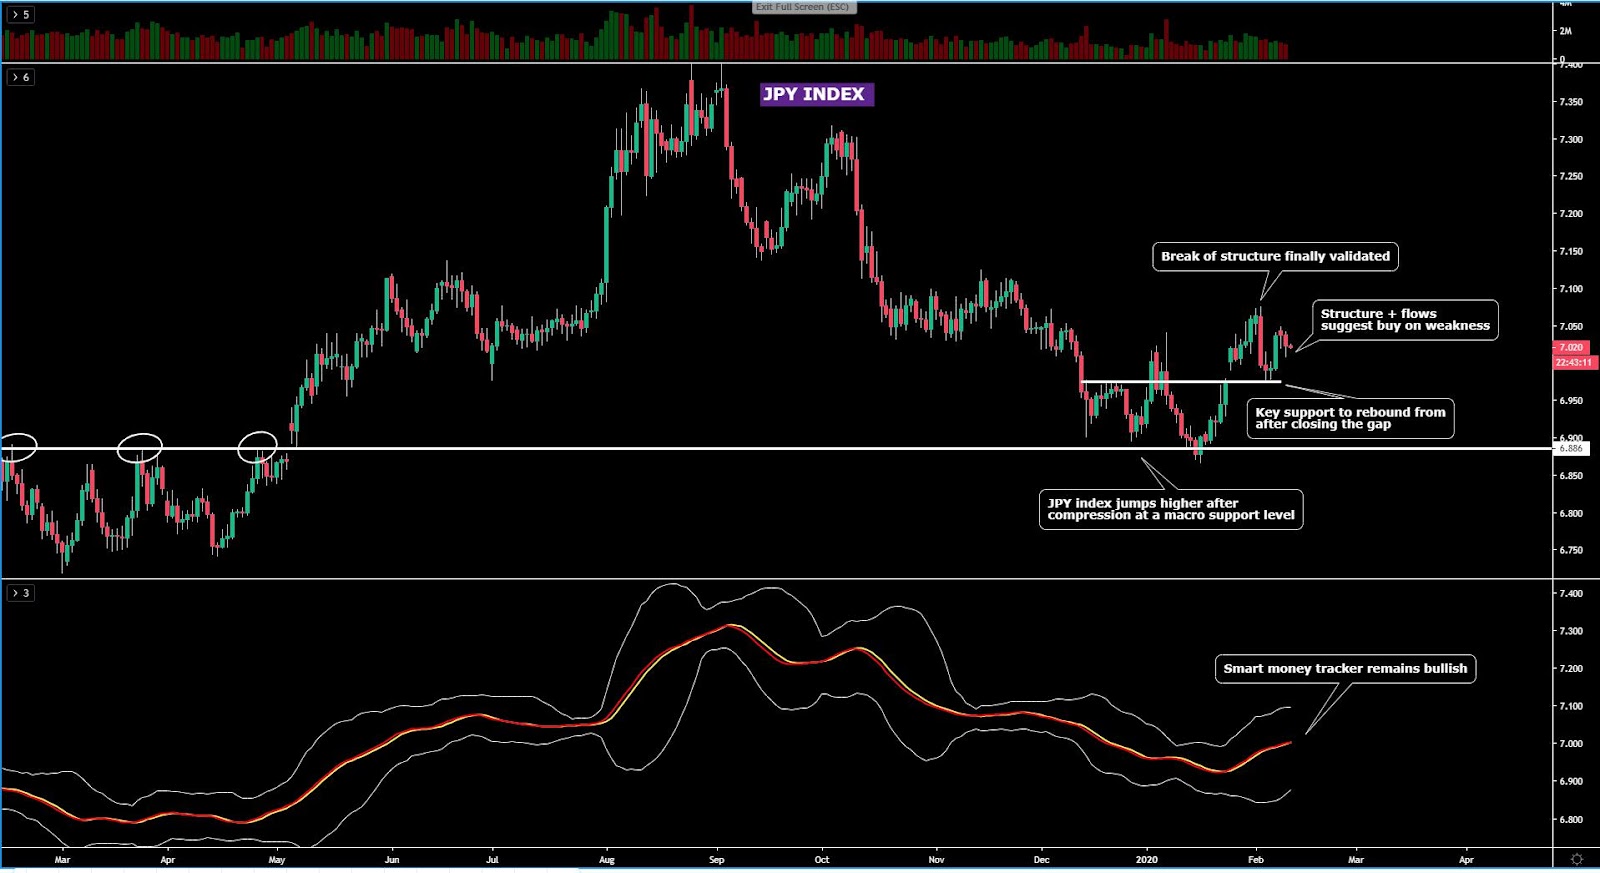
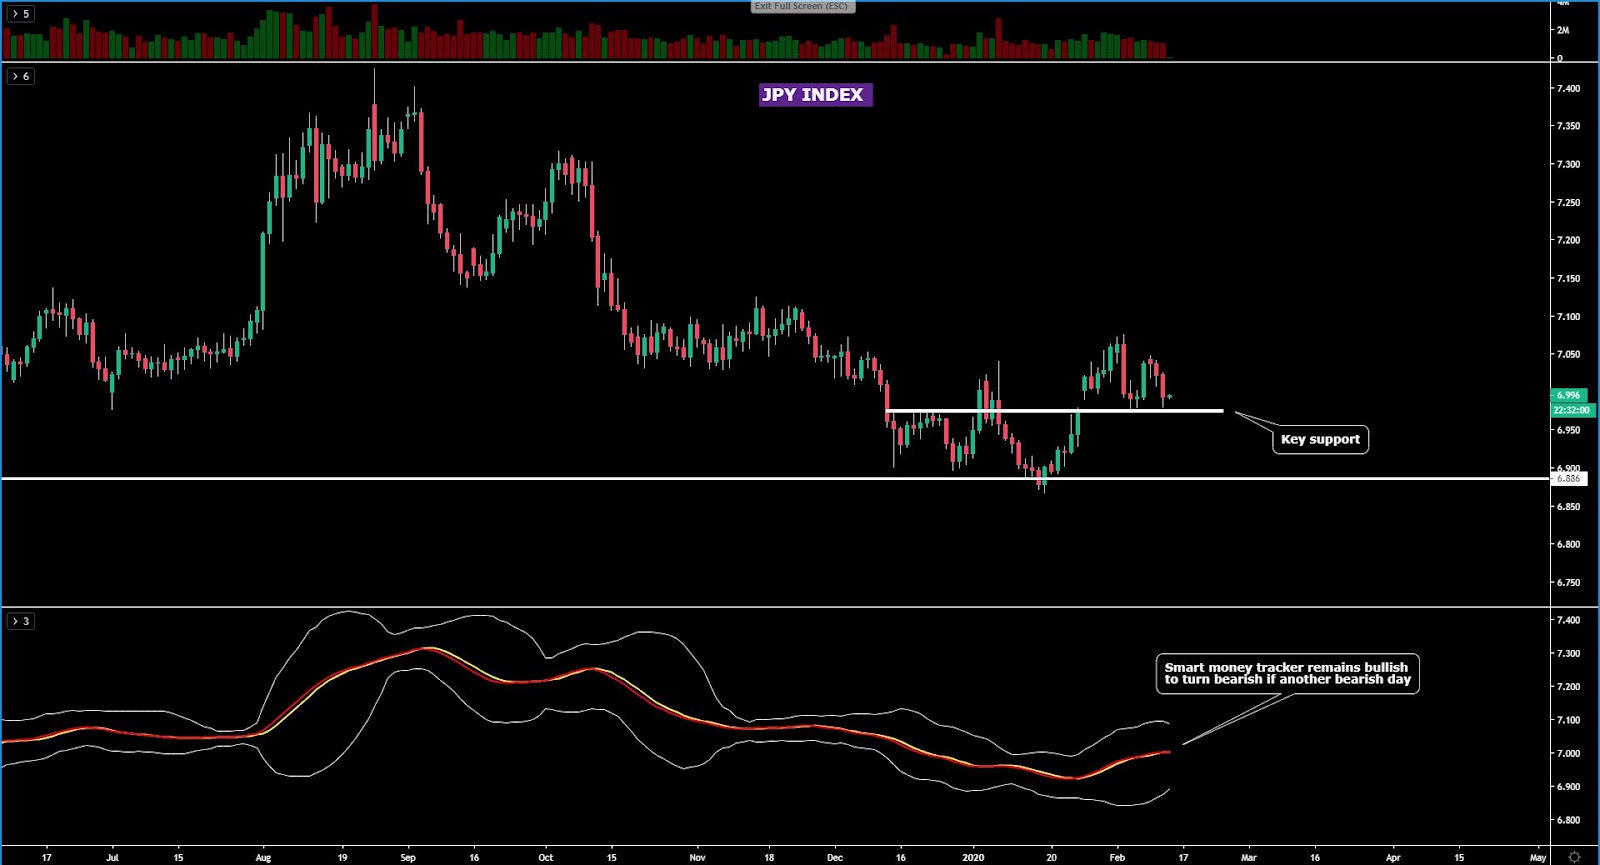
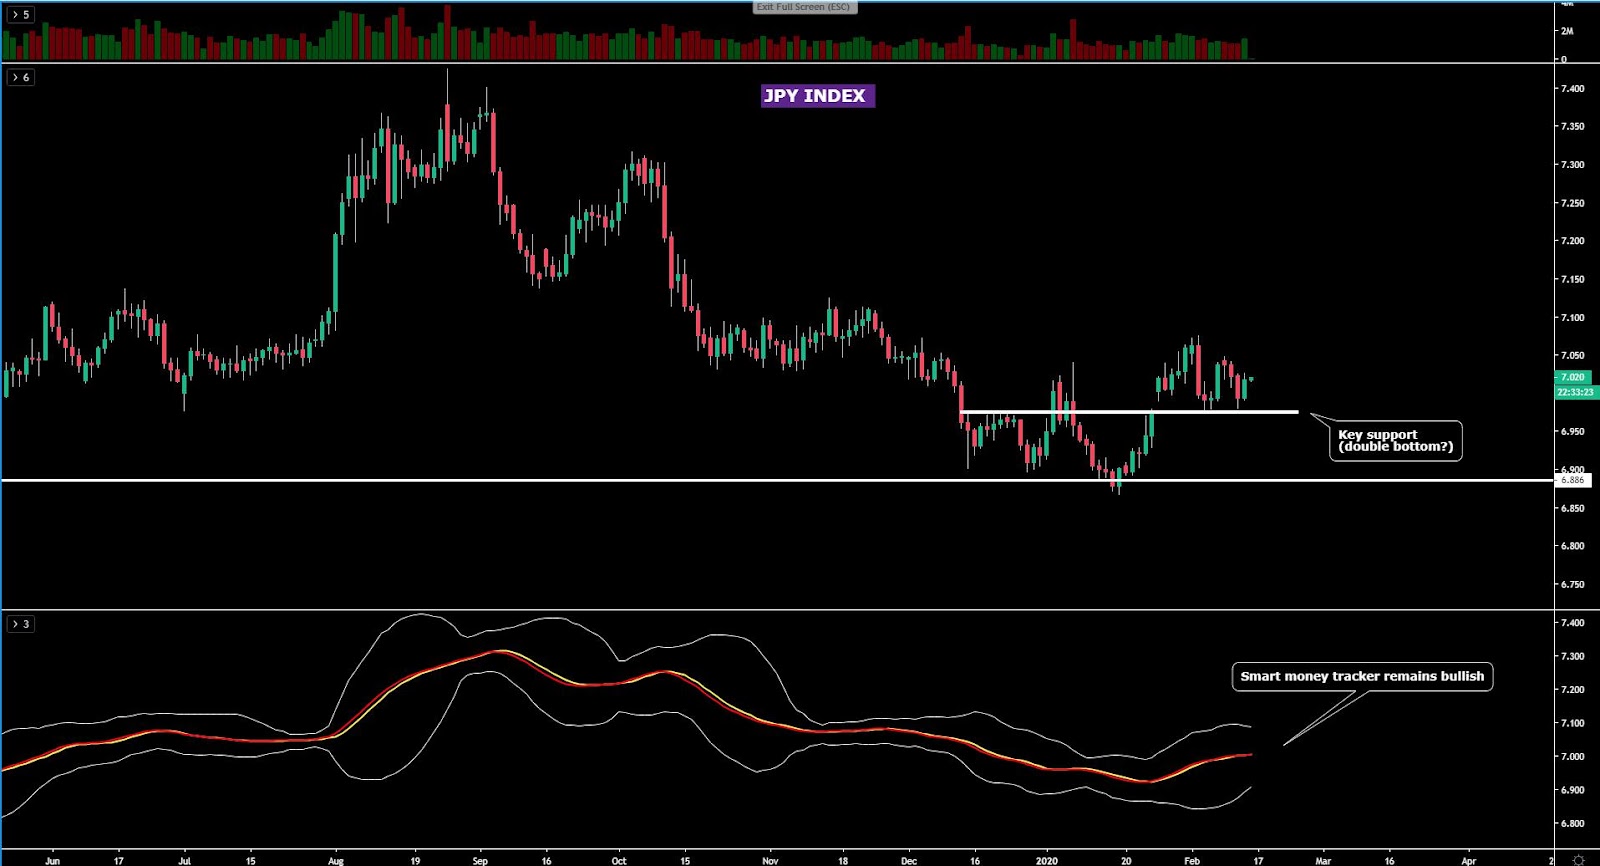
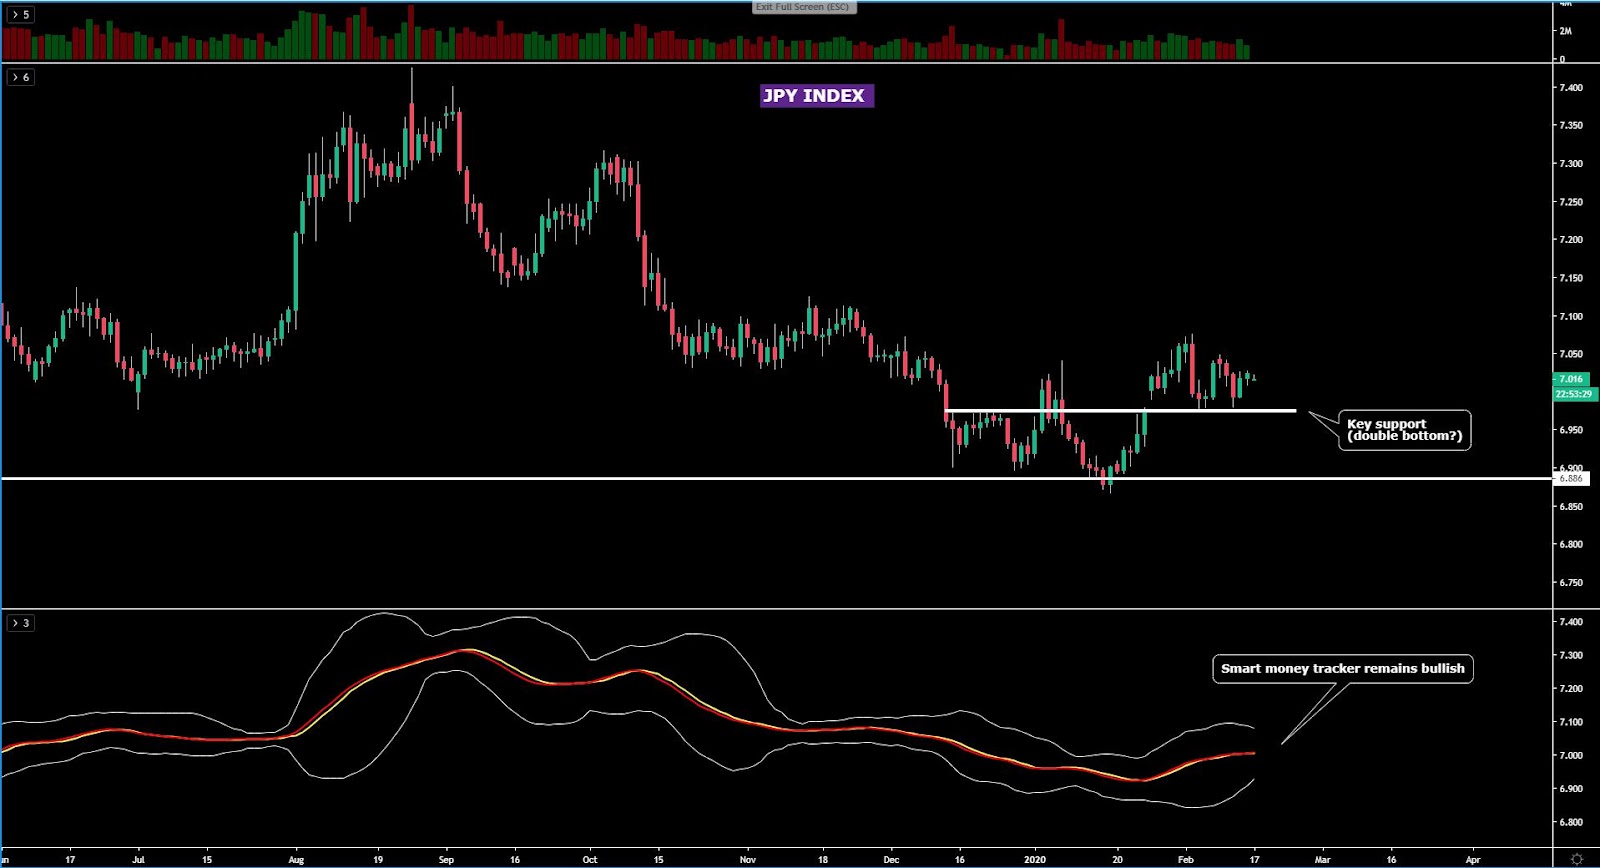
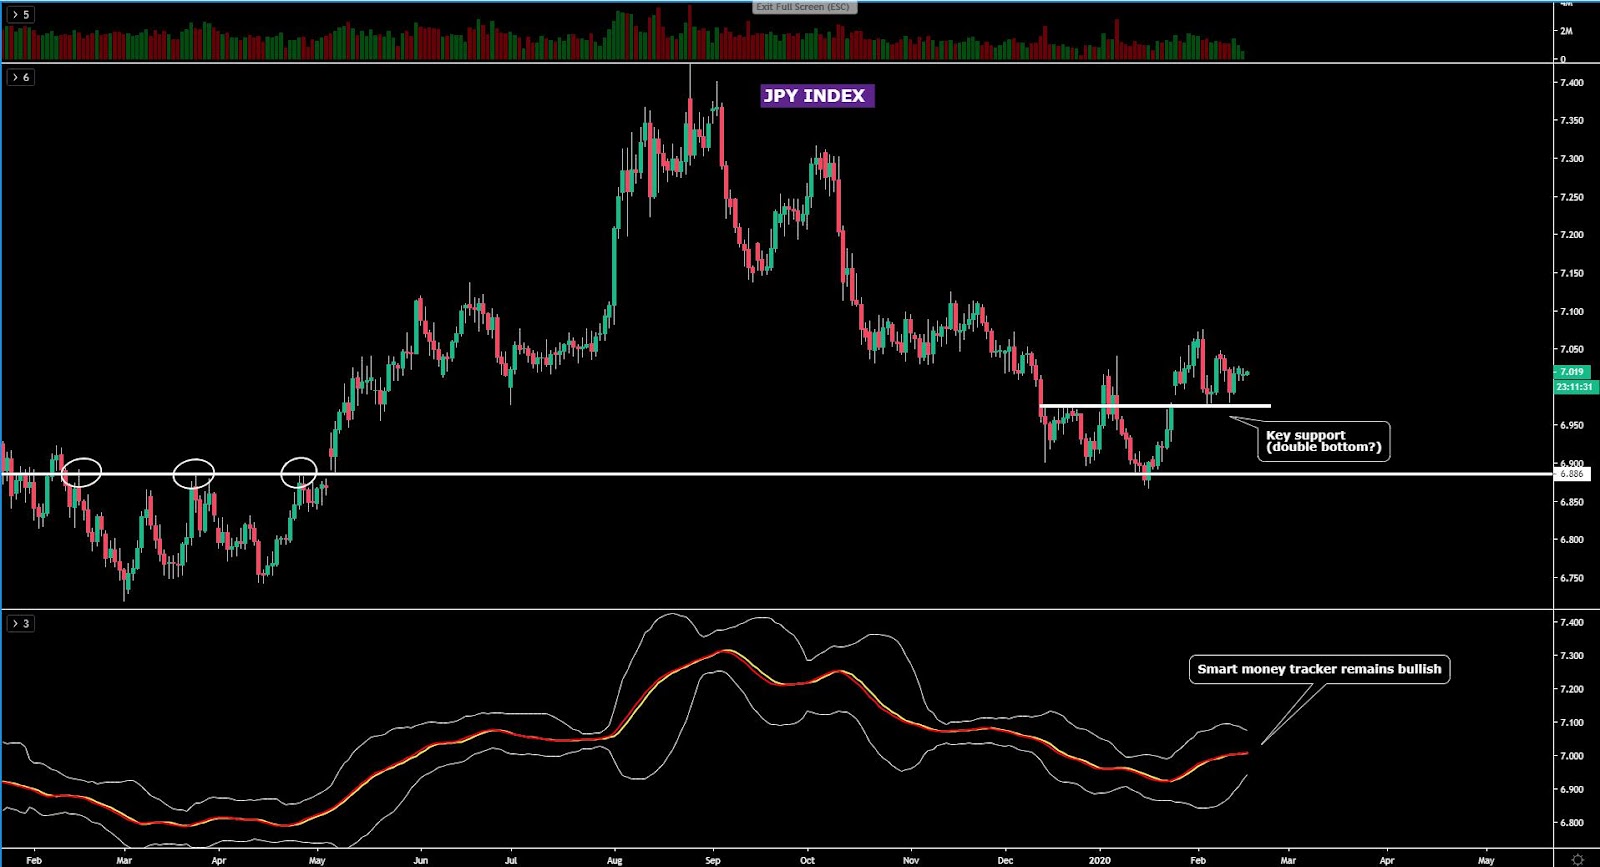
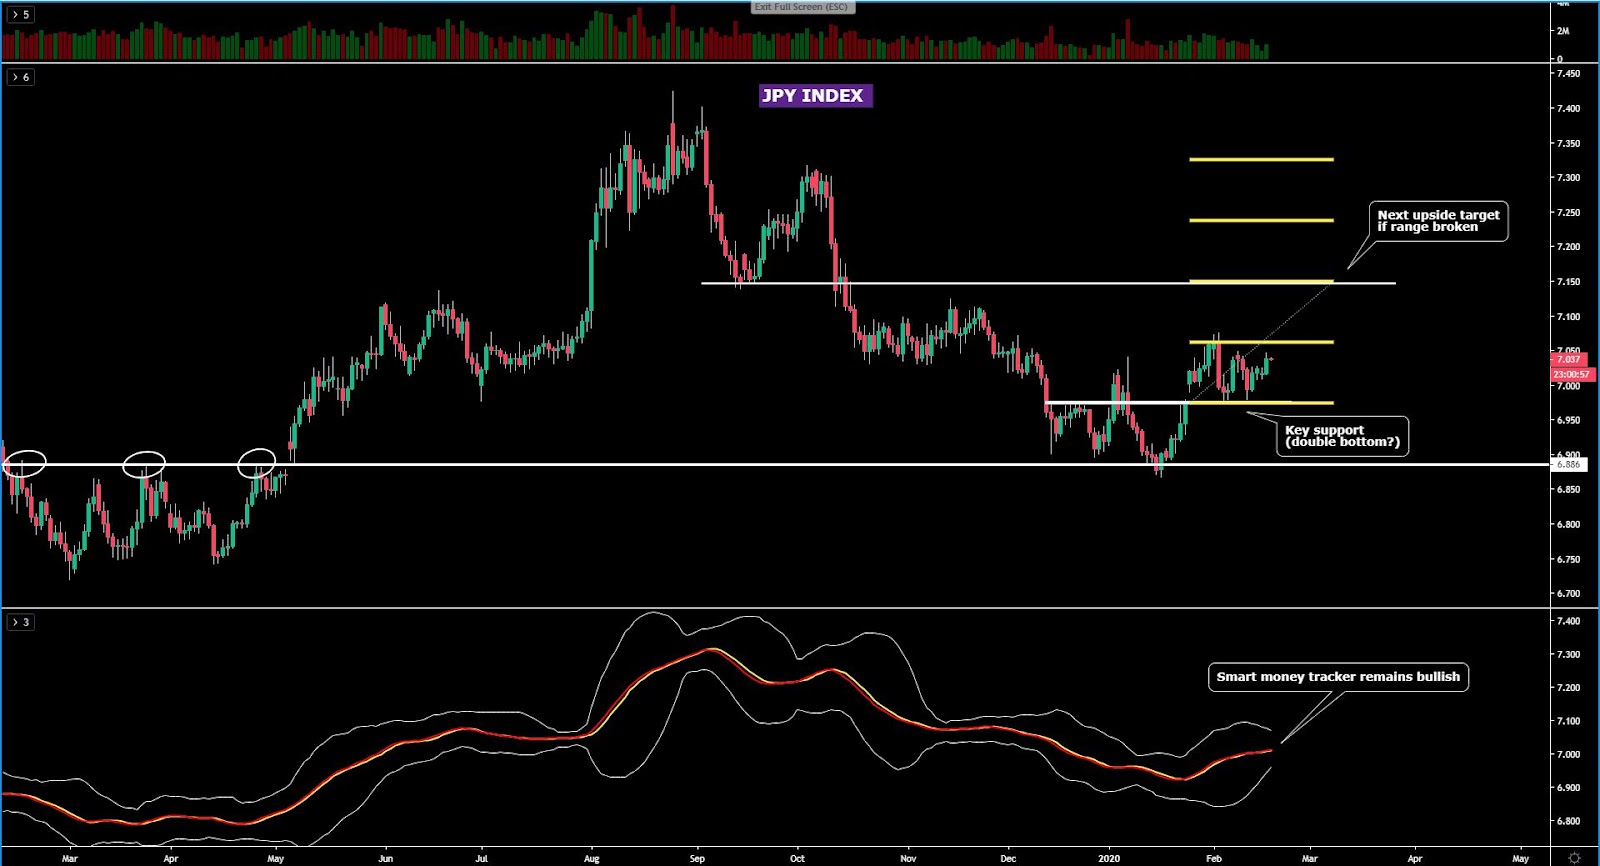
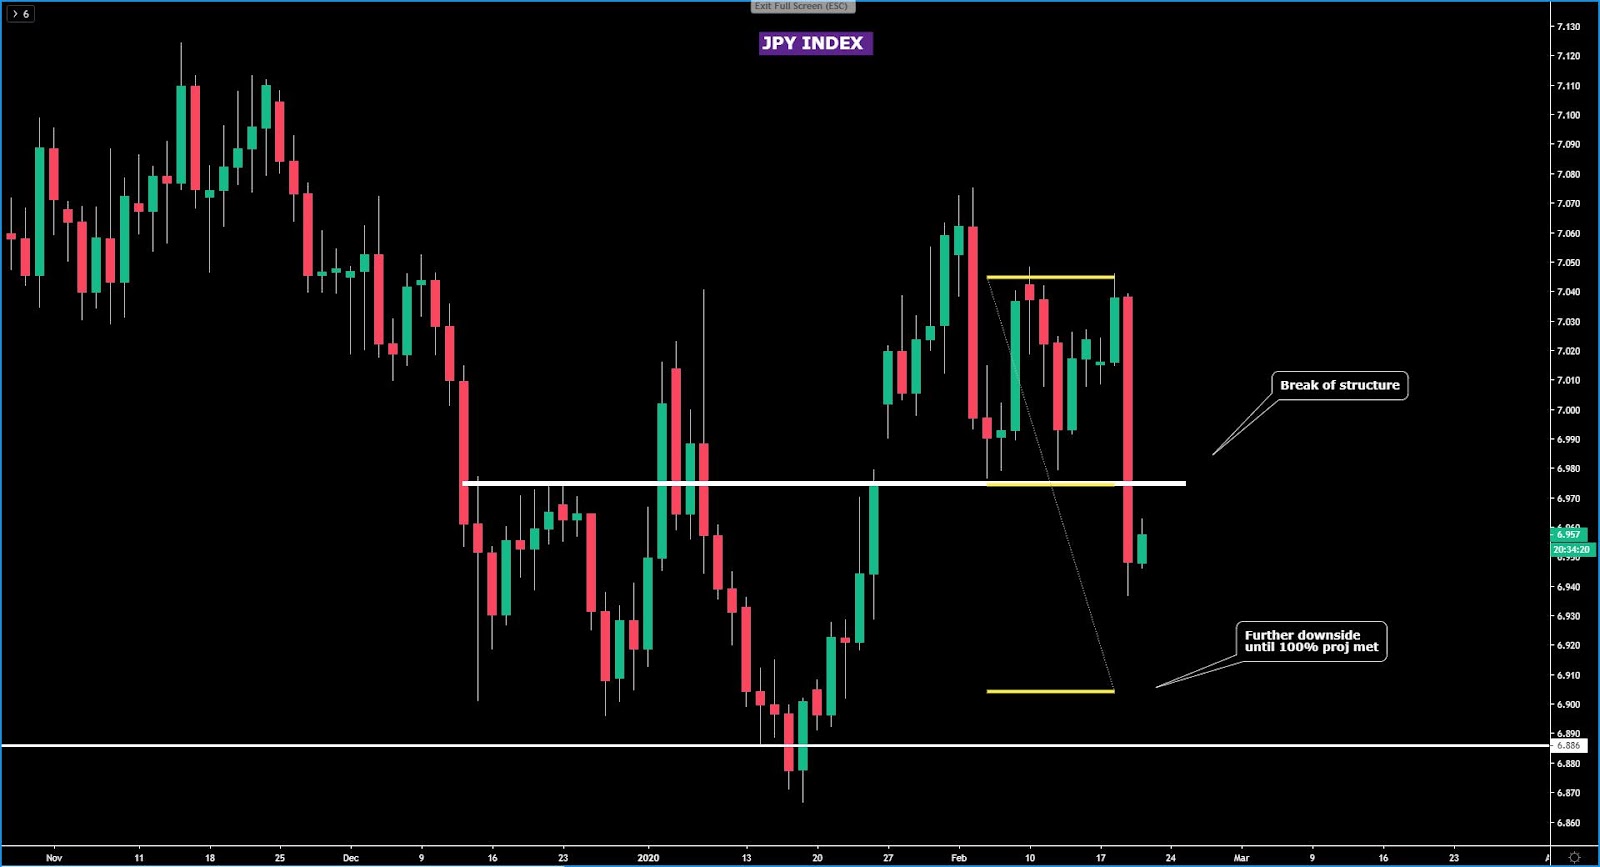
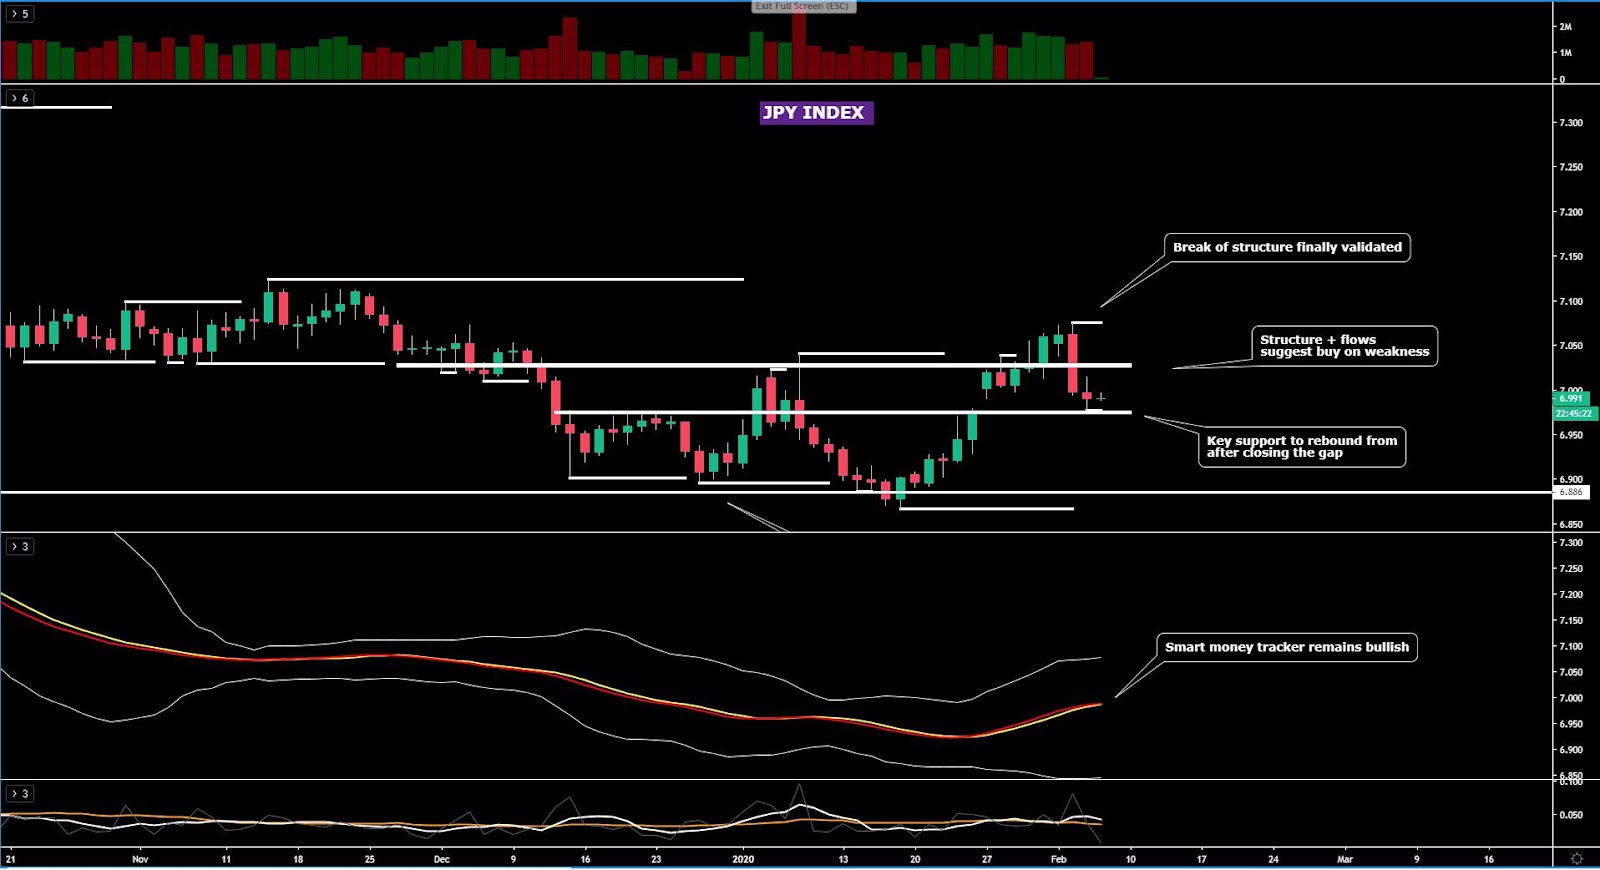
The JPY index has closed the upside gap from last week. I struggle to envision much follow through in the Yen as technicals stand. We have a still very treacherous environment concerning the NCoV, that combined with the bullish price structure in this market, alongside the bullish slope in the money tracker, it tells me that the market may not be just yet done adding Yen long exposure. The level certainly looks attractive as it’s acted as support/resistance every time there has been an interaction through it.
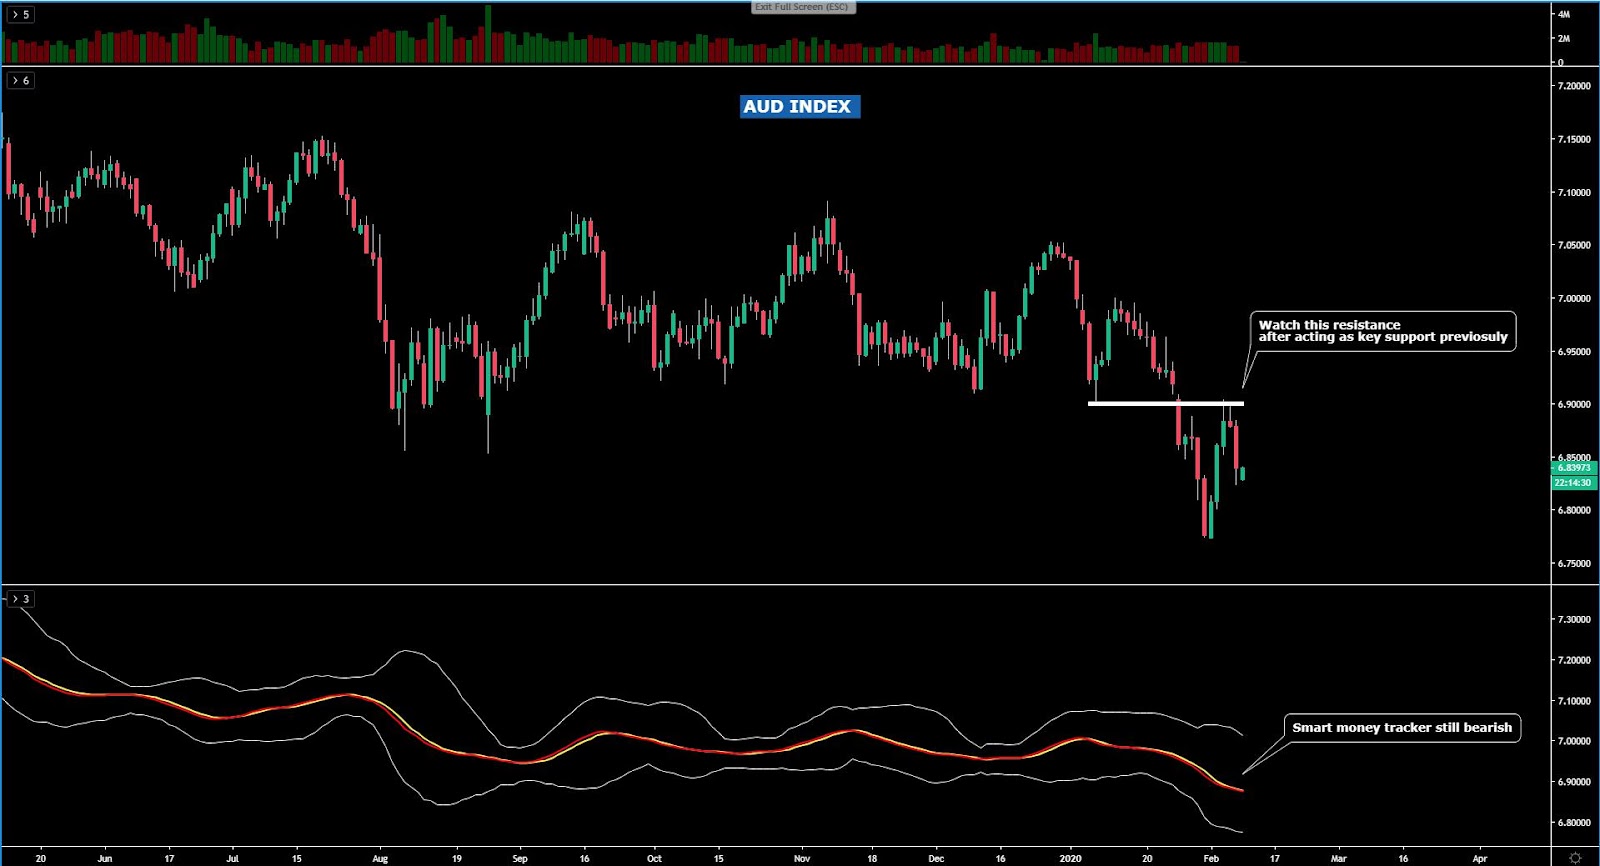
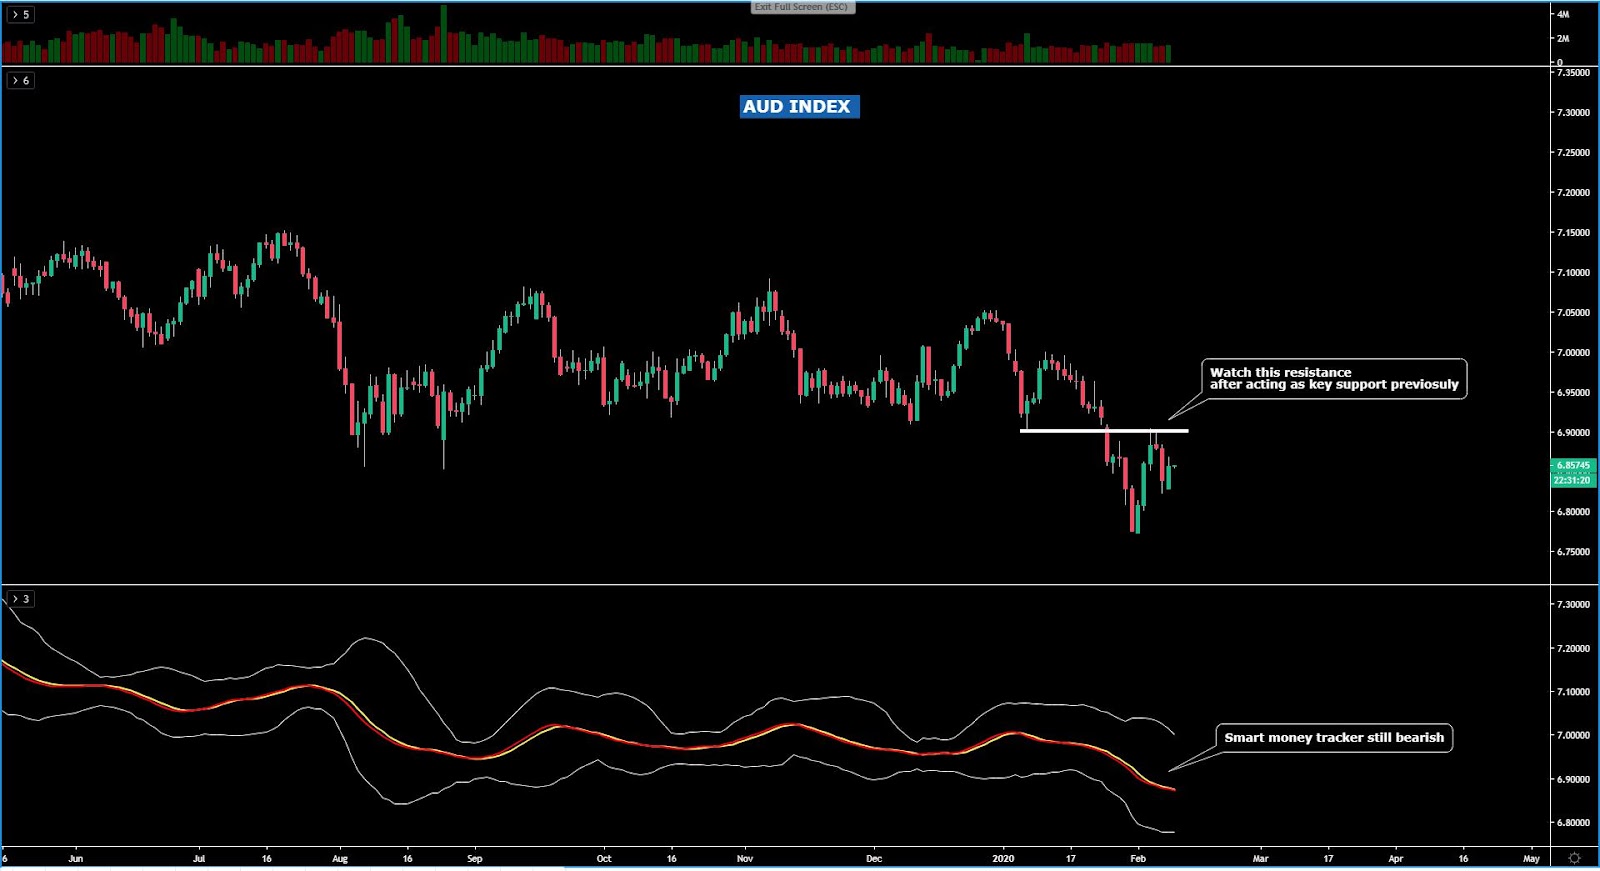
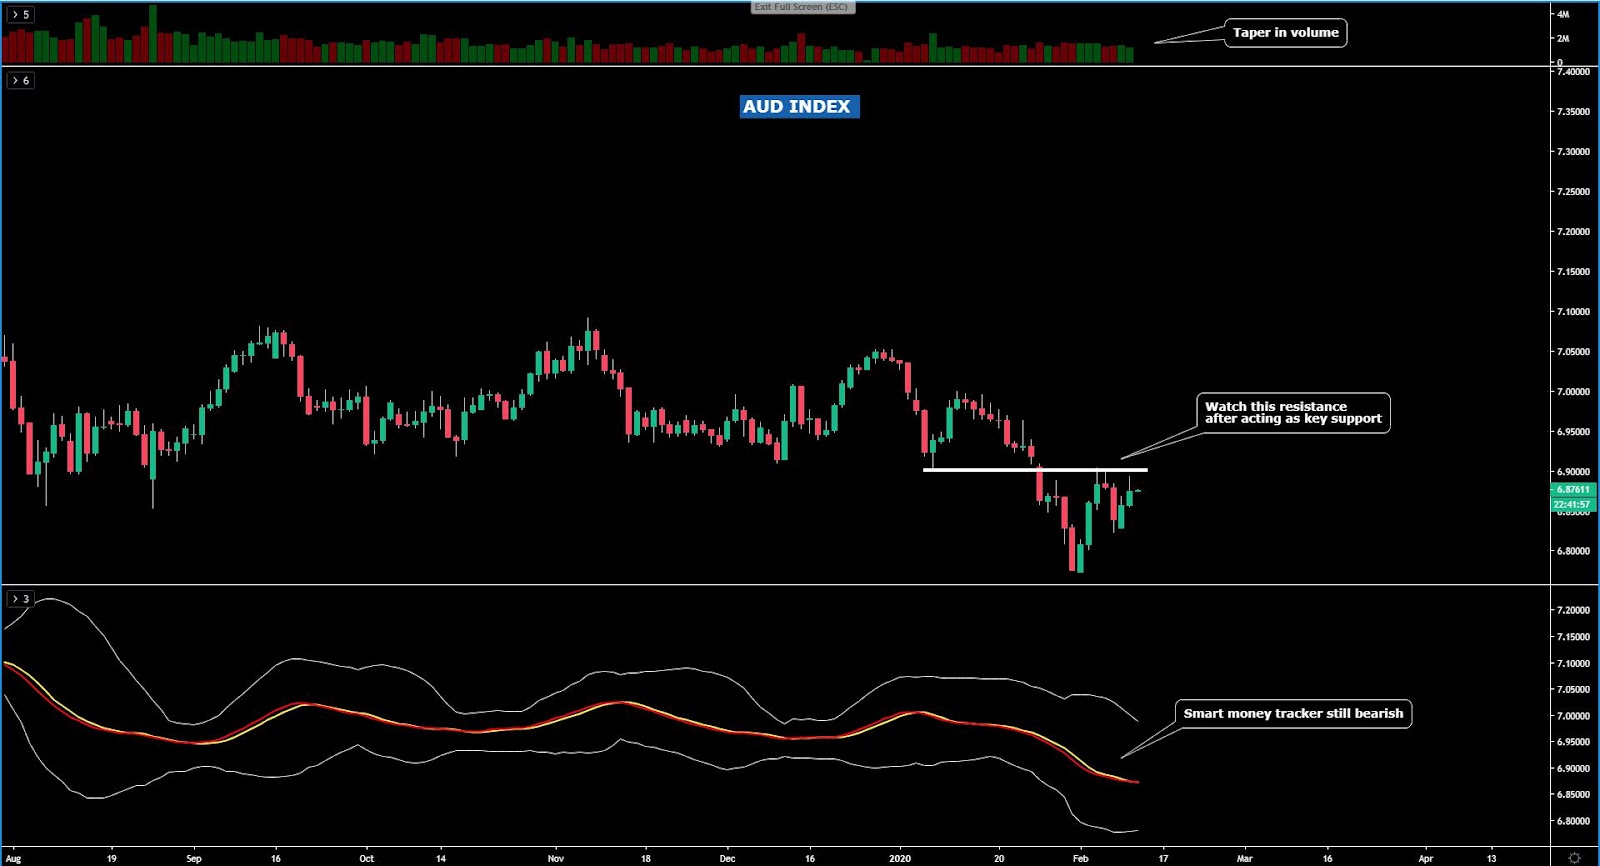
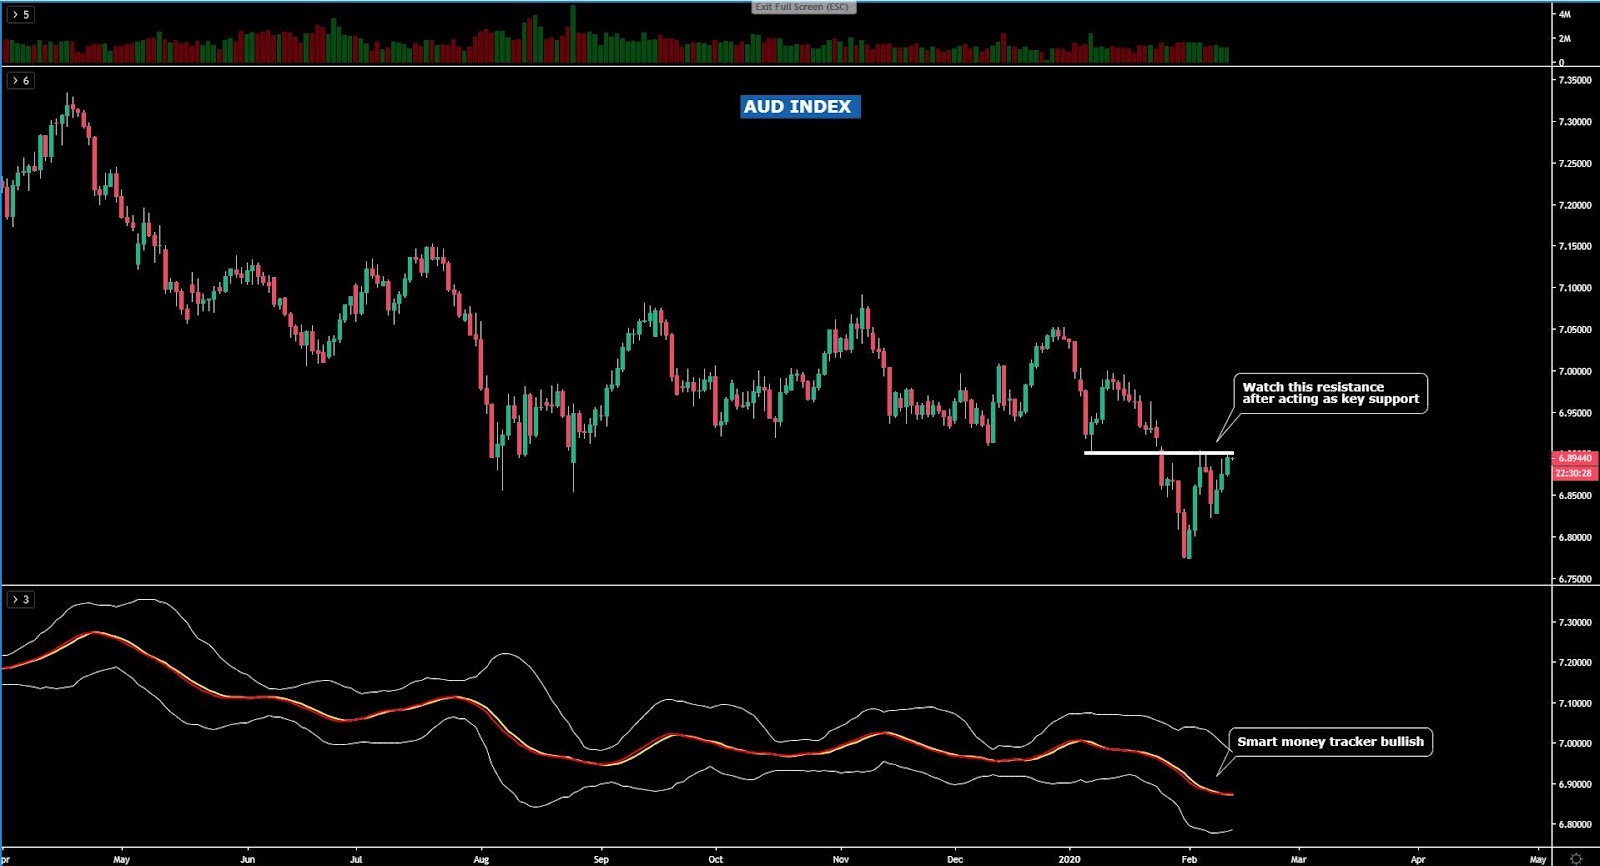
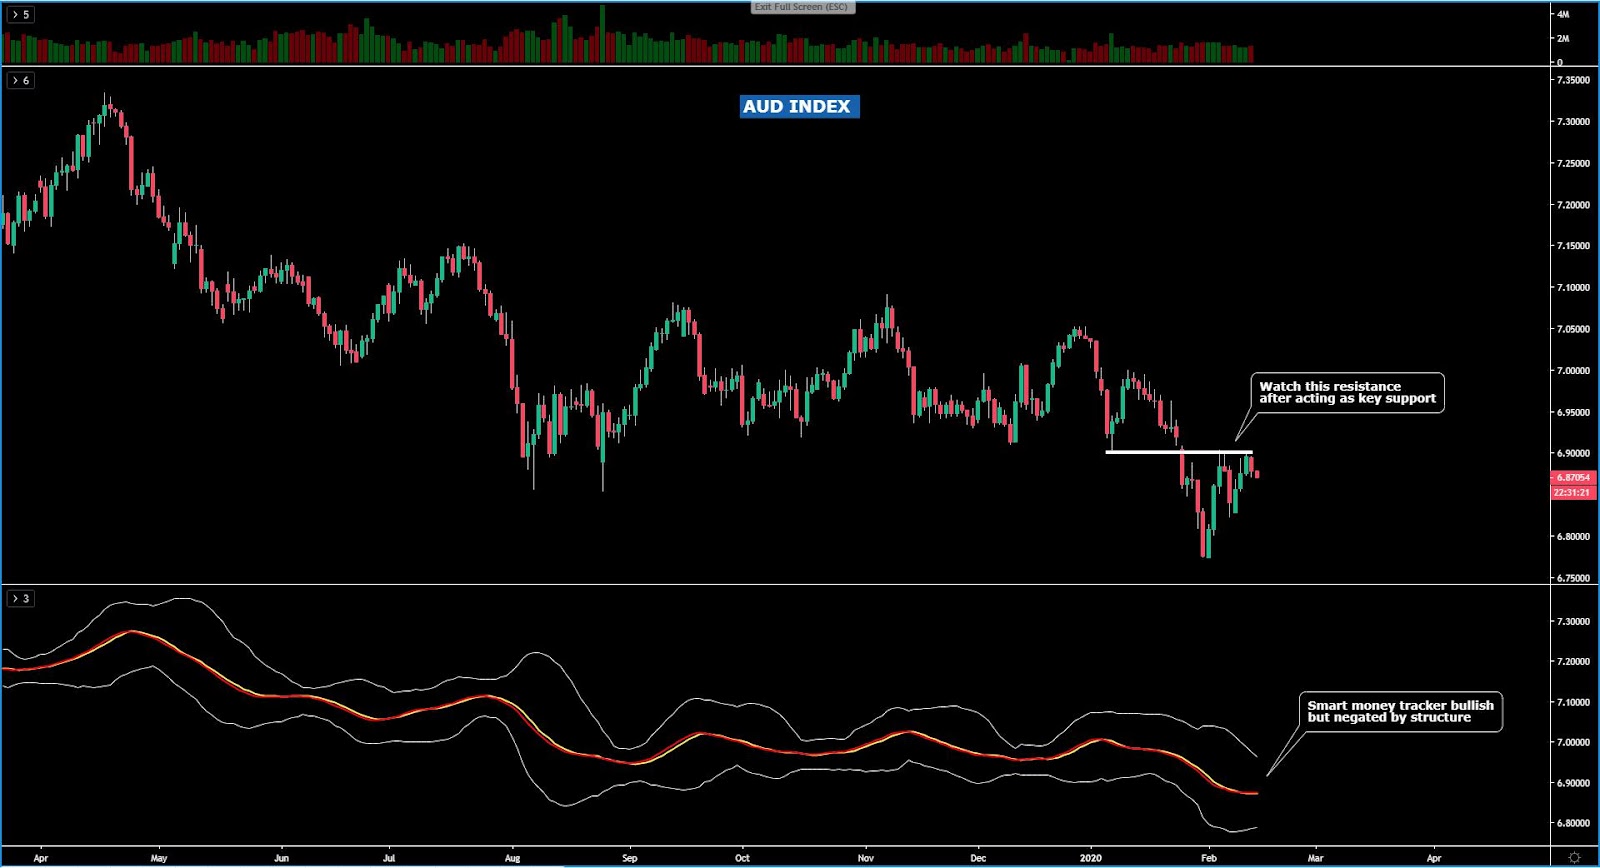
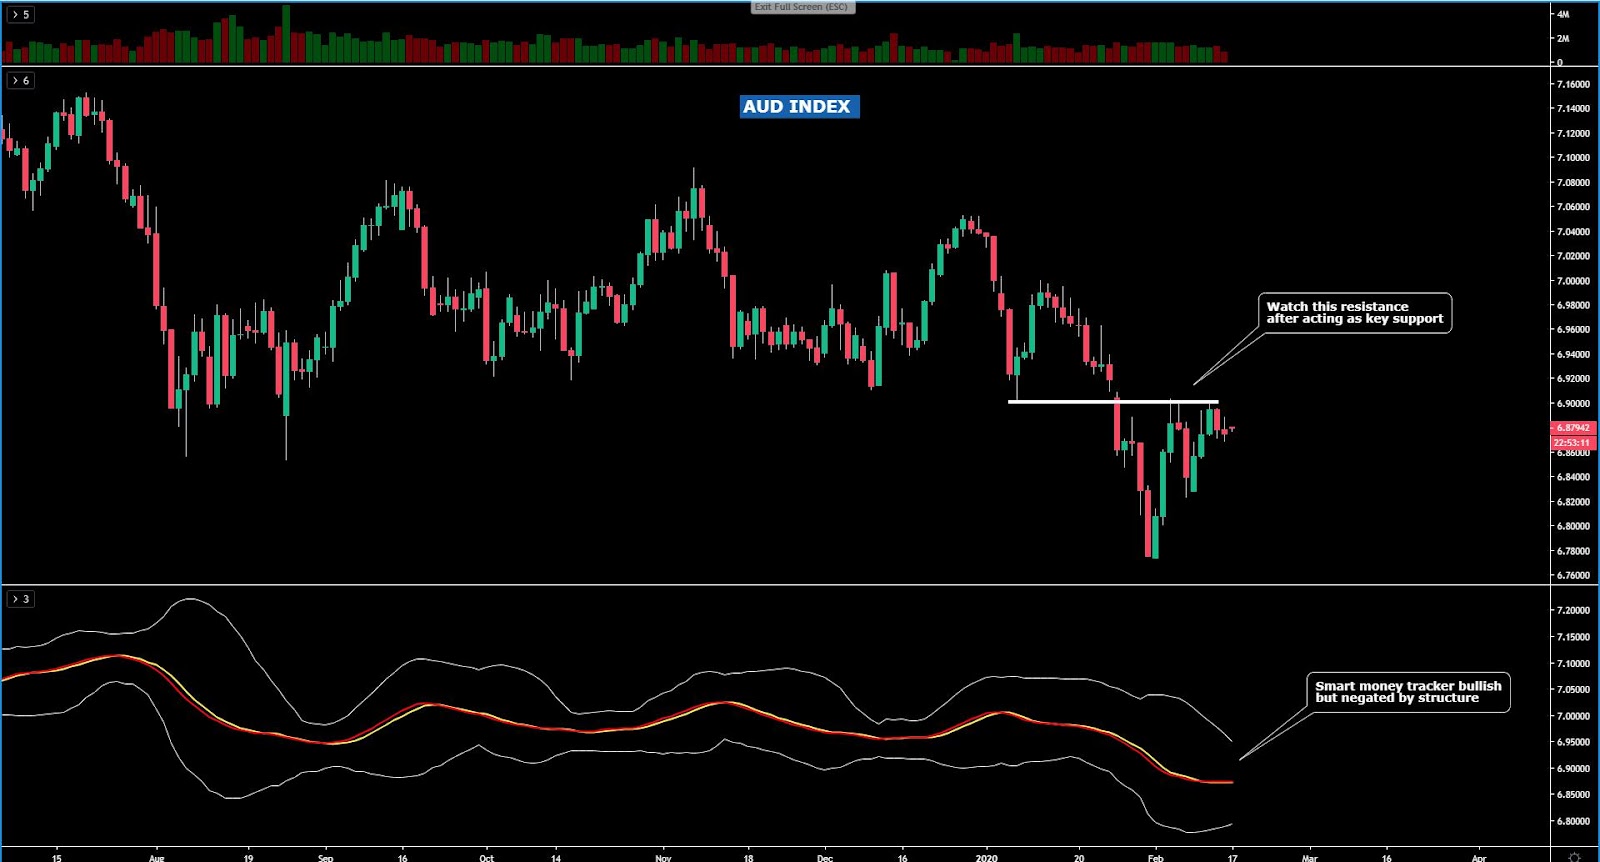
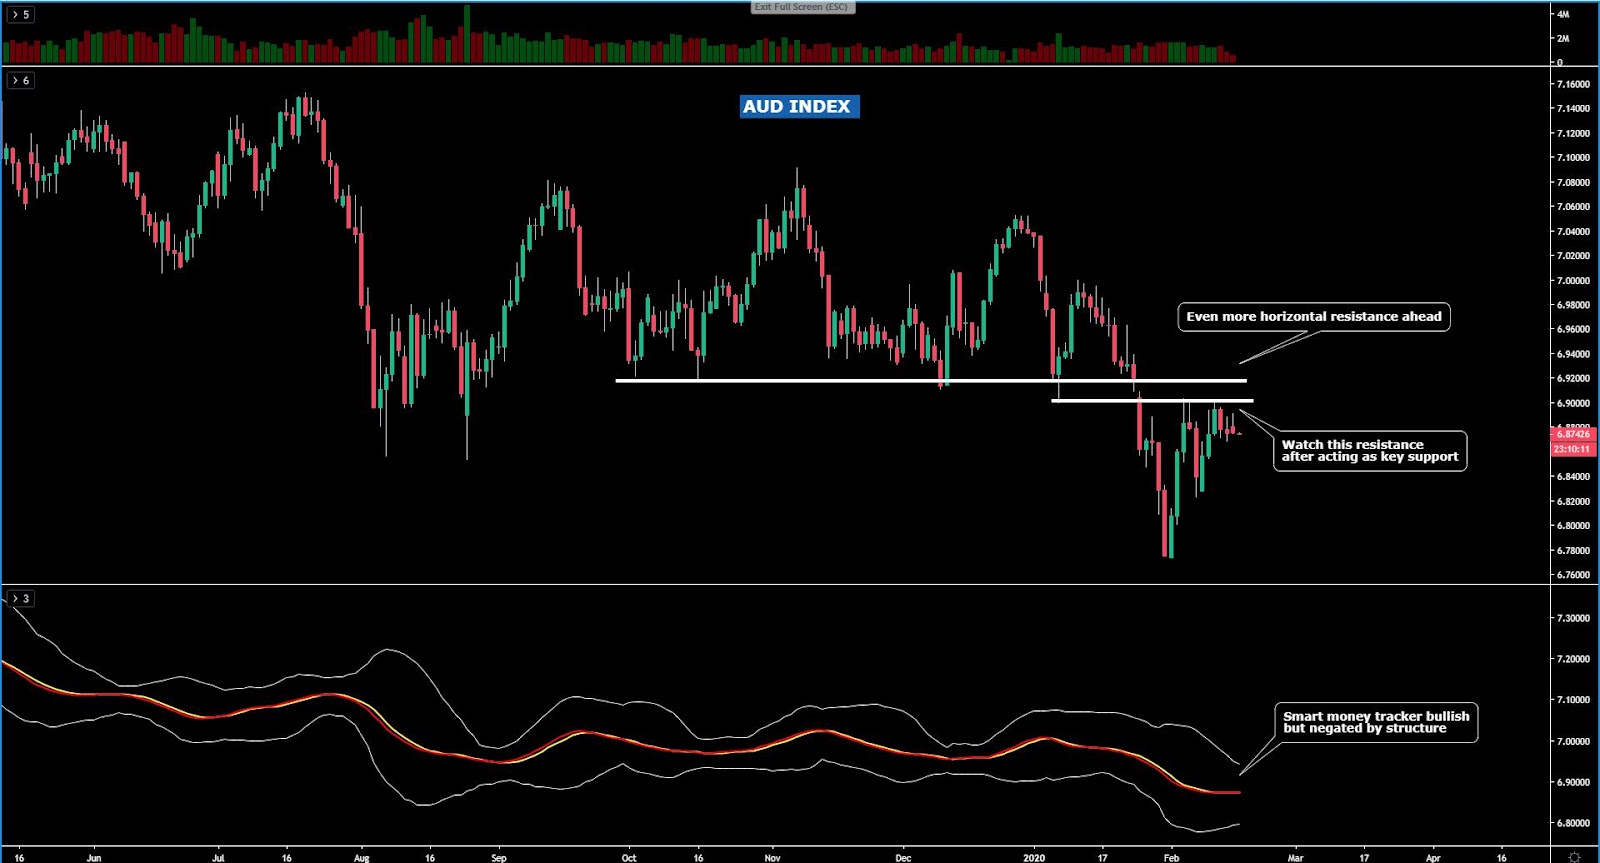
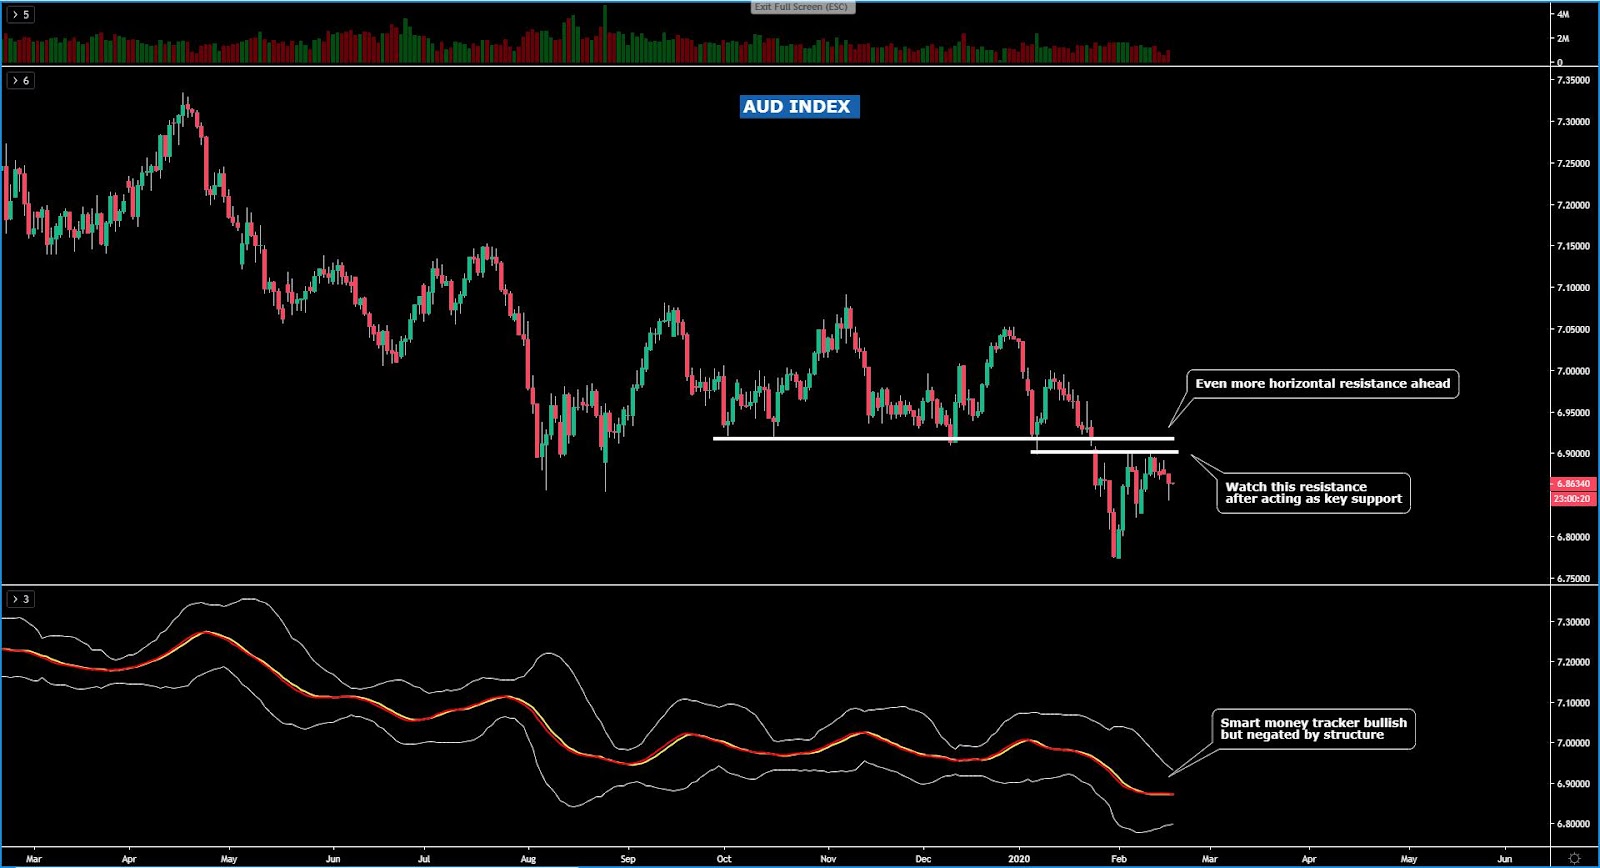
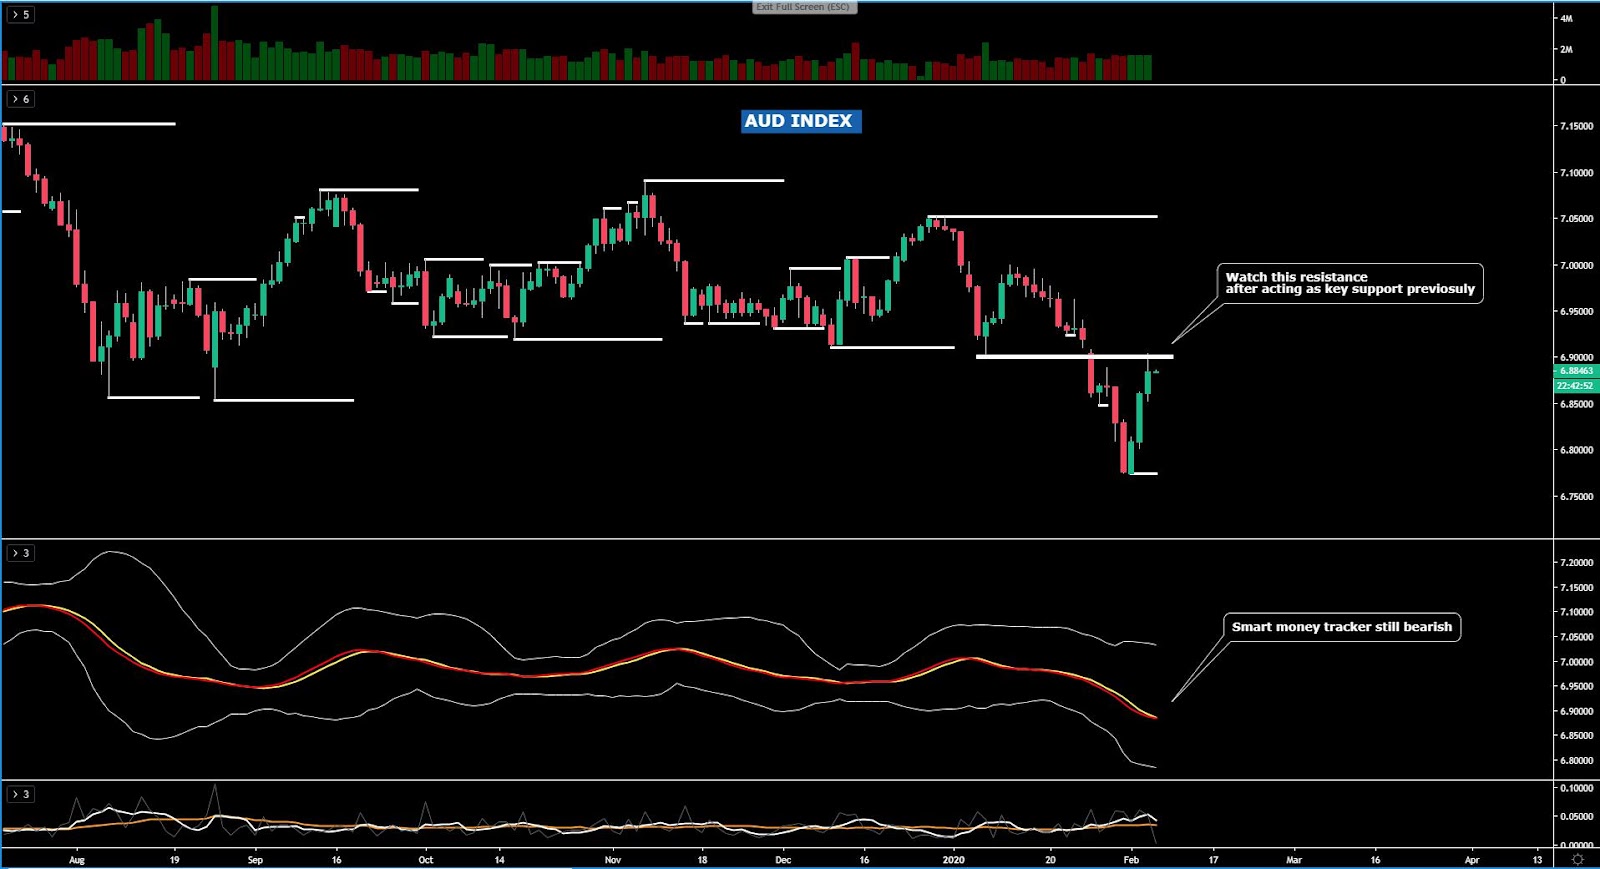
The AUD index, for those that remain bullish, I’d say that it must be done at your own peril, as the index has certainly reached an inflection point where a shift in order flow back down is a scenario that would be in congruence with the dominant bearish price structure. Make no mistake, this is a market still in correction mode in the context of a bearish trend, which still has the backing of smart money tracker slope pointing lower. I will reiterate that while I did endorse staying away from Aussie shorts from the overly extended levels, that’s now changed, as the currency has finally hit a technical level of significance to sell into if entry setups agree.
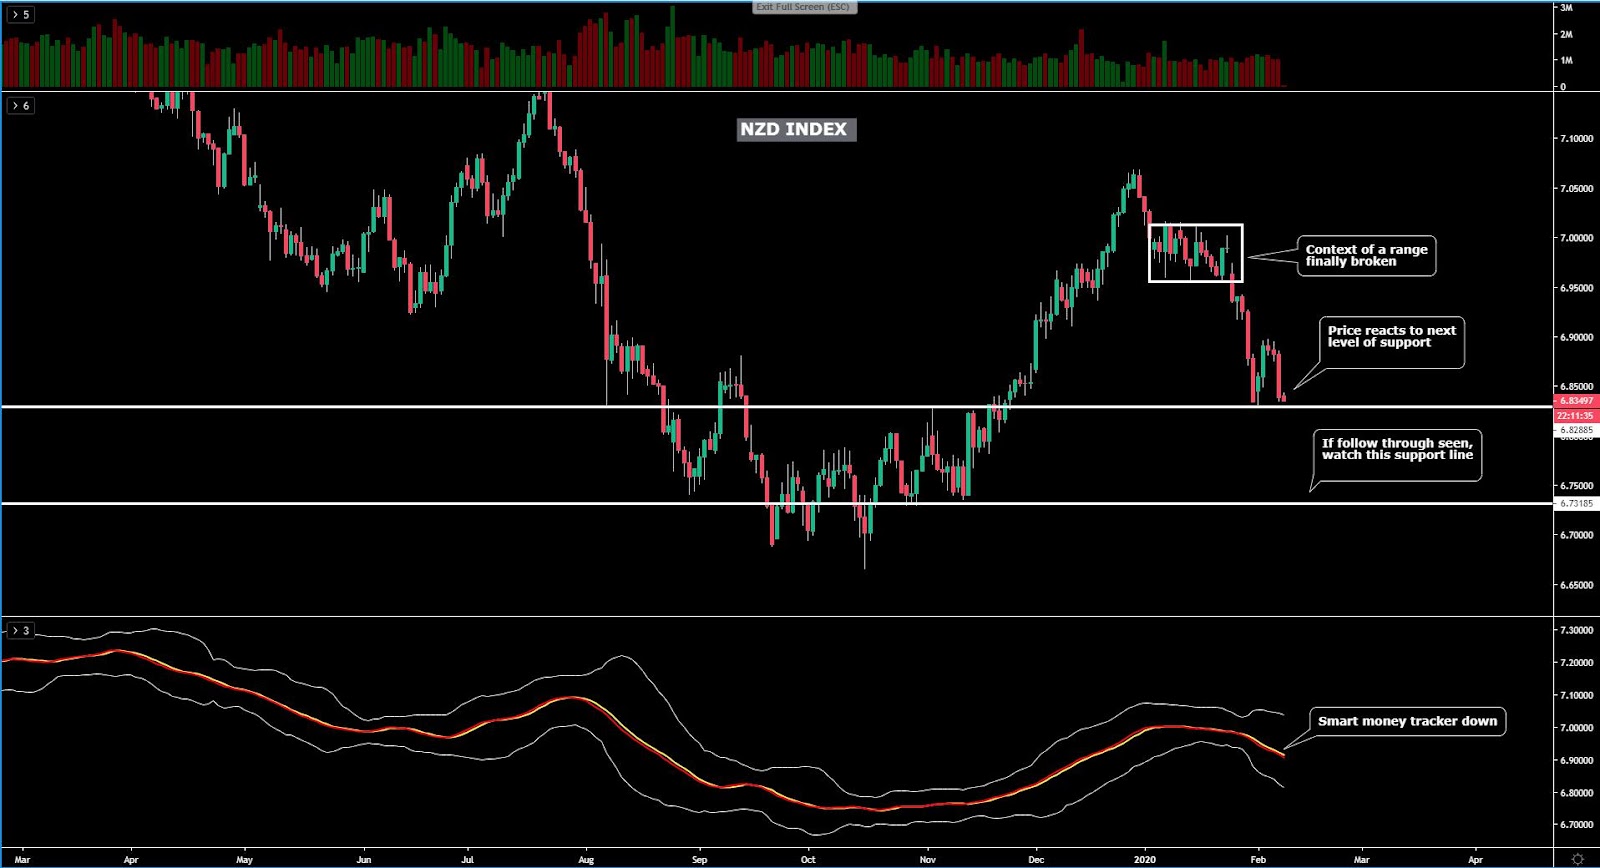
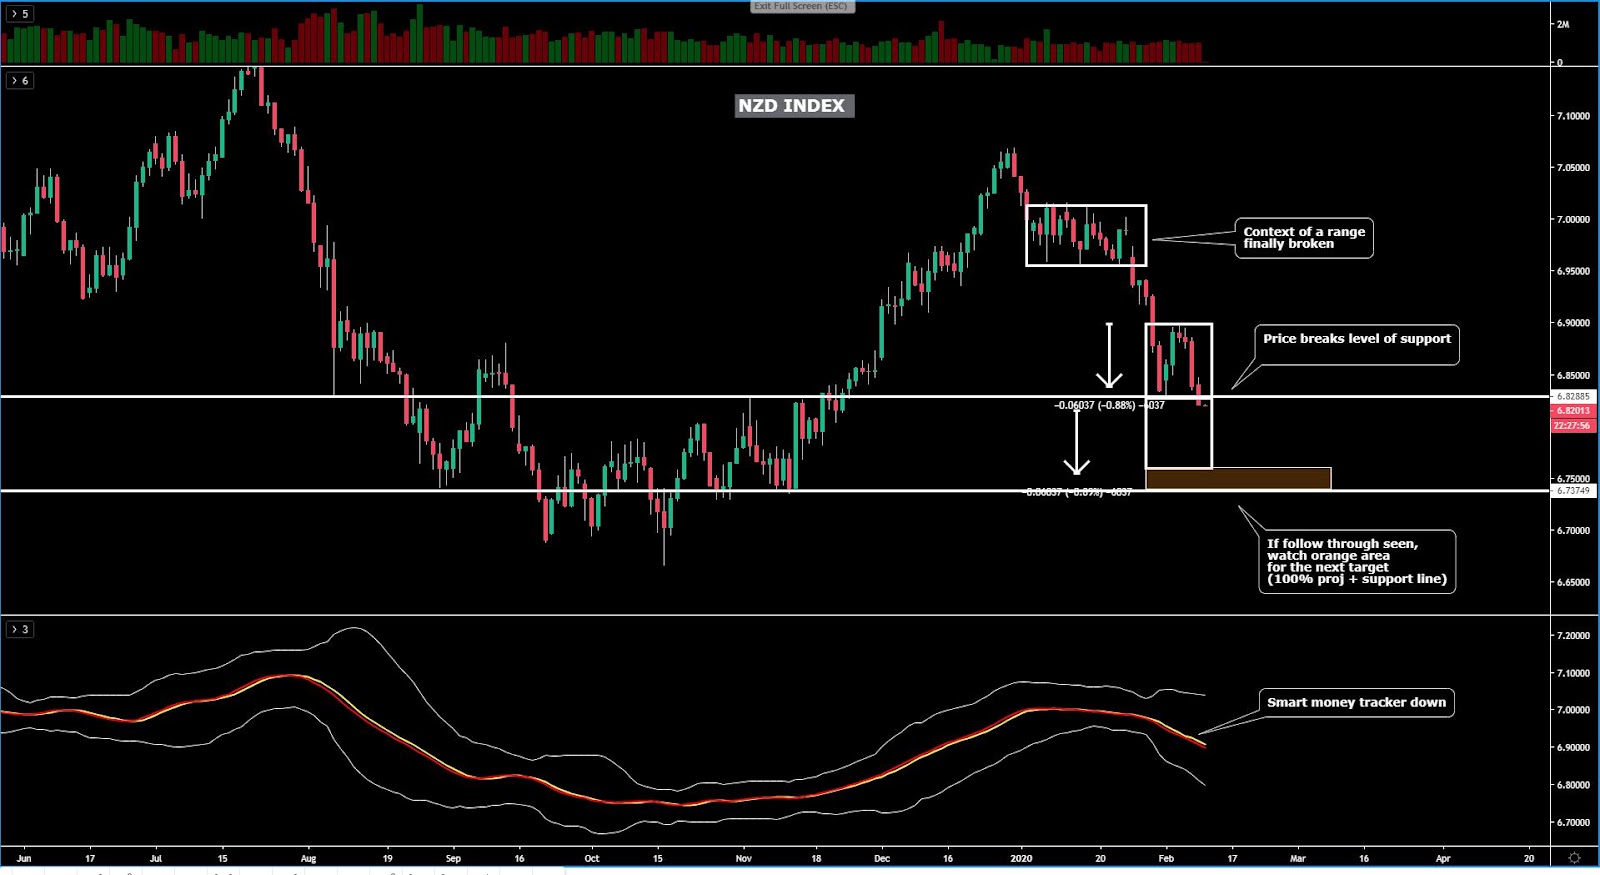
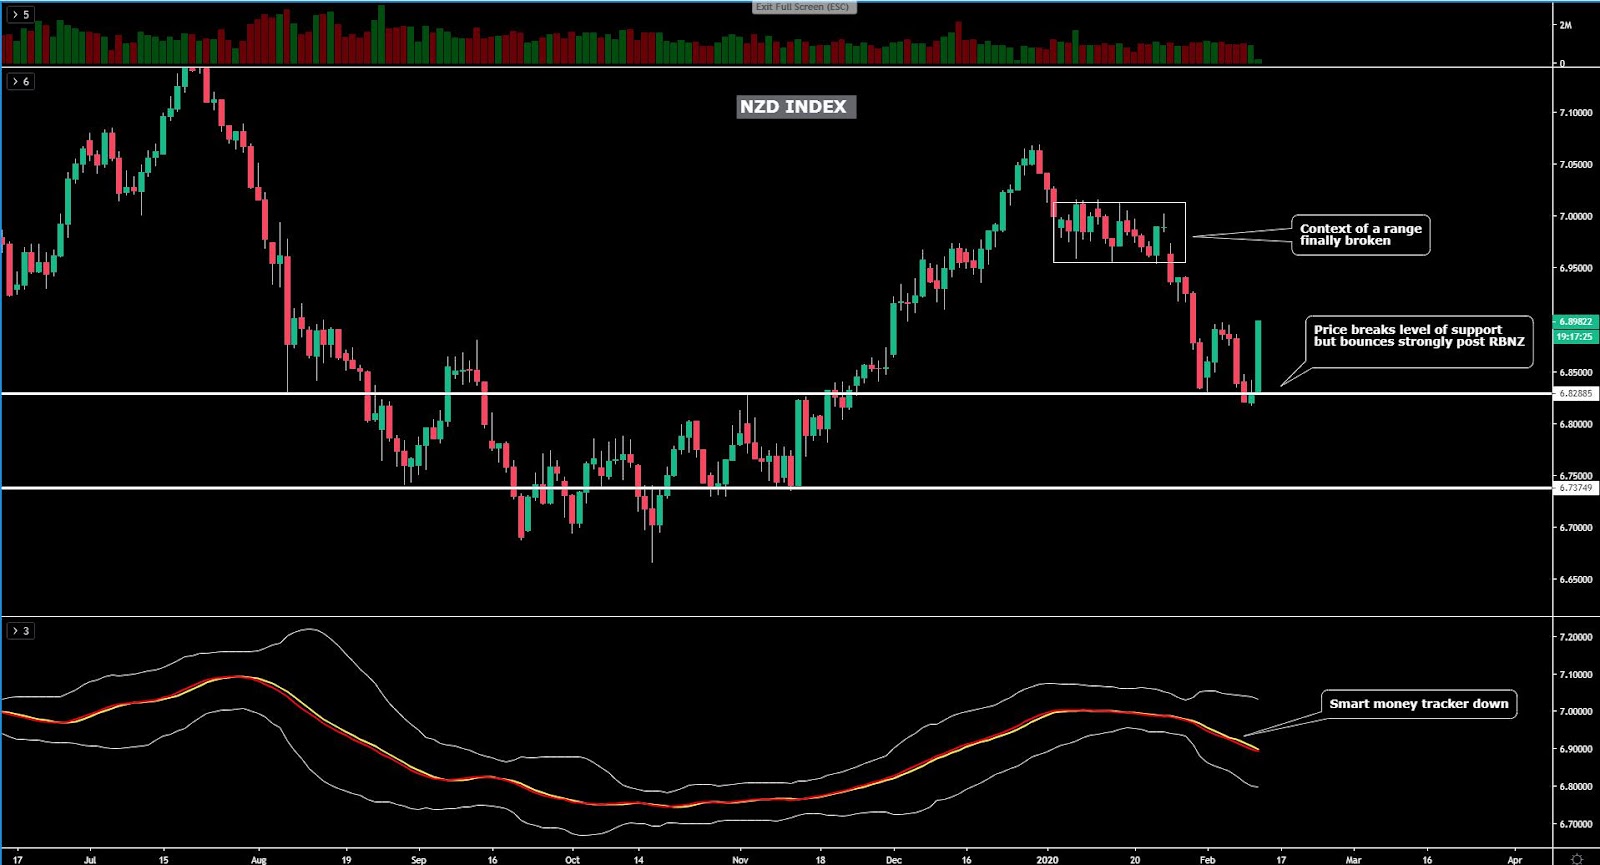
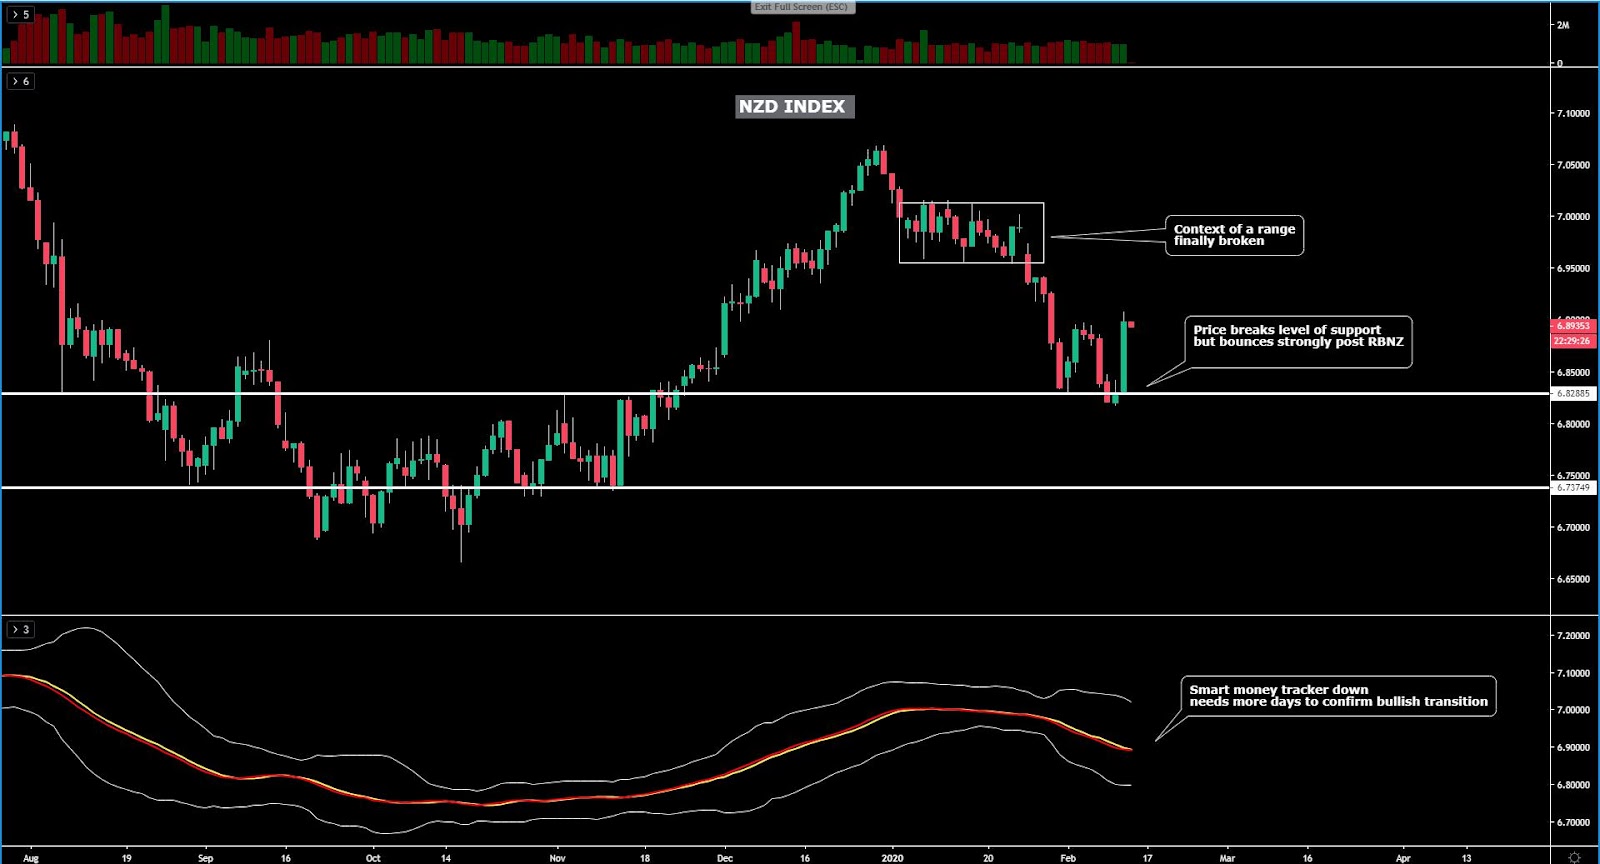
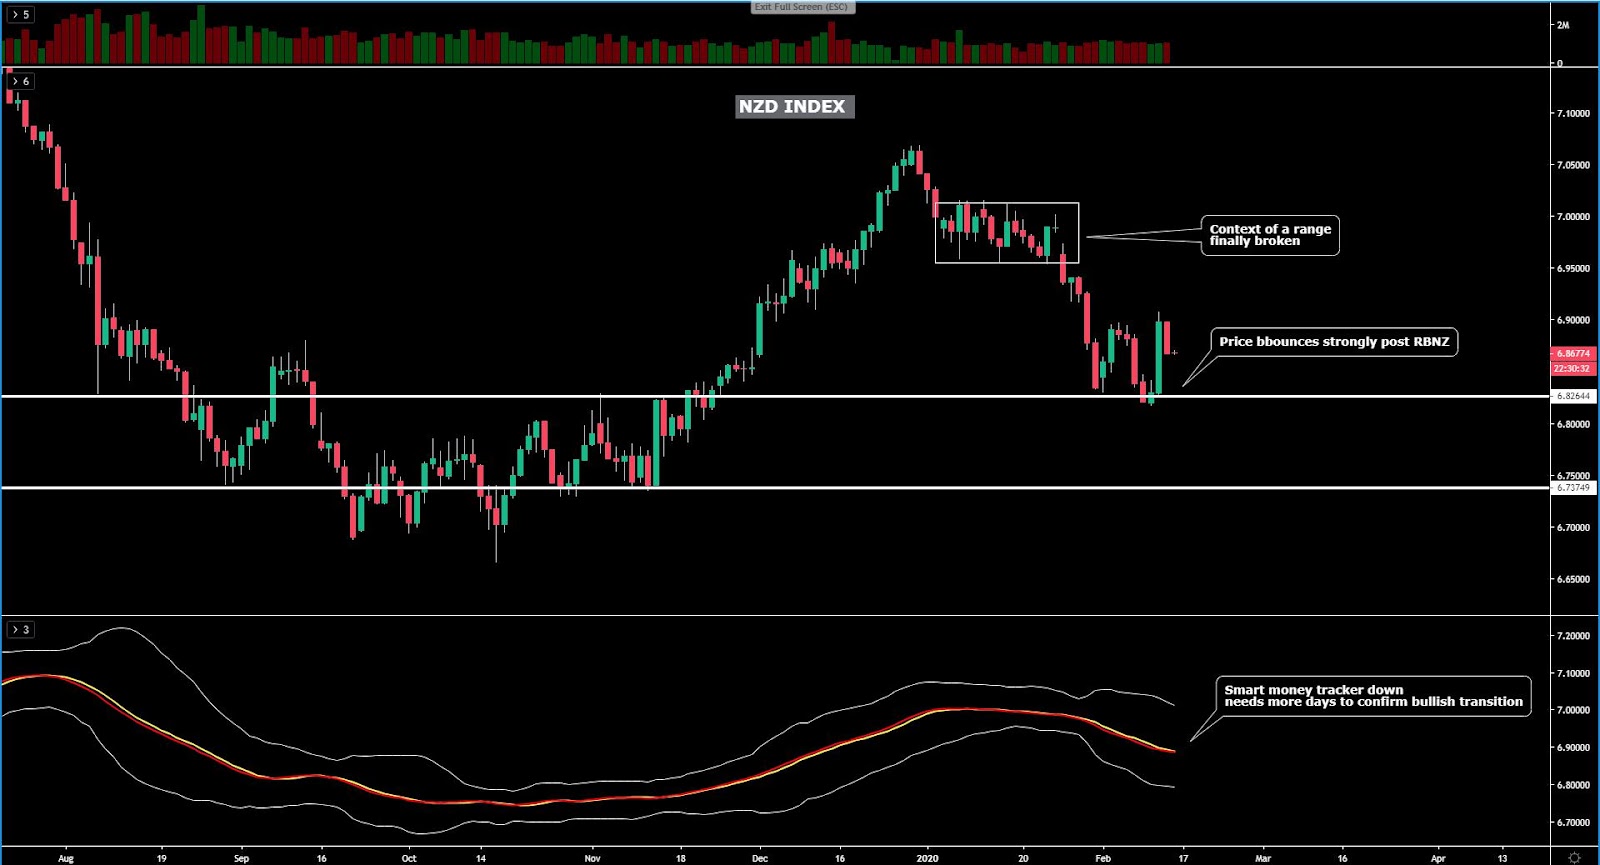
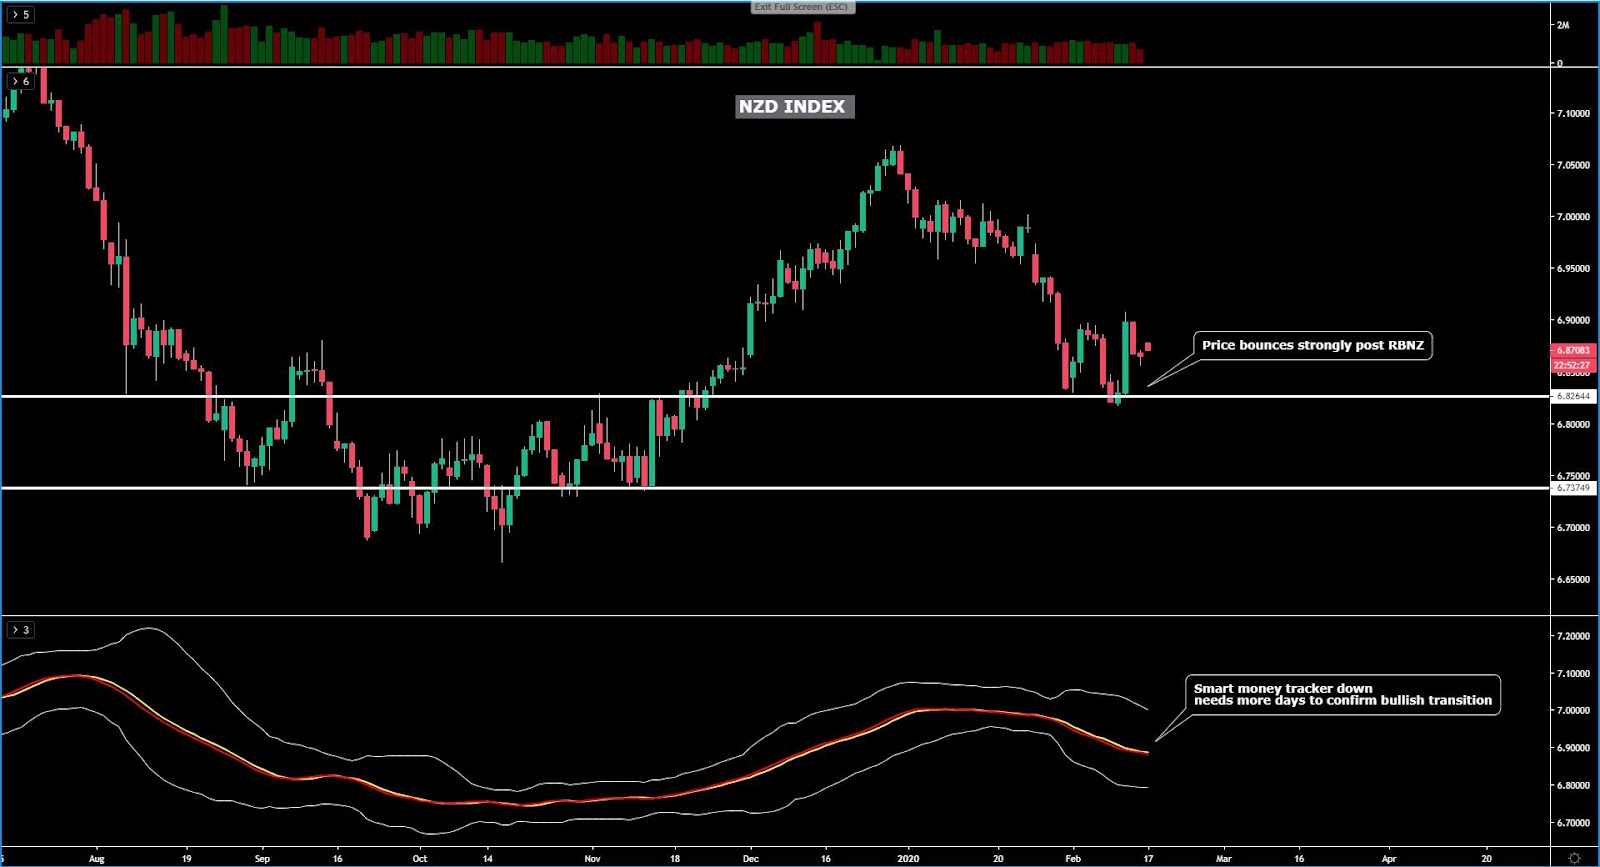
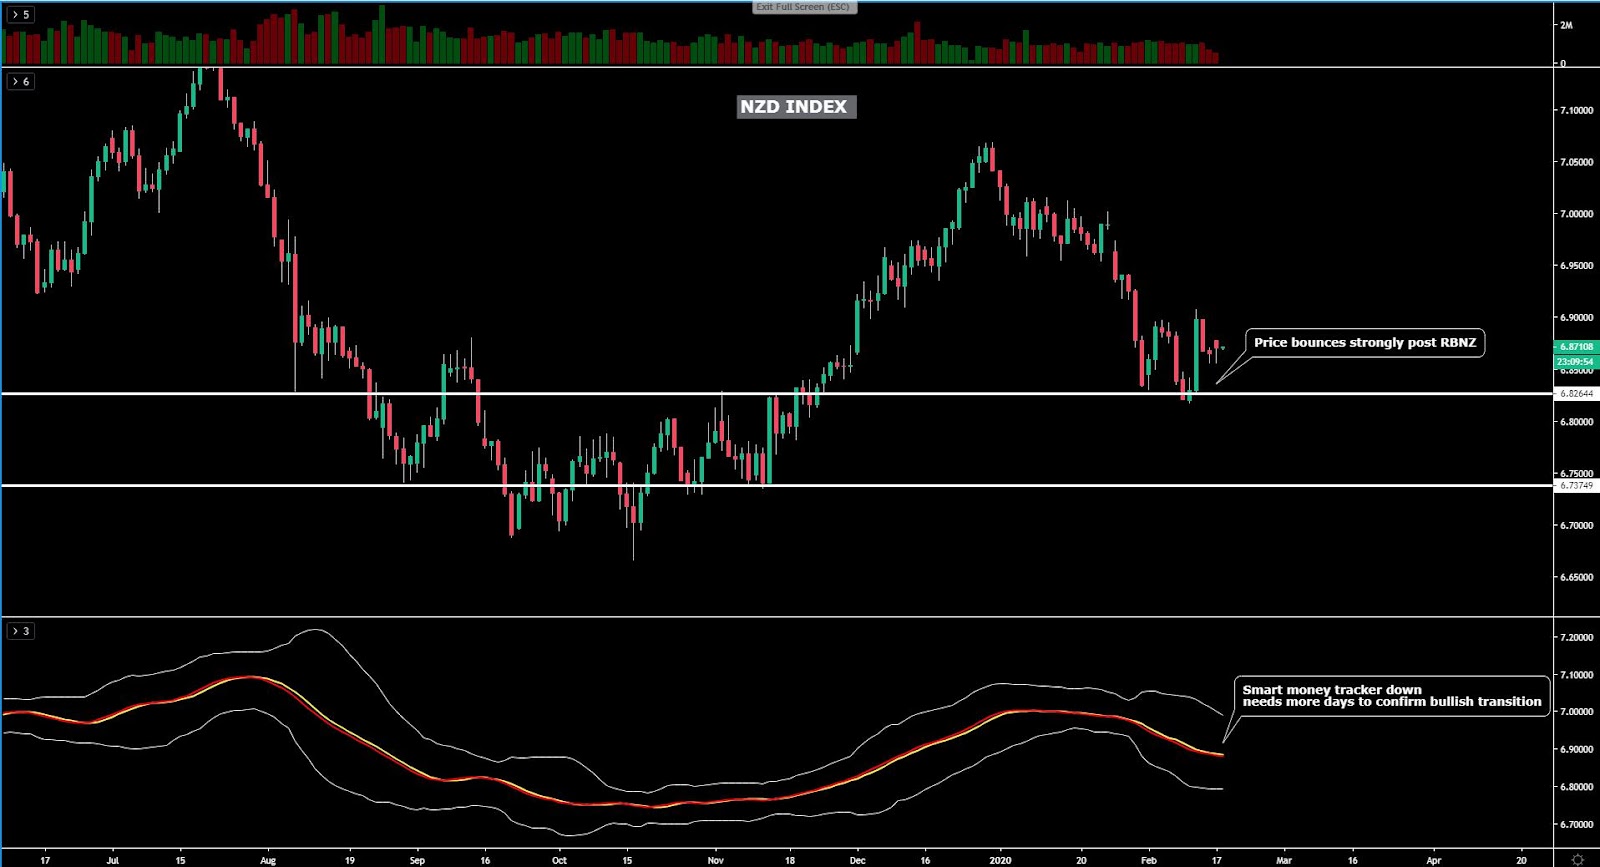
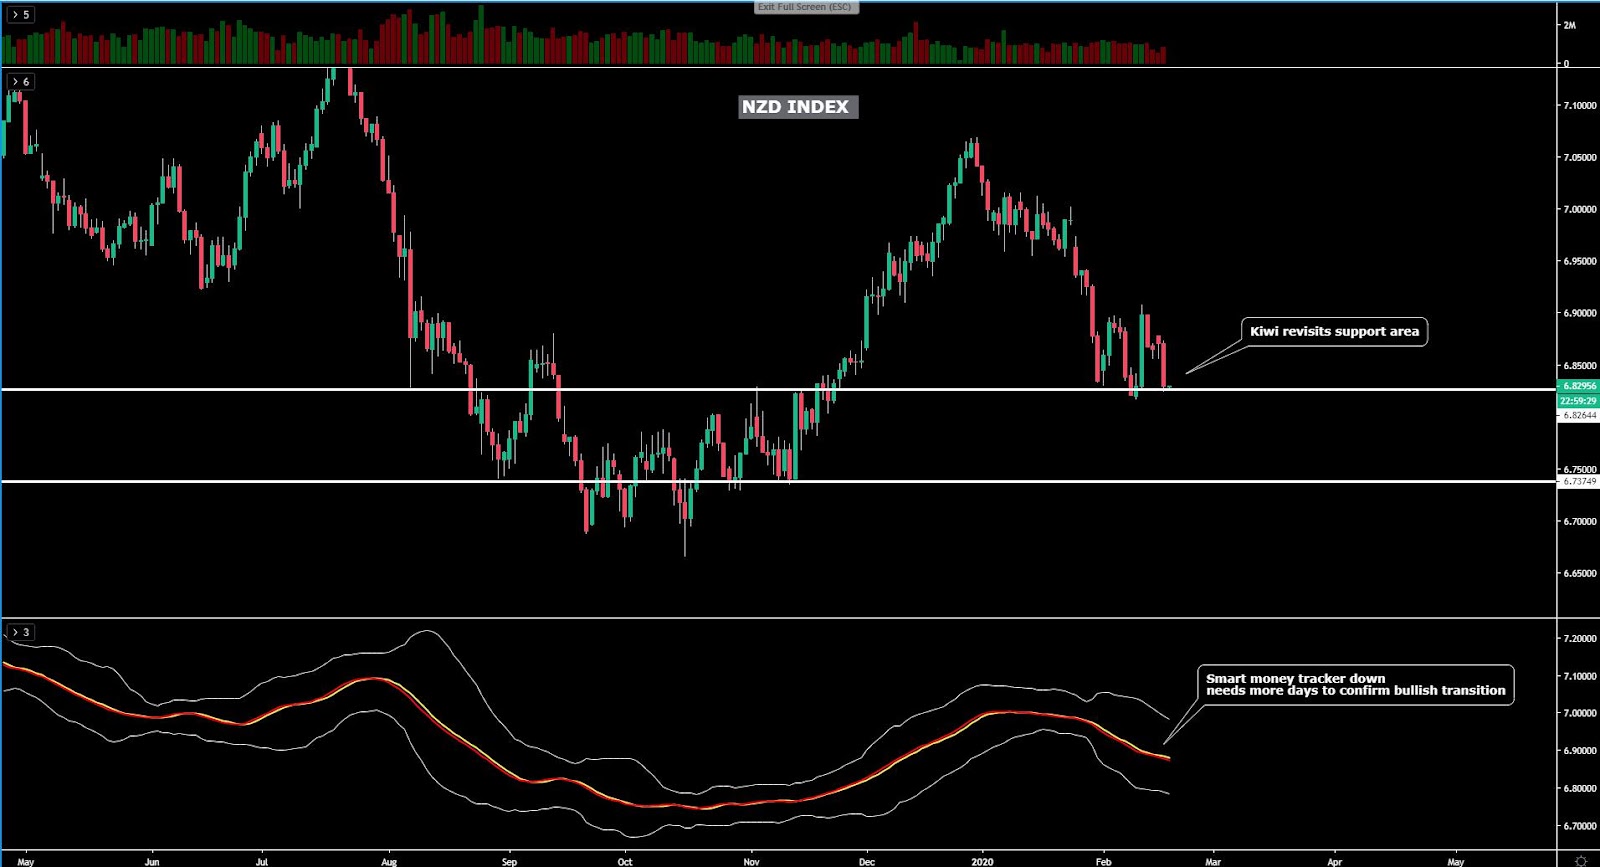
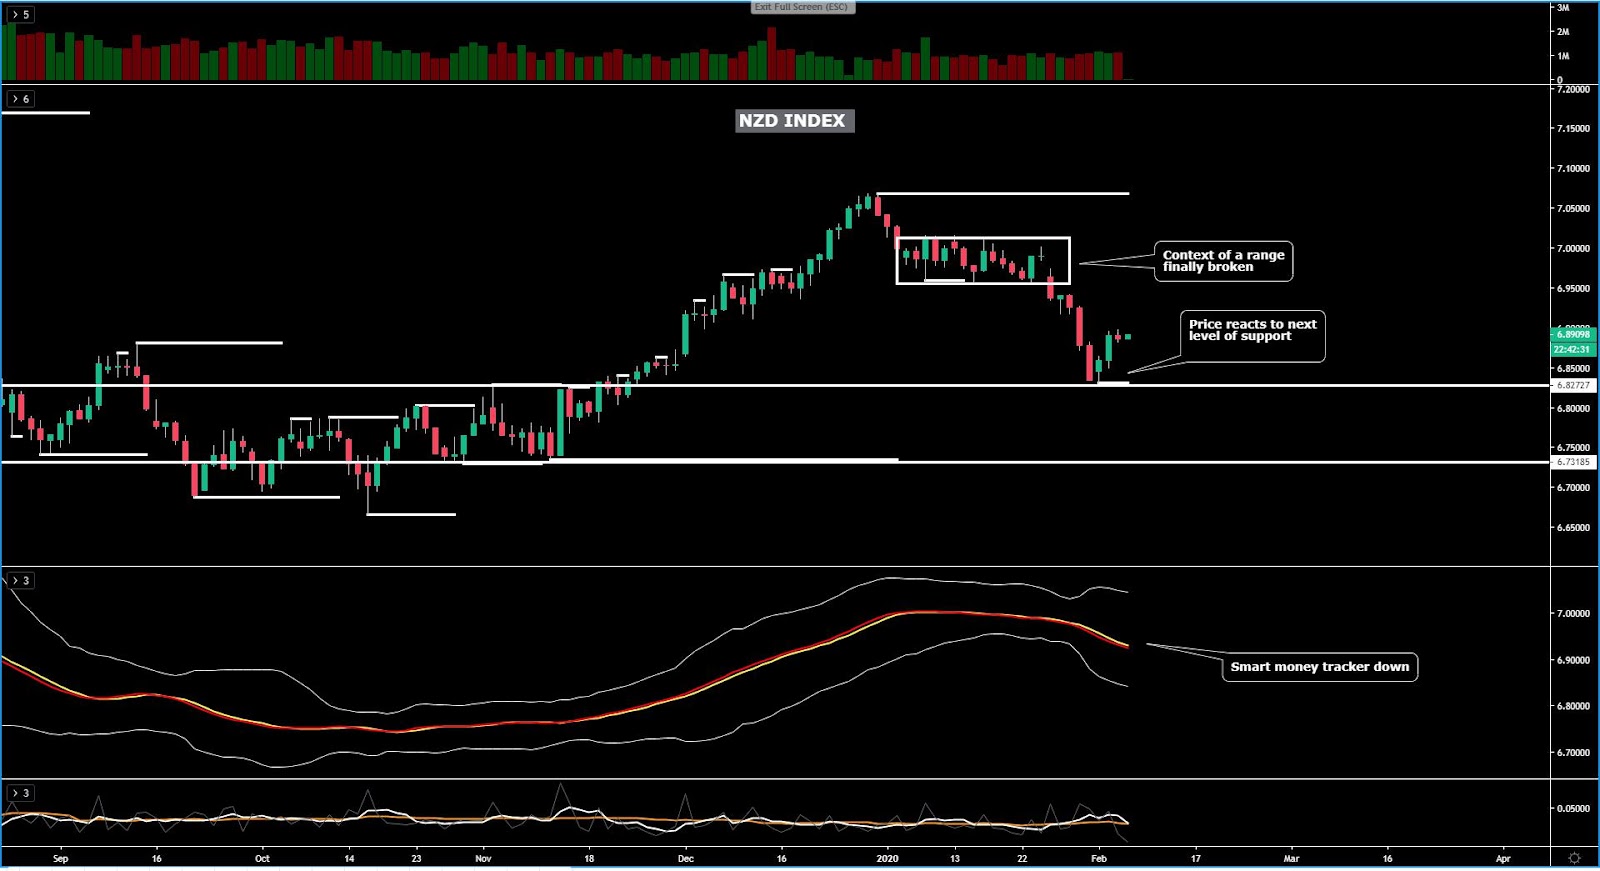
The NZD index sees no change in its outlook. The story line that I am reading here is that buying interest emerged off a line of strong support. However, the pick up in buy-side pressure is in contradiction with the daily technicals, which remain outright bearish. Therefore, any longs would be in defiance of the dominant trend as seen on the daily. Keep adding into NZD long exposure at your own risk, and be aware that the price structure and the order flow via the smart money tracker imply the risk of shorts taking back control is a realistic prospect.
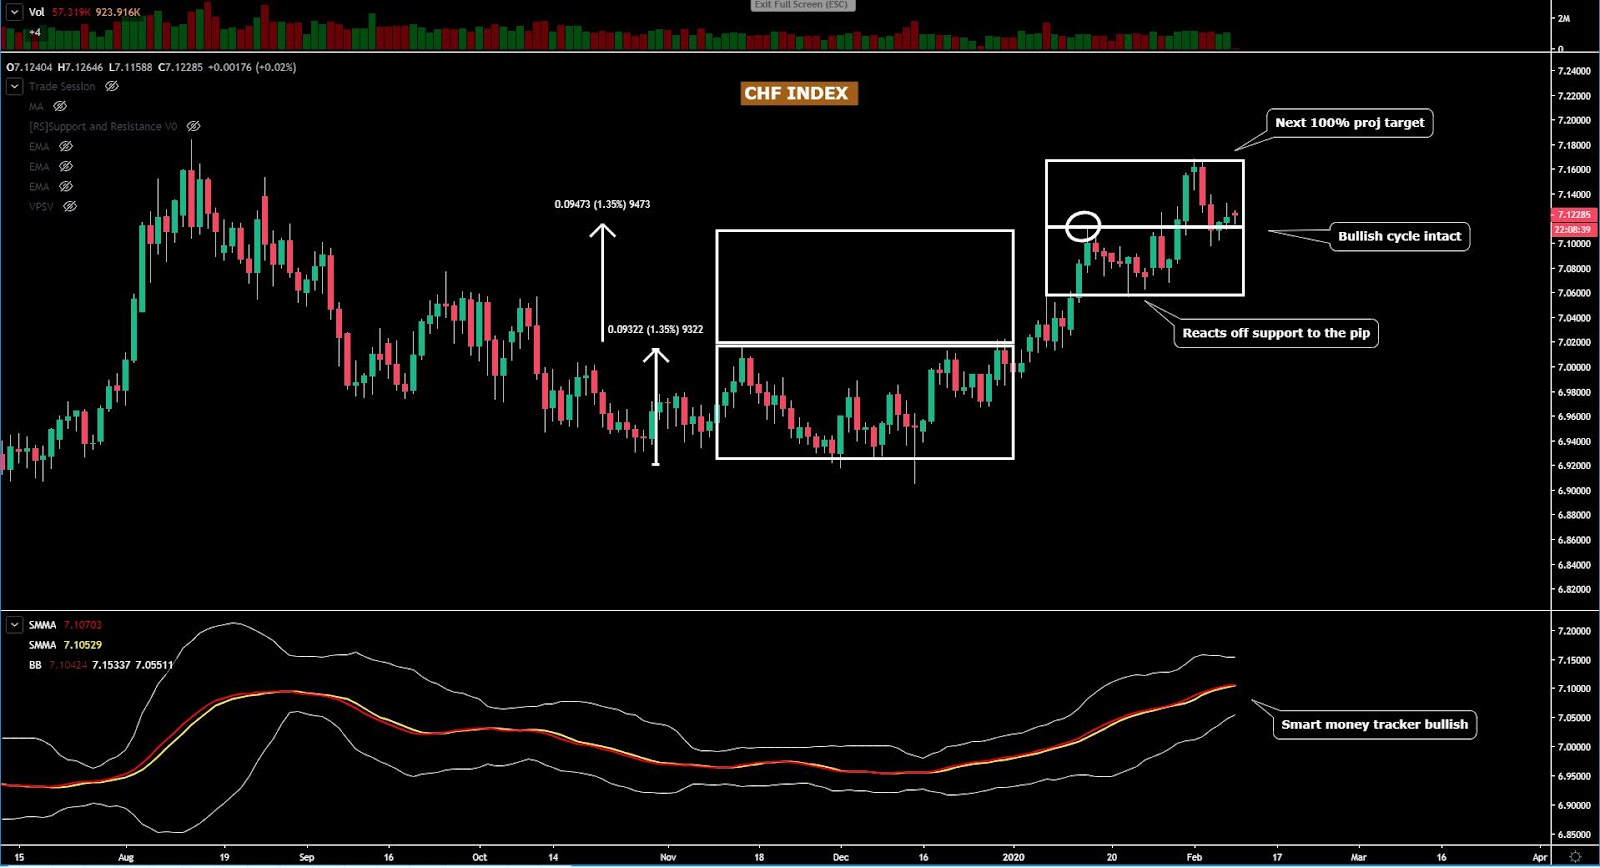
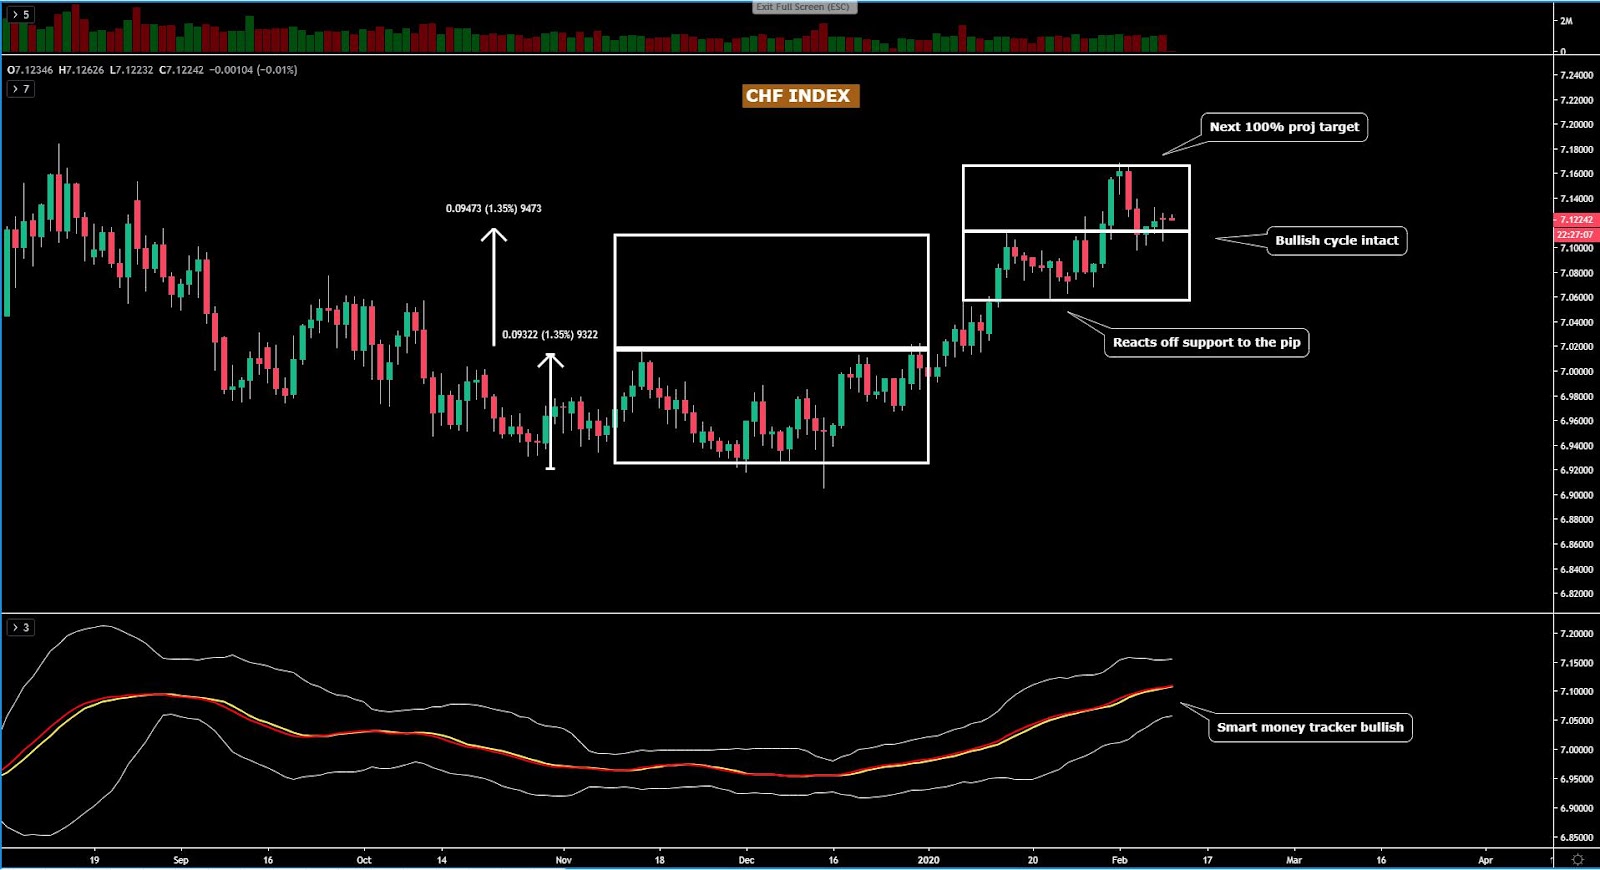
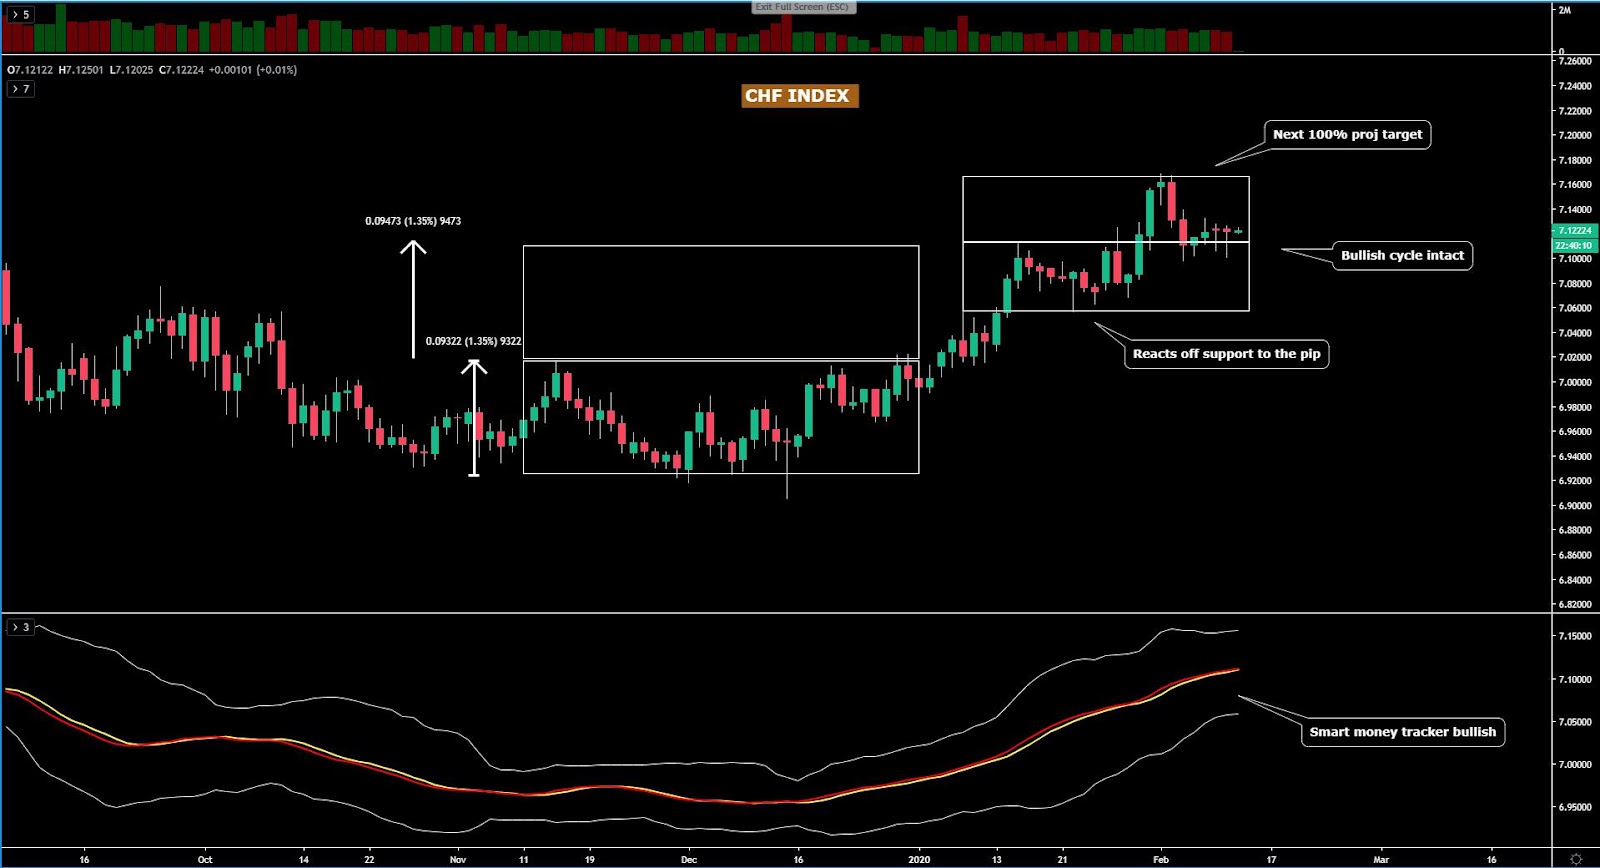
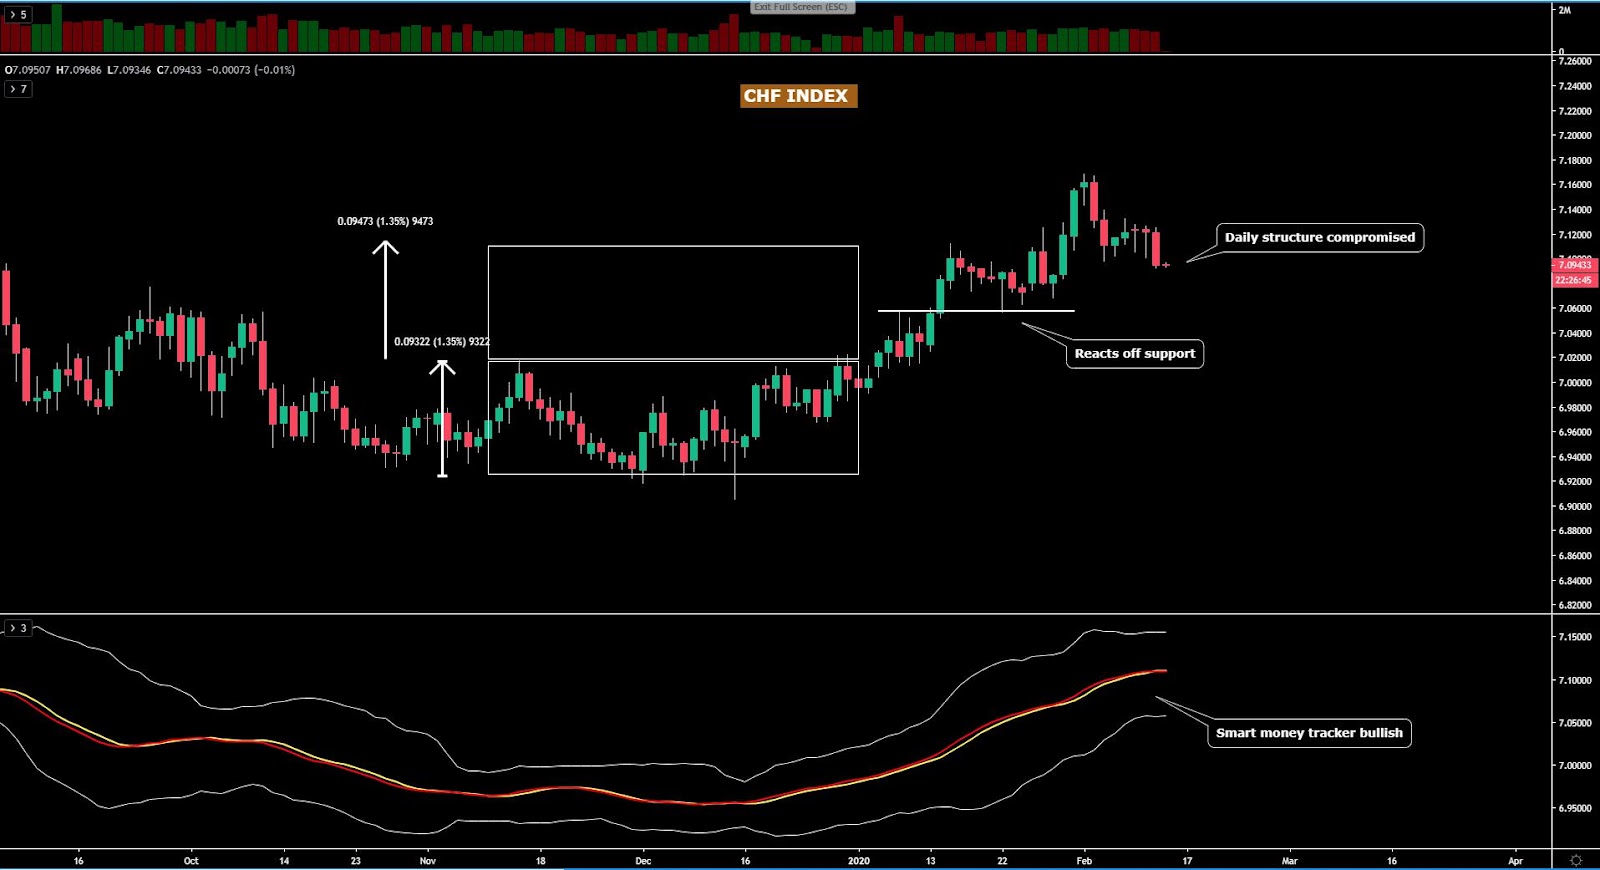
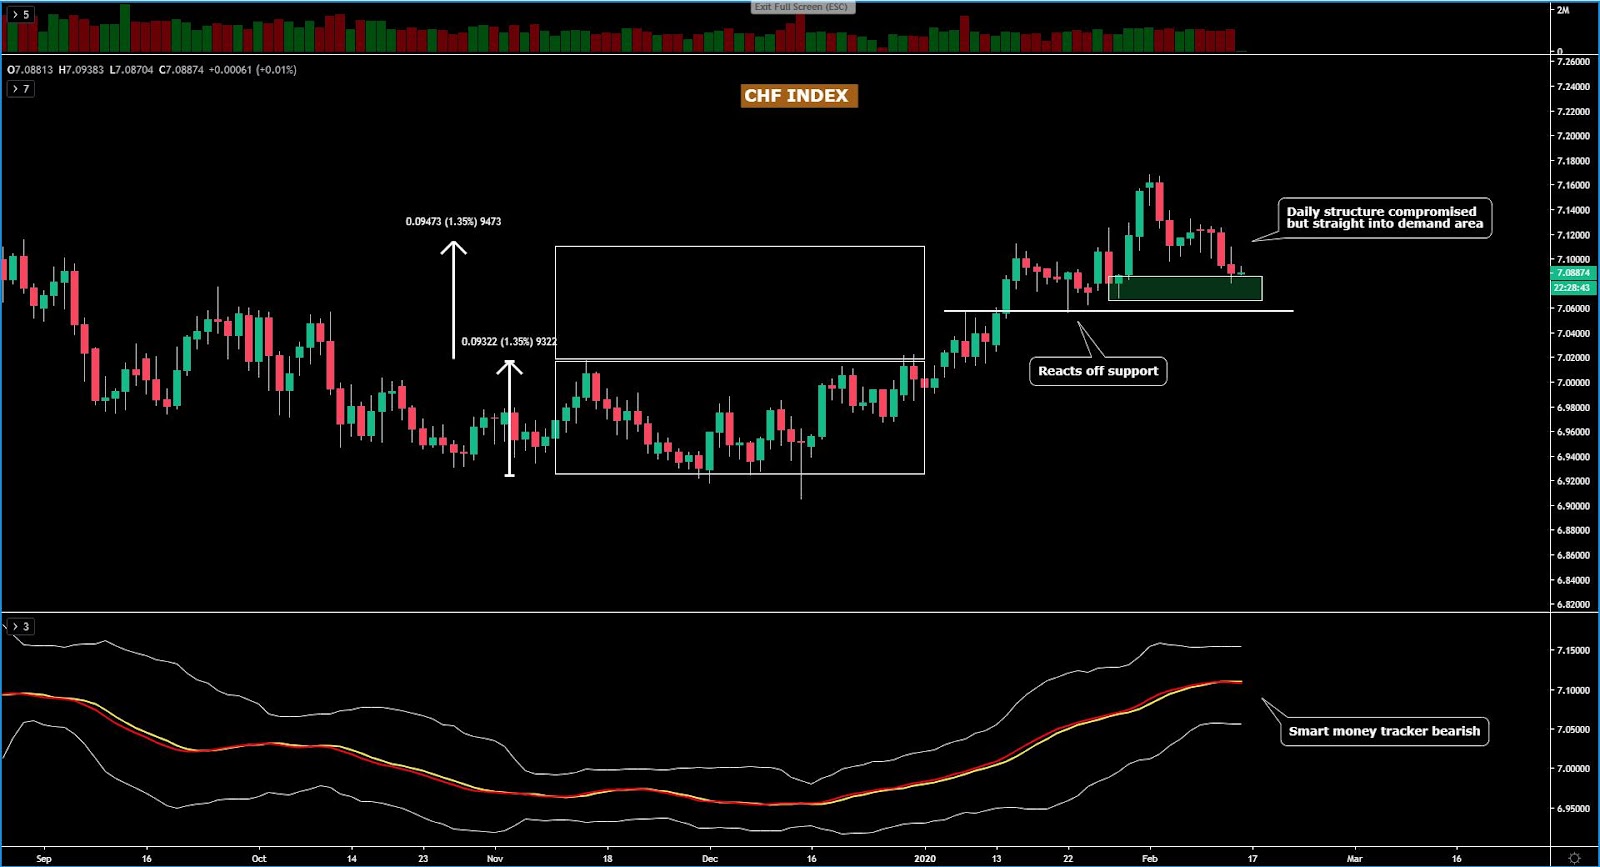
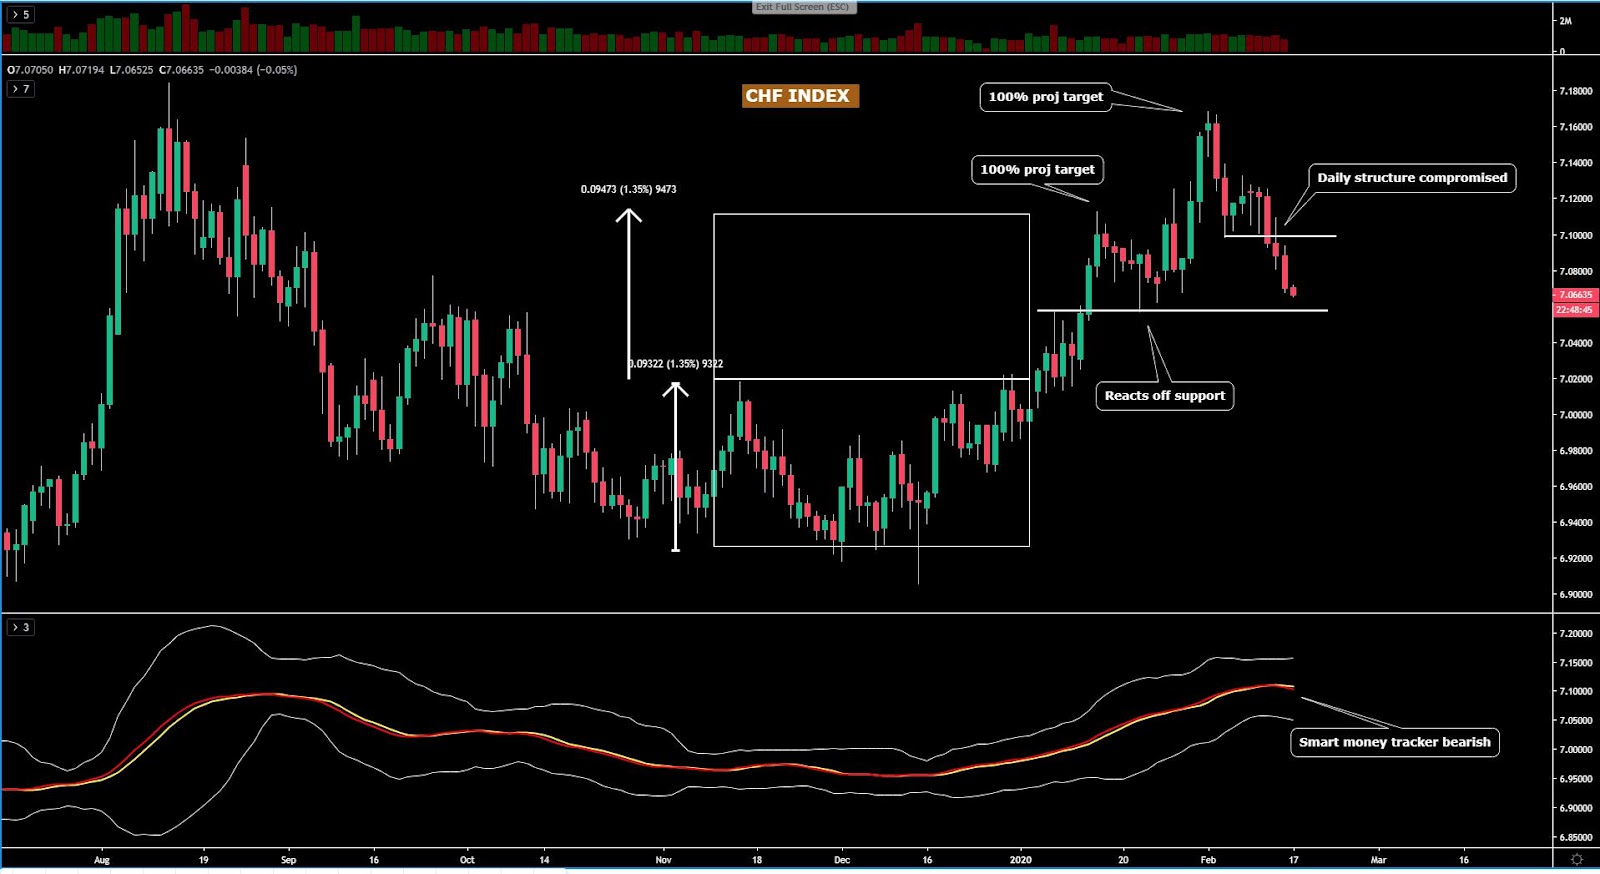
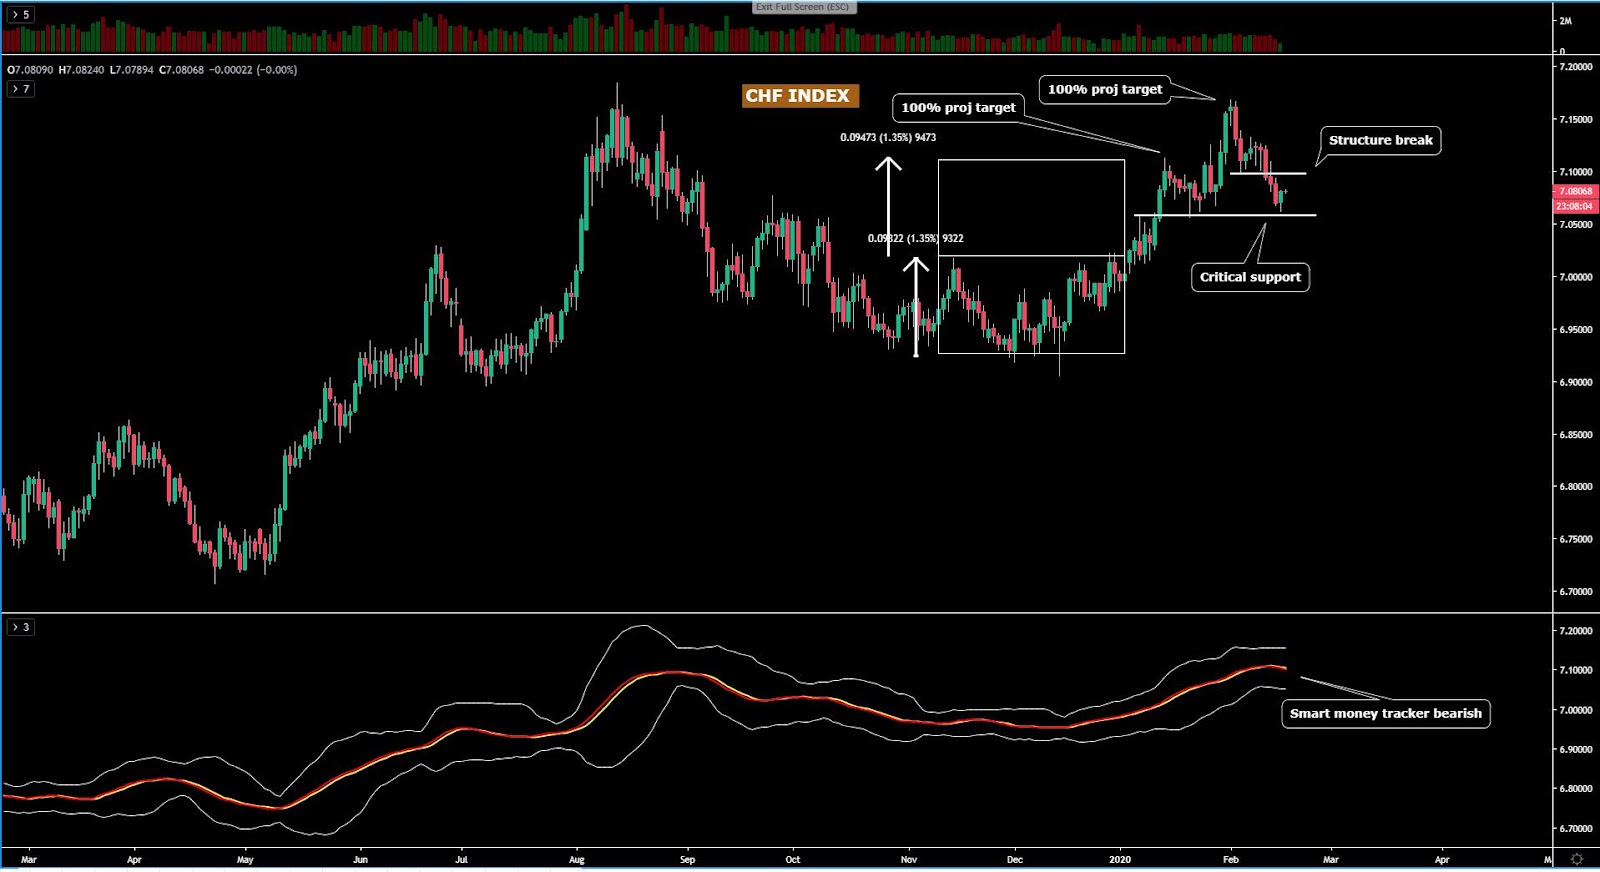
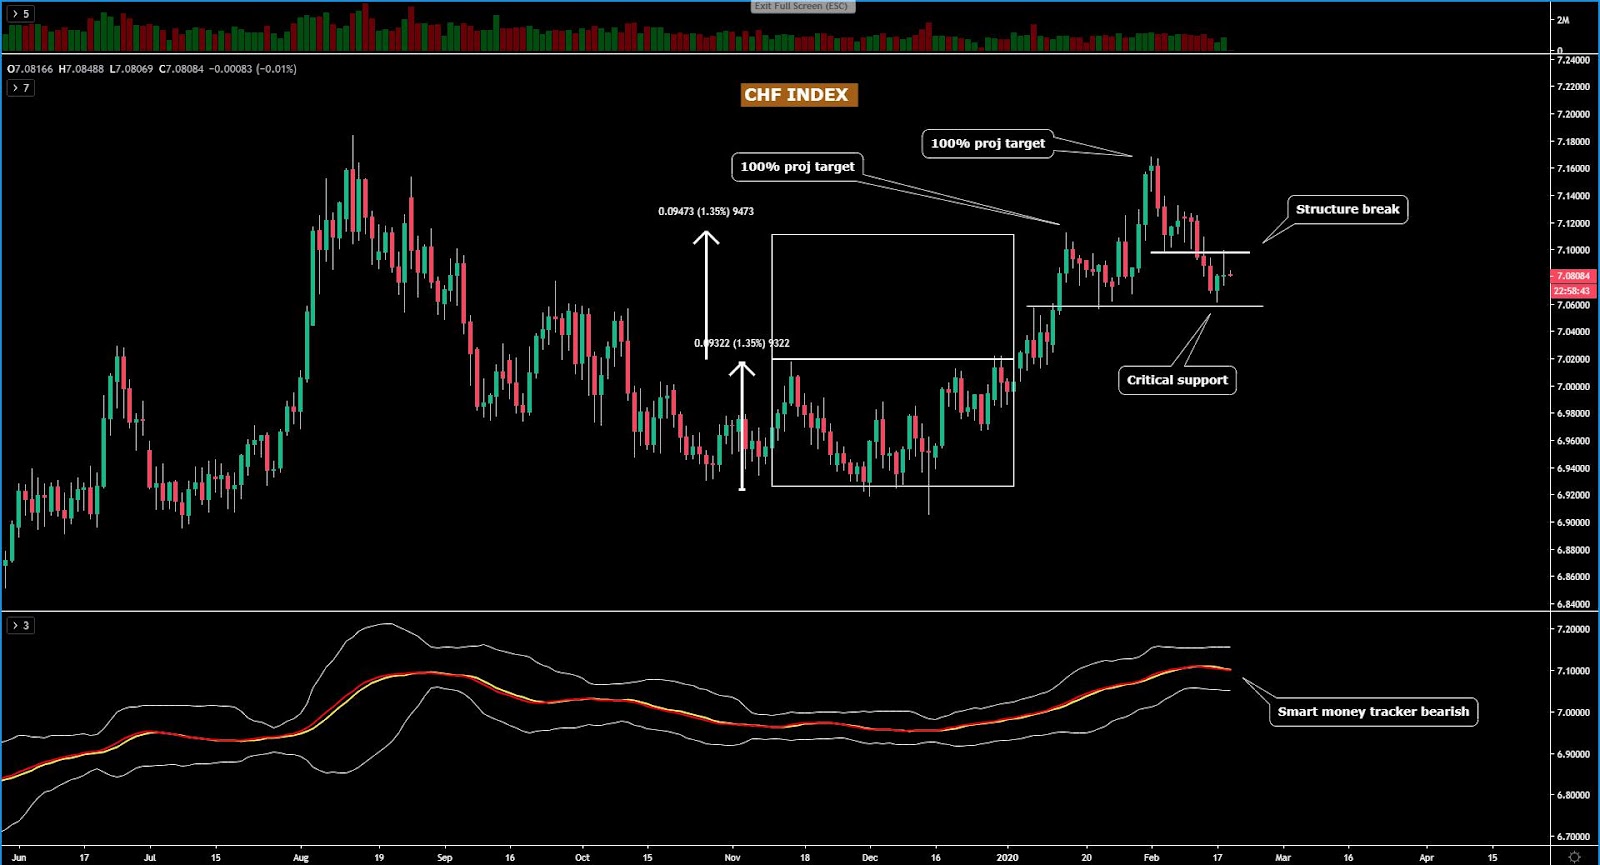
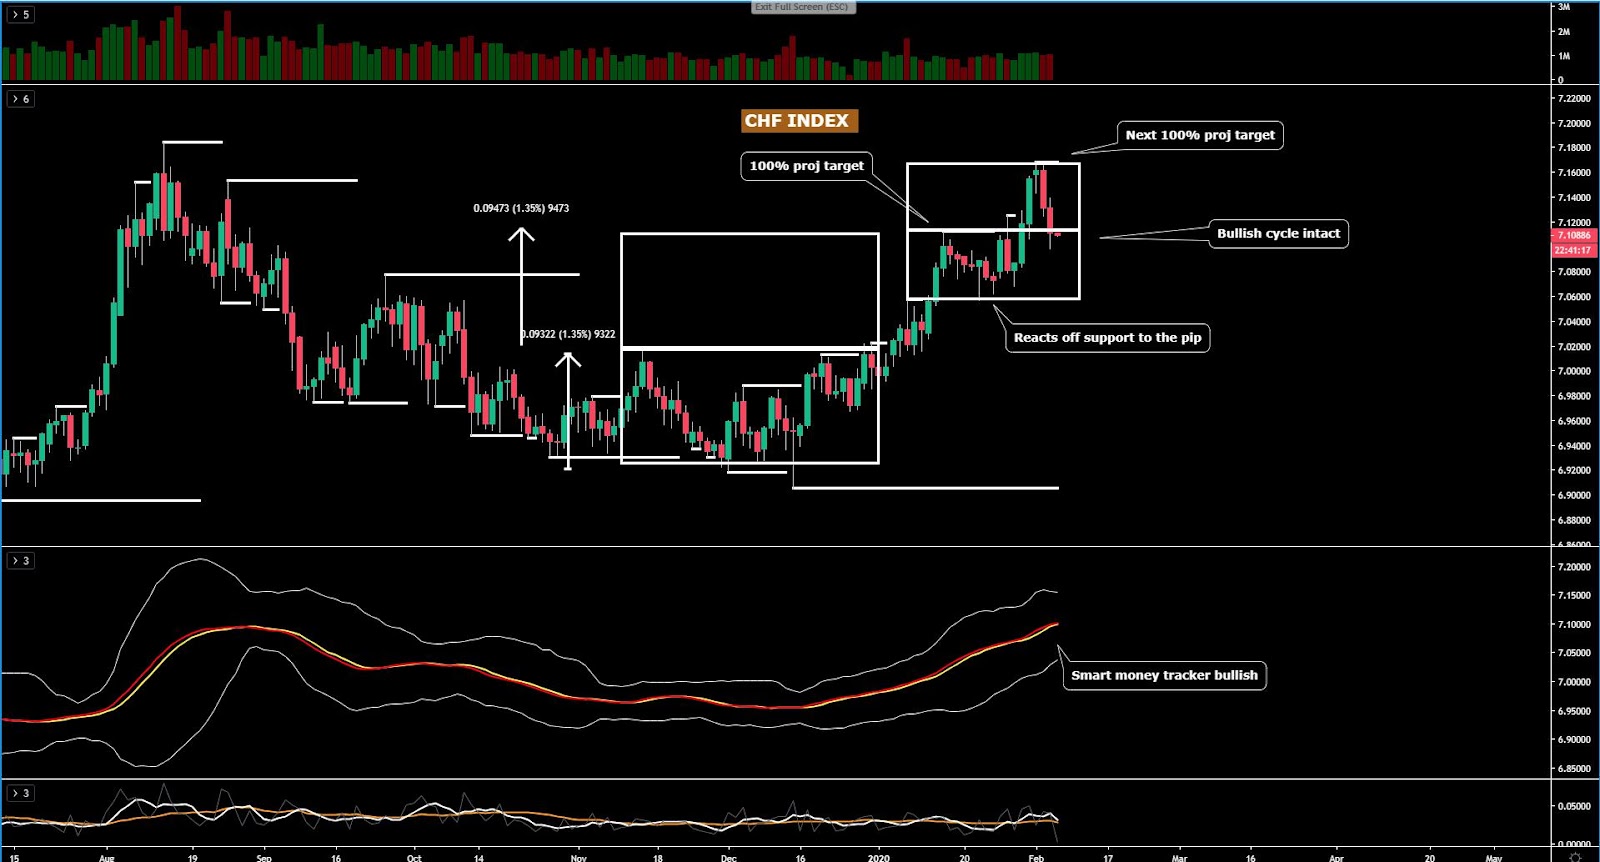
The CHF index, even if it has corrected aggressively lower for the past two days, the trade premise to support the long bias as base case has not varied. This stance is predicated on the constructive bullish price structure and the bullish momentum via the smart money tracker. What this means is that looking to gain further exposure to CHF short inventory carries a heightened level of risk given the context laid out in this summary of technicals. These are interest levels to start considering buy-side business in the currency.
Important Footnotes
Commodity-Linked Currencies Keep Attracting Demand Flows
The market continues to trade on the basis of the NCoV. News of a follow-through in the treatment of the virus, even if the details raise more questions than answers, led to a re-invigoration of the risk appetite, with the commodity-linked currencies, once again, the main beneficiaries. The moves were tantamount to what we saw earlier on Tuesday. Keep reading to stay in sync with the context at play.
The Daily Edge is authored by Ivan Delgado, 10y Forex Trader veteran & Market Insights Commentator at Global Prime. Feel free to follow Ivan on Twitter & Youtube weekly show. You can also subscribe to the mailing list to receive Ivan’s Daily wrap. The purpose of this content is to provide an assessment of the conditions, taking an in-depth look of market dynamics - fundamentals and technicals - determine daily biases and assist one’s trading decisions.
Let’s get started…
- Quick Take
- Narratives in Financial Markets
- Recent Economic Indicators
- Dive Into FX Chart Insights
- Educational Material
Quick Take
Another very strong performance by risk assets, almost analogous to the price action script seen in the prior 24h, with equities flying higher and fixed-income (bonds) dumped. The in-sync reinvigoration in these two asset classes wreaked havoc the Yen or Swissy, even if as I distill in the study of the G8 FX indices, gain further exposure to safe-haven currencies’ short inventory carries a heightened level of risk given the NCoV context we are in. By the same token, it should be troublesome that the market has bought up risk in dubious headlines about a breakthrough in the treatment of the virus, while shrugging off the factual and worsening details of a steady increase in the number of cases and death toll. Whenever the market stops going down in bad news and overplays questionable bullish news, that’s a motive to be worried. A clear winner regardless of the risk dynamics, I must state, is the US Dollar. As the aggregate flows reflect, which I detail in the charts section, it’s finally gunned through a key resistance, which opens the door to fresh bullish dynamics as part of this newly found bullish leg. US data aided the rise. The Euro, despite better EZ services PMIs, has kept the downside pressure, with an intervention by ECB Chief Lagarde failing to stimulate the price action as all she did was to touch on old news that were well telegraphed in the last ECB policy meeting. The Pound remains in a position that lacks technical clarity with swings up and down without a clear bias. It goes without saying that amid this pick up in the risk vibes, the commodity-linked currencies (AUD, NZD, CAD) have fared the best, even if technically speaking, we are far from out of the woods just yet.
The indices show the performance of a particular currency vs G8 FX. An educational video on how to interpret these indices can be found in the Global Prime's Research section.
Narratives In Financial Markets
* The Information is gathered after scanning top publications including the FT, WSJ, Reuters, Bloomberg, ForexLive, Institutional Bank Research reports.
Relentless recovery in risk appetite: Once again, stocks and bond yields have ripped higher, leading to a further reduction in what’s known as the fear index (VIX) towards the 15.00 mark from a high of 20.00 last Friday. The bid risk-sensitive instrument caught is nothing short of extraordinary as the driver of the latest jump is found is a questionable piece of information about a drug that may cure the coronavirus. This is clearly a market that keeps defying rationale and is led by emotions and headline trading. But it also reflects a behavior that is starting to suggest the NCoV may be transient even if the new cases and the death toll, as reported by the Chinese government, keeps soaring.
Dubious breakthrough in NCoV acts as the trigger: The catalyst that led to the jump in stocks or the fall in Gold, the Swissy or the Yen, came after Sky News reported that UK scientists made a 'significant breakthrough' in race for coronavirus vaccine, and even if in the details it clearly states that the vaccine “may be close to being tested on animals first, and then humans based on funding available”, which may still take a few months. As part of what’s been interpreted as a breakthrough is the fact that it reduces the part of the normal development time from "two to three years to just 14 days".
China NCoV treatment news aids risk: Almost in synchronicity to the so called breakthrough above, another headline grabbed the attention of the market, this time the main source being growing chatter on social media, and later reported by news outlets such as pharmaceutical technology. China said it has found an effective drug to treat people with new coronavirus, citing the Chinese television, which attributes this other breakthrough to the research team at Zhejiang University has found an effective drug to treat people with the new coronavirus. The two drugs found, Abidol and Darunavir, may help treat patients infected with the new coronavirus, reported Changjiang Daily.
WHO cautious stance gets ignored: Even if the WHO, via a spokesman, stated that “there are no known effective therapeutics against this coronavirus” when asked about reports of possible treatment breakthroughs, the market shrugged off these comments with risk appetite well sustained throughout the day. Later on the day, the Director-General of The World Health Organization - who has been down-playing the pandemic for days - admitted that the last 24 hours saw the biggest surge in coronavirus cases worldwide since the crisis began. Again, the market has ignored the news.
China prepares more easing measures: China continues to show a firm stance in its fight to keep the mainland markets calm as further reports suggest China is preparing to issue more tax and fiscal measures to aid the fight against the coronavirus impact in order to ensure economic stability. As part of these measures, it is planning to support banks to offer lower rates on loans to smaller firms. This news comes after the draconian measures in the money markets via massive injections of liquidity.
Nothing news from Lagarde: ECB’s Lagarde gave a speech, with the transcript found here, where she outlined that short-term uncertainties are mainly related to global risks. Lagarde went on to say that risks include trade, geopolitical and now the coronavirus outbreak. Lagarde then stated that forward guidance on rates and asset purchases act as an effective automatic stabiliser, and that climate change will be a key part of this year’s ongoing strategy review at the helm of the ECB.
CAD boosted by BOC’s Wilkins: BOC Senior Deputy Governor Carolyn Wilkins delivered a speech titled "Our Economic Destiny: Written in R-stars?" at the Economic Club of Canada, in Toronto. The net effect in the CAD after the speech was positive. In it, she sounded more optimistic than expected, especially judging by the latest dovish tilt in the BOC policy statement. The policy maker said that Canada “has avoided secular stagnation and has a strong fundamentals including the central banks policy framework”. Wilkins went on saying that “Canada is well-positioned to avoid a long period of slow growth if the right steps are taken. On rates, she said that “lower neutral rate of interest rates means central banks have less room to stimulate the economy by cutting rates; central banks have 200 basis points less room to stimulate in the traditional way.”
Russia not supporting output cuts: The price of Oil also saw a round in line with the jump in risk assets, even if news broke out later on the day that Russia is not supporting a deeper output OPEC+ cut and instead it prefers and extension of the current pact, according to Reuters sources. It appears as though finding consensus among the cartel amid a slowdown in the consumption of demand via China is, as usual, in shaky grounds, with Saudi Arabia the one, as usual, willing to kickstart cuts.
GBP falls amid MiFID 2 rewrite talk: The Pound had a sharp dip from its high after news emerged that EU policymakers are reportedly taking aim at the City of London financial industry w/ a MIFID 2 rewrite. The MiFID 2 stands for Markets in Financial Instruments Directive, and is a legislative framework instituted by the EU to regulate financial markets in the bloc and improve protections for investors to ensure fairer, safer and more efficient markets and facilitate greater transparency for all participants via the standardization of practices across the EU.
Green shoots in EZ/UZ services PMIs: European services PMI data for January came better in Italy, while in France it disappointed a tad. However, in the engine of growth for Europe, that is Germany, it recorded an impressive 54.2, which was unchanged from the flash estimate but it confirmed the jump from the previous 52.9 in December. The Euro Zone services activity also vindicated its pick up, which plays into the view of a slightly more optimistic ECB when it comes to economic stabilisation. In the UK, the January services activity also increased at 53.9 from 52.9.
Strong data out of the US: We had two strong fundamental readings out of the US. First off, the ADP US January employment data came at +291K vs +158K expected, which to put things into perspective, represents the best print in about half a decade. Secondly, the January ISM non-manufacturing came slightly better at 55.5 vs 55.1 expected, with the comments as part of the report a bit more optimistic. For a full summary of the ISM report, it can be found here.
RBA retail sales disappoint: Australia Retail Sales for December came in at -0.5% m/m vs -0.2%, leading to an initial fall in the Aussie. In a way, this is an adjustment lower after the strong Nov figure, so the market was expecting a poor read, but not to such an extent.
If you found this fundamental summary helpful, just click here to share it!
Recent Economic Indicators & Events Ahead
Source: Forexfactory
Insights Into FX Index Charts
The indices show the performance of a particular currency vs G8 FX. An educational video on how to interpret these indices can be found in the Global Prime's Research section. The idea of this analysis is to complement one’s daily bias by accounting for this holistic analysis.
If you found the content in this section valuable, give us a share by just clicking here!
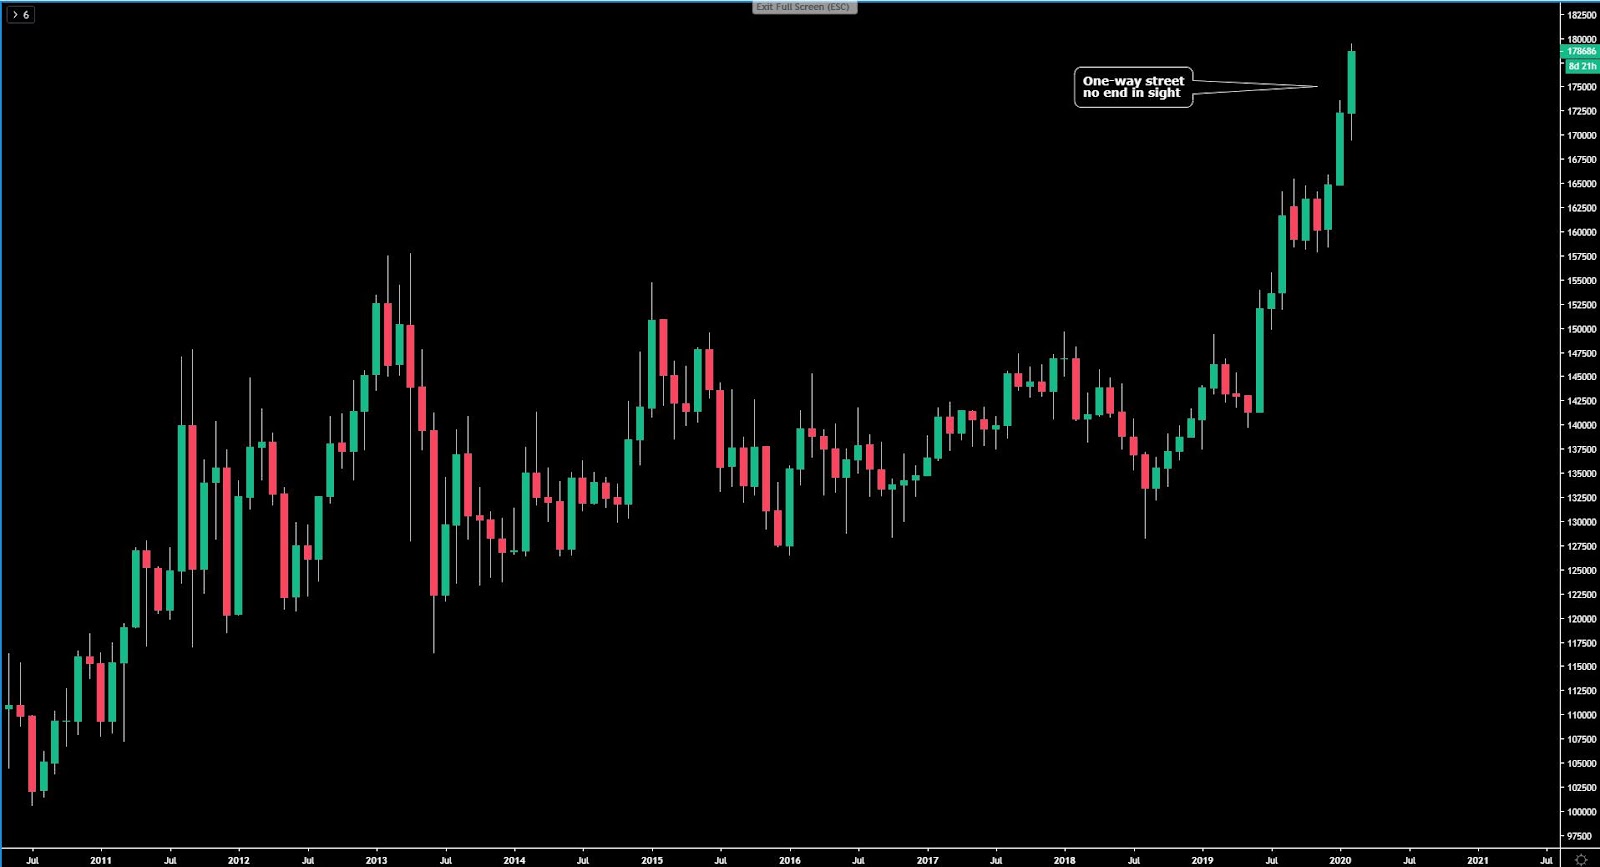
The risk dynamics keep improving. The S&P 500 is flirting with a new record high at a time when US bond yields (long-duration) keep rising. This move up in locksteps during this week sets up the stage for a perfect bearish storm in the Yen or Gold, the latter subject to USD strength, which is what we are seeing, hence why Gold is also plummeting. The reinvigorated risk profile comes as the Yuan also keeps strengthening or the VIX keeps easing from its elevated levels of 20.00, last close around the 15.00.
The EUR index, despite the latest two days of sell-off from a critical resistance, should see buy-side interest emerging fairly soon, with the downside largely cap to a maximum fall of around 0.2% for today, based on the technical picture. The demand imbalance that I am envisioning is predicated on the basis of segmented cluster of bids to be found between the origin of the supply bar that led to the last breakout and a support line as per the multiple lows that were found prior to the mentioned downside breakout. Note, the bullish momentum off the daily is still valid based on the smart money tracker, despite the structure being range-bound.
The GBP index, on the back of a rejection off its 100% projection target, got sold off in a strong fashion only to see the a horizontal support acts as a line of defence for buyers.Wednesday’s price action was largely inconclusive, in the context of a market that still needs to provide extra clues to gain more clarity on the next directional bias. For now, the fact that equal lows were formed during the flattening of the bollinger band suggests an expanded range formed. The establishment of a bearish cycle will only be validated if we see a breakout of the prior swing low with acceptance below. Until then, there is not enough evidence to overcommit on the GBP.
The USD index has, at last, confirmed a technical resolution above a critical resistance point that had led to a pause in the uptrend. However, the steady demand flows have not abated, and as the aggregate flows in the chart below suggest, the is fresh upside potential for a possible extension towards the double top seen through Nov last year, which translates in the prospects of additional gains to the tune of 0.8% from the current levels, so not too shabby. The technical indicators via price structure and bullish momentum point at the bull bias to stay intact.
The CAD index, while rebounding strongly off the lows and printing a bullish engulfing pattern, still finds itself trading in a well established bearish trend. Therefore, the risk of further buying is likely to face substantial oppression as the price structure and the momentum via the smart money tracker are both pointing to more losses ahead. My base case is that the index is set to find further follow through continuation as part of its ongoing bearish cycle in a descend that may be targeting the next 100% projection target at the Dec double bottom.
The JPY index has closed the upside gap from last week. I struggle to envision much follow through in the Yen as technicals stand. We have a still very treacherous environment concerning the NCoV, that combined with the bullish price structure in this market, alongside the bullish slope in the money tracker, it tells me that the market may not be just yet done adding Yen long exposure. The level certainly looks attractive as it’s acted as support/resistance every time there has been an interaction through it.
The AUD index, for those that remain bullish, I’d say that it must be done at your own peril, as the index has certainly reached an inflection point where a shift in order flow back down is a scenario that would be in congruence with the dominant bearish price structure. Make no mistake, this is a market still in correction mode in the context of a bearish trend, which still has the backing of smart money tracker slope pointing lower. I will reiterate that while I did endorse staying away from Aussie shorts from the overly extended levels, that’s now changed, as the currency has finally hit a technical level of significance to sell into if entry setups agree.
The NZD index sees no change in its outlook. The story line that I am reading here is that buying interest emerged off a line of strong support. However, the pick up in buy-side pressure is in contradiction with the daily technicals, which remain outright bearish. Therefore, any longs would be in defiance of the dominant trend as seen on the daily. Keep adding into NZD long exposure at your own risk, and be aware that the price structure and the order flow via the smart money tracker imply the risk of shorts taking back control is a realistic prospect.
The CHF index, even if it has corrected aggressively lower for the past two days, the trade premise to support the long bias as base case has not varied. This stance is predicated on the constructive bullish price structure and the bullish momentum via the smart money tracker. What this means is that looking to gain further exposure to CHF short inventory carries a heightened level of risk given the context laid out in this summary of technicals. These are interest levels to start considering buy-side business in the currency.
Important Footnotes
- Market structure: Markets evolve in cycles followed by a period of distribution and/or accumulation. To understand the principles applied in the assessment of cycles, refer to the tutorial How To Read Market Structures In Forex
- Horizontal Support/Resistance: Unlike levels of dynamic support or resistance or more subjective measurements such as fibonacci retracements, pivot points, trendlines, or other forms of reactive areas, the horizontal lines of support and resistance are universal concepts used by the majority of market participants. It, therefore, makes the areas the most widely followed and relevant to monitor. The Ultimate Guide To Identify Areas Of High Interest In Any Market
- Fundamentals: It’s important to highlight that the daily market outlook provided in this report is subject to the impact of the fundamental news. Any unexpected news may cause the price to behave erratically in the short term.
- Projection Targets: The usefulness of the 100% projection resides in the symmetry and harmonic relationships of market cycles. By drawing a 100% projection, you can anticipate the area in the chart where some type of pause and potential reversals in price is likely to occur, due to 1. The side in control of the cycle takes profits 2. Counter-trend positions are added by contrarian players 3. These are price points where limit orders are set by market-makers. You can find out more by reading the tutorial on The Magical 100% Fibonacci Projection