IvanGlobalPrime
Company Representative
- Messages
- 36
Find my latest market thoughts
Exodus Of CAD Longs, GBP Soars Ahead Of BOE
The Forex market has finally seen the light at the end of its obscure tunnel with volatility, even if it may prove to be an ephemeral anecdote, soaring amid an aggressive adjustment in the BOC policy expectations to a significantly more dovish stance. Want to find out the rest of drivers and what currencies look set to benefit from the latest lively ebbs and flows? Dive into the report to find out...
The Daily Edge is authored by Ivan Delgado, 10y Forex Trader veteran & Market Insights Commentator at Global Prime. Feel free to follow Ivan on Twitter & Youtube weekly show. You can also subscribe to the mailing list to receive Ivan’s Daily wrap. The purpose of this content is to provide an assessment of the conditions, taking an in-depth look of market dynamics - fundamentals and technicals - determine daily biases and assist one’s trading decisions.
Let’s get started…
Quick Take
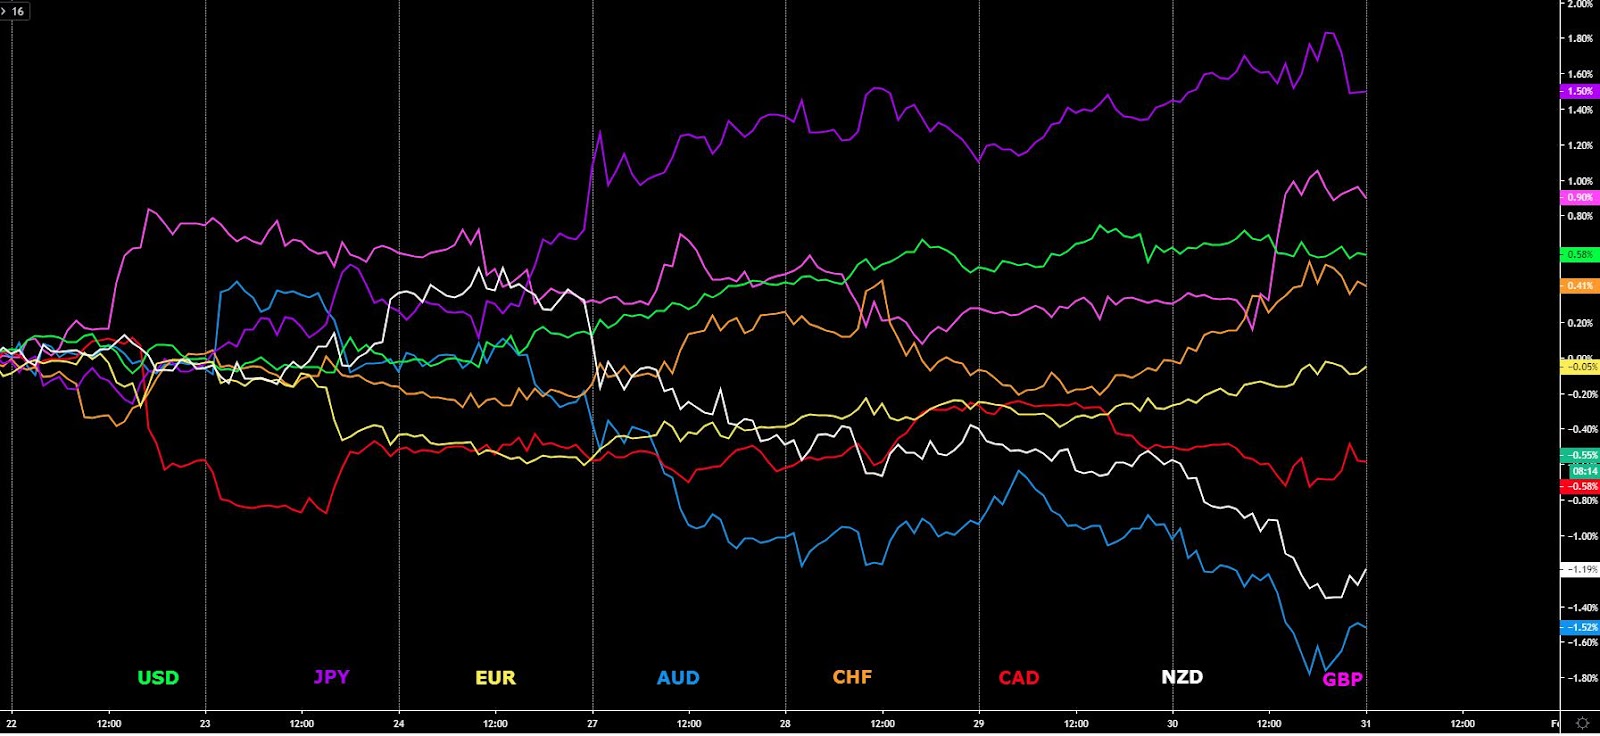
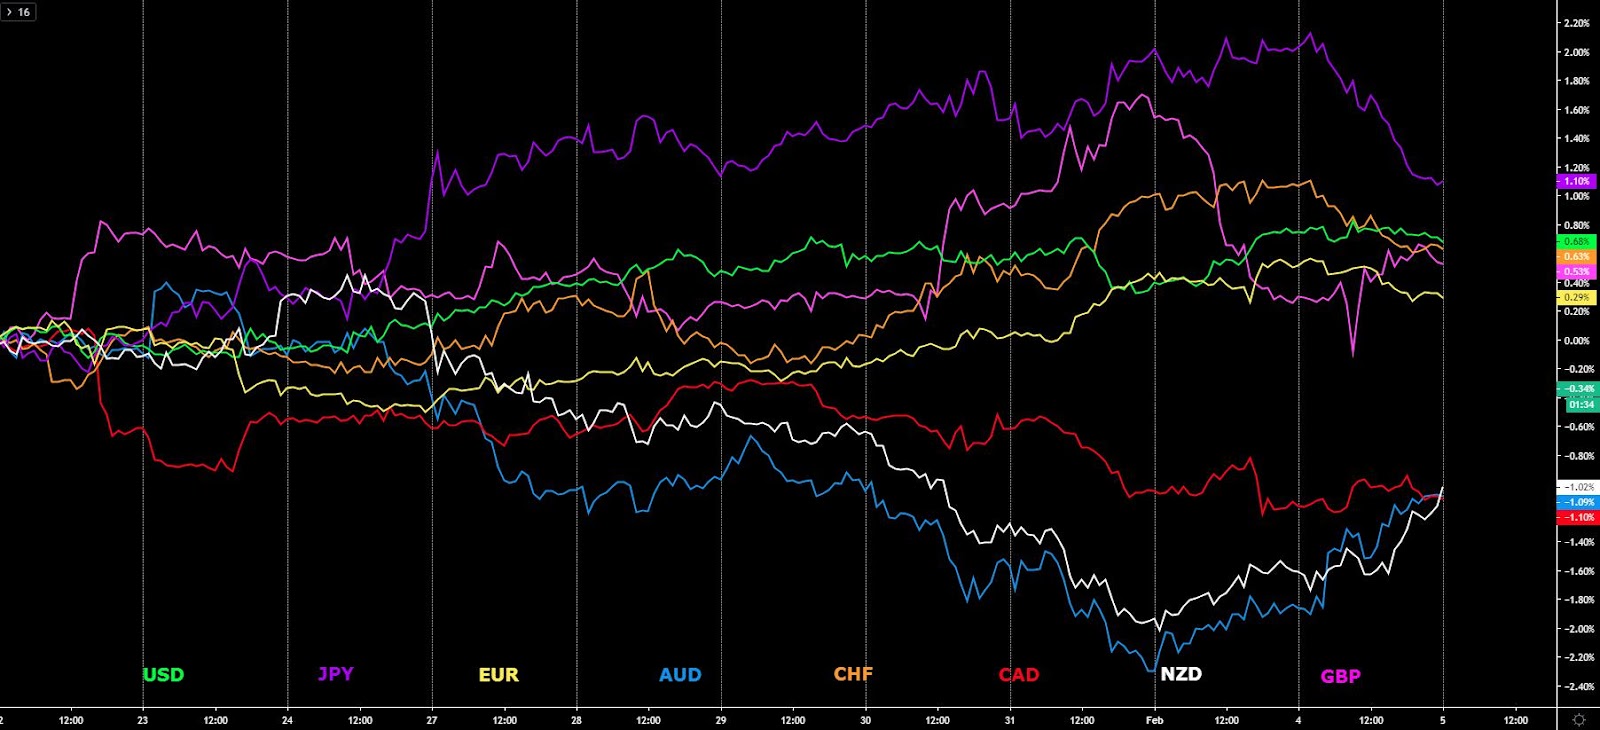
The Pound has been, by a fair margin, the currency paying the most dividends for those with long-side exposure ahead of next week’s BoE policy meeting. Price action, which in the case of the Pound, has been rather constructive this week, goes a long way to decipher the true intentions of the market, diminishing the risk of marrying you to a bias just because the hype as of late it’s been that the BOE may lower rates next week. Well, it turns out, the market had clearly other intentions, aided by the highest quarterly business optimism among UK factories (UK CBI report) since April 2014. The Aussie is another currency flying high after a solid jobs report in Australia even if remains at the very tail of performing currencies in January. Again, such behavior, may have defied logic if one had been fixated in the US-China trade deal as the catalyst for higher prices as opposed to price action and the monitoring of the AUD index, which told us a different story. The Swissy, meanwhile, is a currency that just keeps on giving those those committed to buy the dips in what’s, together with the USD, the top performing currency this month. In stark contrast, the Canadian Dollar was completely annihilated by market forces as the BOC did a 180-degree turnaround on its monetary policy stance, openly recognizing that lower rates are back on the table for the next few months. In response, the CAD saw one-way transit flows. The Euro is the currency to shift the focus towards in the next 24h, as the ECB is up next. As I argue in today’s report, watch out for some type of hawkish surprise by the CB, even if just at the margin. The Yen, amid a mixed-bag of risk dynamics, with US equities and global bonds in stand-by, also portrays choppy price action amid a short-term correction of its bear tendencies. China’s efforts to contain the coronavirus has also contributed to appease market fears even if the situation is still fluid, with the WHO to decide today if the crisis is declared an international emergency. Lastly, the Kiwi is going nowhere fast, with an absence of fundamental drivers as of late.
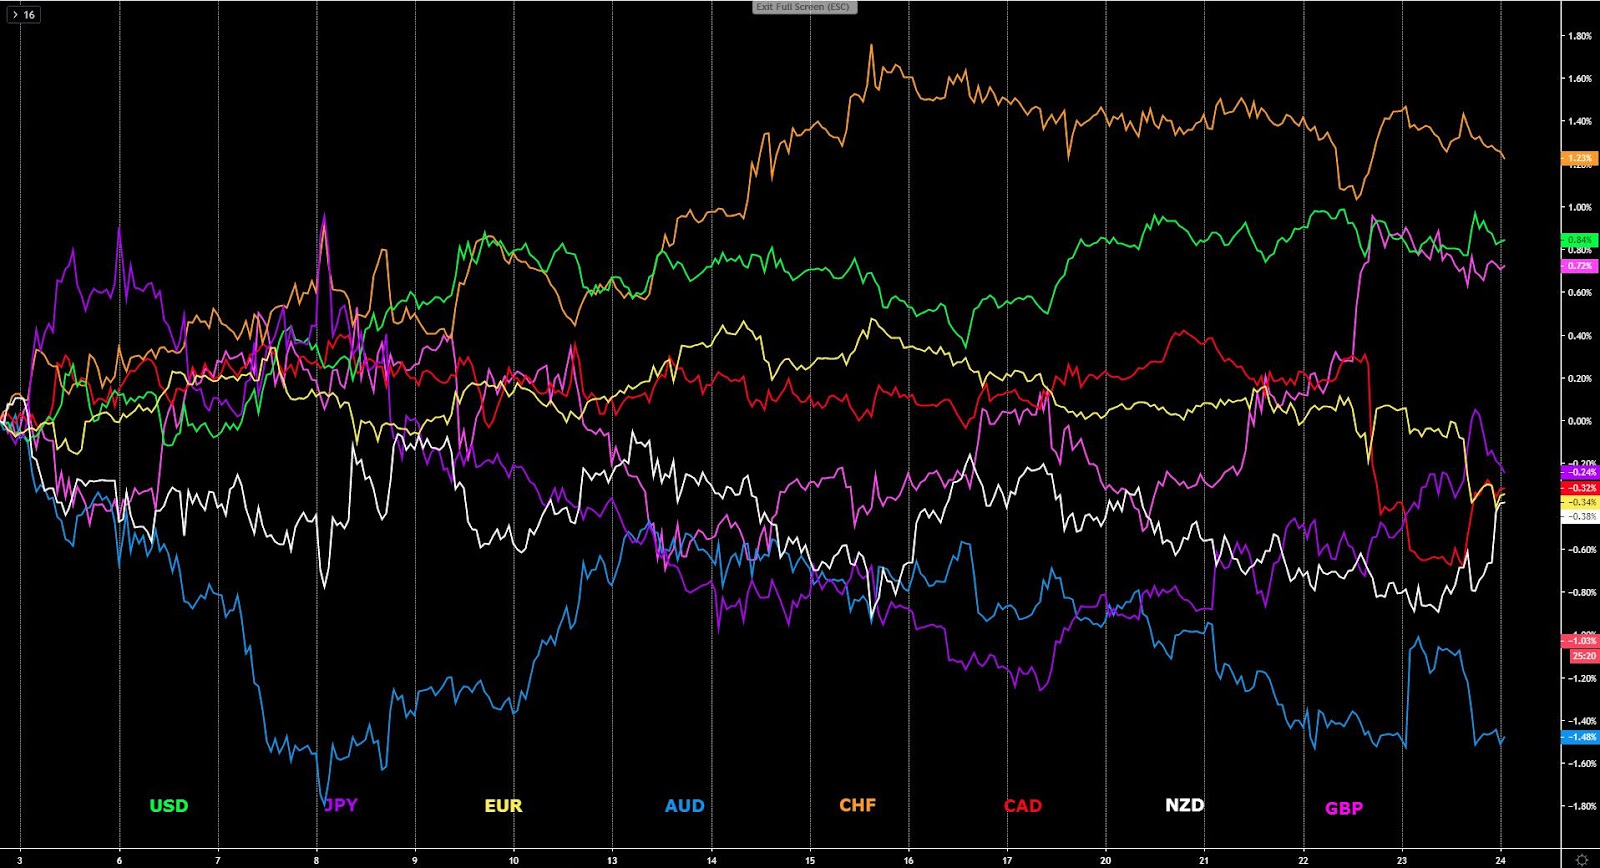
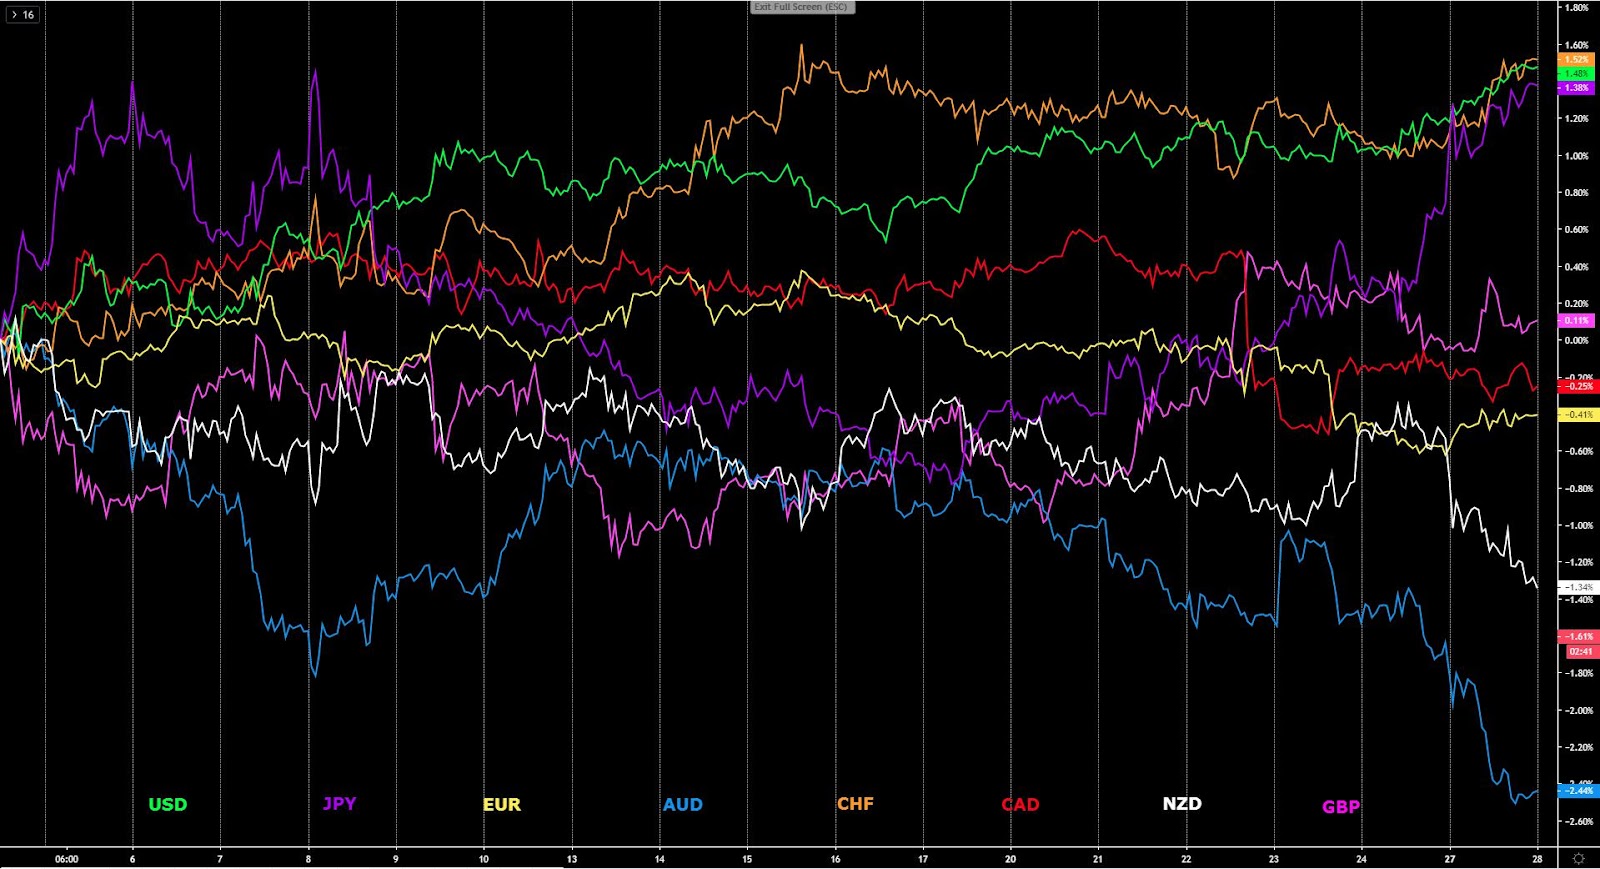
The indices show the performance of a particular currency vs G8 FX. An educational video on how to interpret these indices can be found in the Global Prime's Research section.
Narratives In Financial Markets
* The Information is gathered after scanning top publications including the FT, WSJ, Reuters, Bloomberg, ForexLive, Institutional Bank Research reports.
The Pound soars as BoE rate cut bets unwound: The Pound continues to roar ahead as the top performing currency aided by the latest rise in the UK CBI report, which saw quarterly business optimism among UK factories jumped sharply, highest since April 2014. The strengthening of the Pound also comes as a by-product of the market going through second-thoughts on the BOE rate cut pricing for next week. The odds of a 25 bps rate cut on 30 January when the BOE meets fell under 50% from over 70% on Friday.
Johnson's Brexit to go into law: In other Pound news, even if that’s water under the bridge for Mr. Market, Boris Johnson's Brexit deal passed through UK parliament and the law goes to the Queen for royal assent. Remember, this was fully priced in on election day when Johnson secured a majority in parliament. Right now, as a driver for the Pound, we must focus on the UK economy, the BOE rate cut pricing and the ongoing negotiations of the future trade relationship with the EU.
The CAD was taken to the woodshed: This was in response to the BOC policy statement, which came more dovish-than-expected. Even if the BOC left rates unchanged at 1.75% as expected, there were a number of factors that worsened the outlook for rates to remain neutral. The chance of a Bank of Canada rate cut for the March 4 meeting has gone up to about 30% in the OIS market from 6%, while in April 15, odds of a cut rose to 51% from 22% yesterday.
Plenty of dovish remarks by the BOC: The BOC removed the description of the key rate being 'appropriate', which is a hint that they see downside risks to maintaining it where it is. The BOC added dovish remarks such as they will watch closely "to see if the recent slowdown in growth is more persistent than forecast." They also pointed to the resilience of the Canadian economy but outlined indicators since Oct MPR as mixed (the surprise index is at the lowest since 2009). The Bank also argued that the Canadian economy is no longer operating close to capacity, while noting that indicators of consumer confidence and spending have been unexpectedly soft.
Polox reaffirms dovish turnaround: If CAD traders did not have sufficient reasons to justify the short exposure, BOC's Poloz presser clearly hinted that a rate cut was considered by noting that the lowering of the interest rate wasn't warranted 'at this time', with financial vulnerability concerns weighing against cut. Poloz said that “the overall excess capacity in the Canadian economy has increased, which will bring a degree of downward pressure on inflation,'' while adding that “we received a string of disappointing consumer readings”, with much of BOC deliberations today, as Poloz notes, “ focused on persistence of slowdown.” All around, some dovish stuff to digest for CAD traders.
Canadian CPI inflicts further pain to the CAD: The Canadian December CPI came slightly softer at +2.2% vs +2.3% y/y expected, leading to a further deterioration in the CAD outlook. The details on the core measures were not very encouraging either as both the median and trim also failed to post as steady results as expected. Ironically, while the expectations could not be met, all three BOC core measures have found a base above the 2% BOC mandate.
WHO holds decision on coronavirus for Thursday: In terms of the ongoing concerns about the spread of the coronavirus, the World Health Organization decided to delay its decision on whether to declare coronavirus an int'l emergency. They will meet again on Thursday to make a decision. The WHO director General Tedros said that “the decision on whether to declare coronavirus outbreak and international emergency until Thursday,'' adding “Coronavirus is an evolving and complex situation.” Tedros went on to say “our team is on the ground in China to investigate the outbreak and get more information.”
China seeks to contain virus: The markets seems to have calmed on the coronavirus concerns as according to China's CCTV, the Chinese city of Wuhan where the virus originated from, did suspend outbound flights and rail services. Hu Xijin, a mouth-piece for the Chinese government working for the Global Times, tweeted: “Shutting down outbound transportation of a provincial capital city is unprecedented in China since 1949. Didn't do so even during SARS in 2003. This is a forced step since virus is expanding fiercely. It will greatly increase the chance of epidemic being contained.” It’s worth noting, however, that the report death tolls has doubled in the last 24h with 10 people so far dead and hundreds infected.
Aussie jobs remove the risk of a rate cut by the RBA in Feb: The Australian December employment report came in much better than expected with the unemployment rate dropping to 5.1% (expected 5.2%), while the headline employment change was +28.9K, almost triple the expected 10.0K. In terms of the breakdown of full vs part time jobs created, the full time employment chang was barely changed at -0.3K, with the part time at +29.2K. The participation rate came at 66.0% as expected. The report should remove the risk of a rate cut by the RBA next week despite the concerns on the economic impact of the bushfires, which is seen as a double-edged sword as it will also create more jobs during the recovery.
ECB a EUR long risk event? The ECB policy meeting is due today and is likely a non-event despite the balance of risk, if the latest minutes is anything to go by, could be a hawkish surprise. In the last minutes, the ECB did outline a mild increase in inflation and growth outlook. The ECB, sooner or later, may have to recognize the improving data we are seeing even if that’s occurring from the context of depressed conditions. Similarly, another admission that may aid the EUR is the fact that fewer headwinds exists as US-China trade deal and Brexit have relaxed. Watch for the discussion about the risk balance shifting to "neutral" in coming meetings.
Trump warns on EU tariffs: Something for EUR traders to keep an eye is the latest warning on EU tariffs by Trump. Trump said “I have a date in my mind for EU tariffs, it is a fairly quick date”. For now, the statement should only be read as a warning if he can't get a deal with the EU, even if he still admitted that his base case is a deal to be struck with the EU before the US election.
As does Mnuchin... US Treasury Secretary Steven Mnuchin also flexed his muscle on Europe, saying that the US could use tariffs on automobile imports against countries that decide to apply their own taxes on technology companies. “If people want to just arbitrarily put taxes on our digital companies, we will consider arbitrarily putting taxes on car companies,” Mnuchin said. “We think the digital tax is discriminatory in nature.”
SNB committed to intervention if CHF keeps appreciating: The SNB member Maechler said the Swiss Central Bank remains committed and ready to intervene in FX markets if needed, with FX reserves a result of monetary policy. The headlines come after the US treasury put Switzerland on the watchlist as a currency manipulator, even if that has done little to tame down the interventionist commentaries by the SNB.
If you found this fundamental summary helpful, just click here to share it!
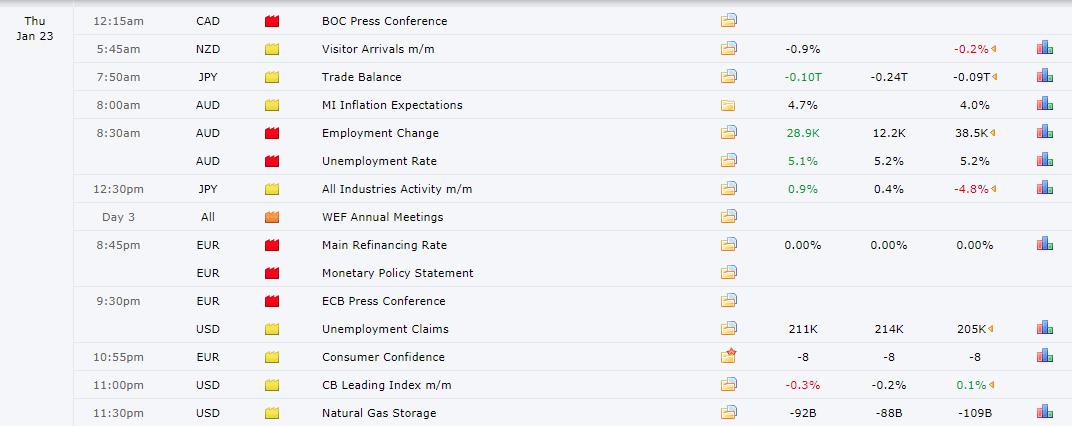
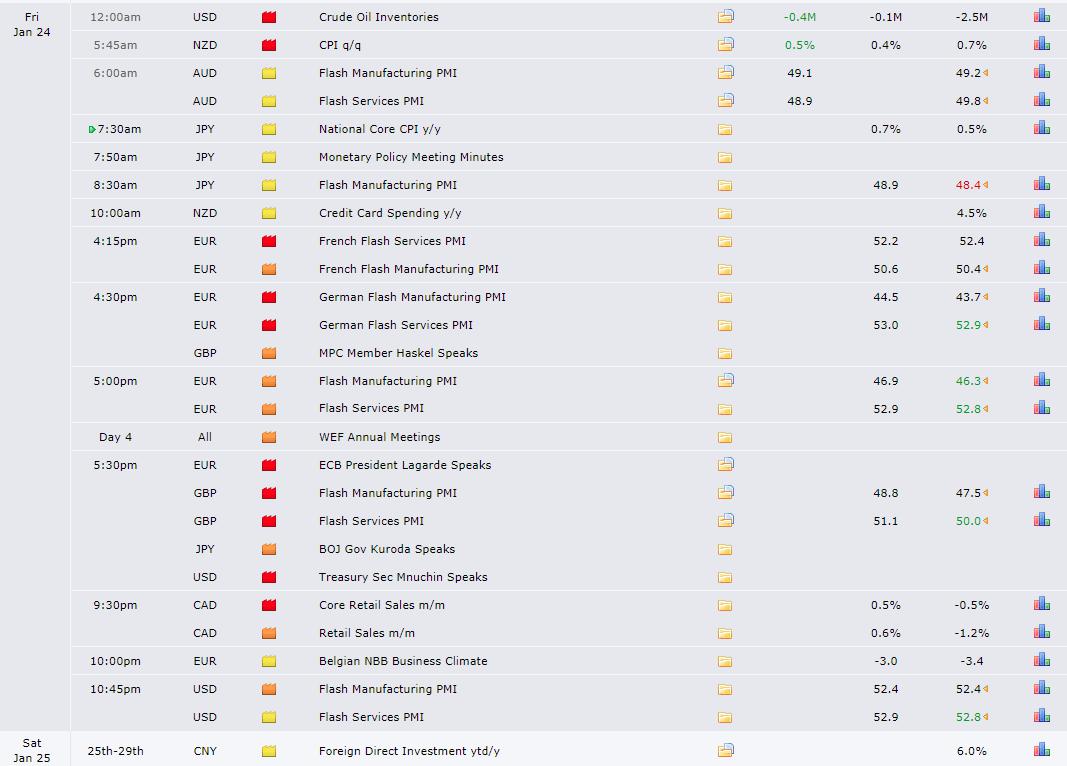
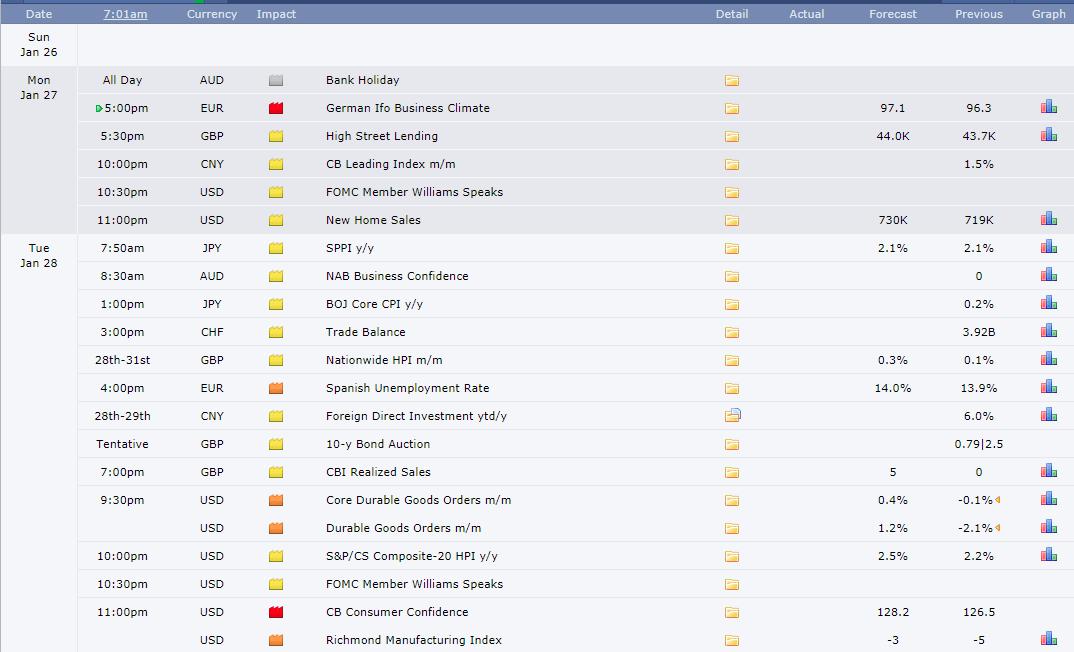
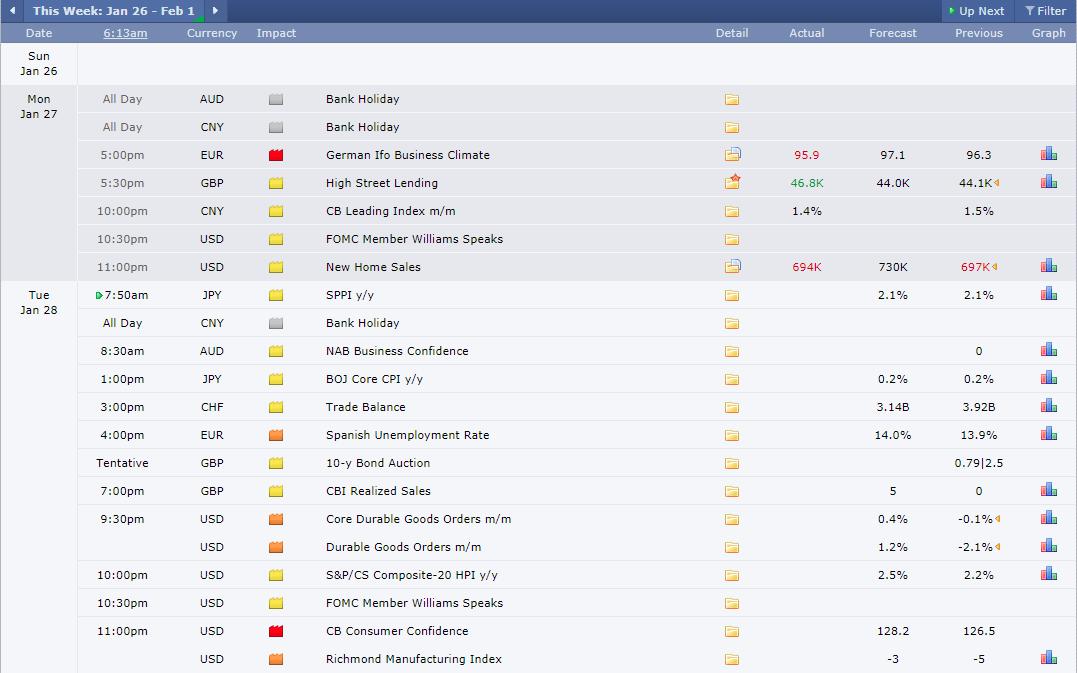
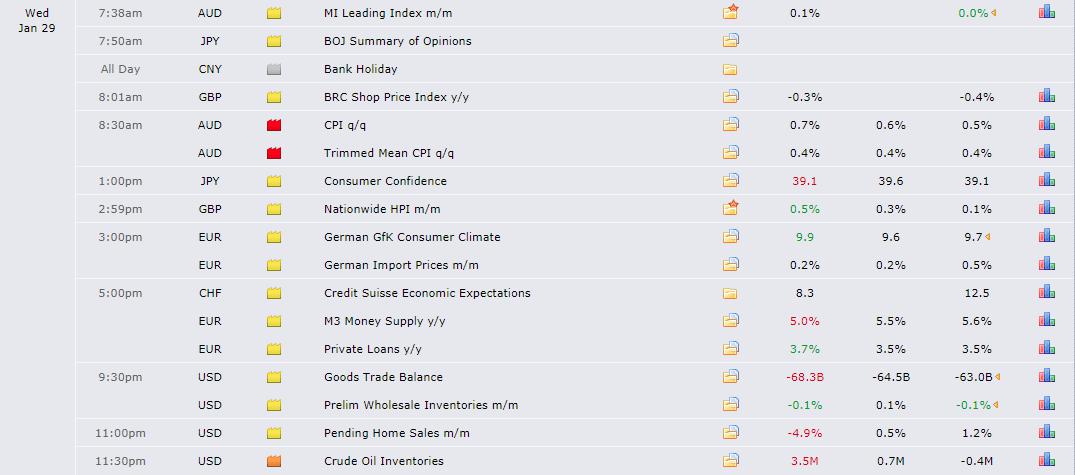
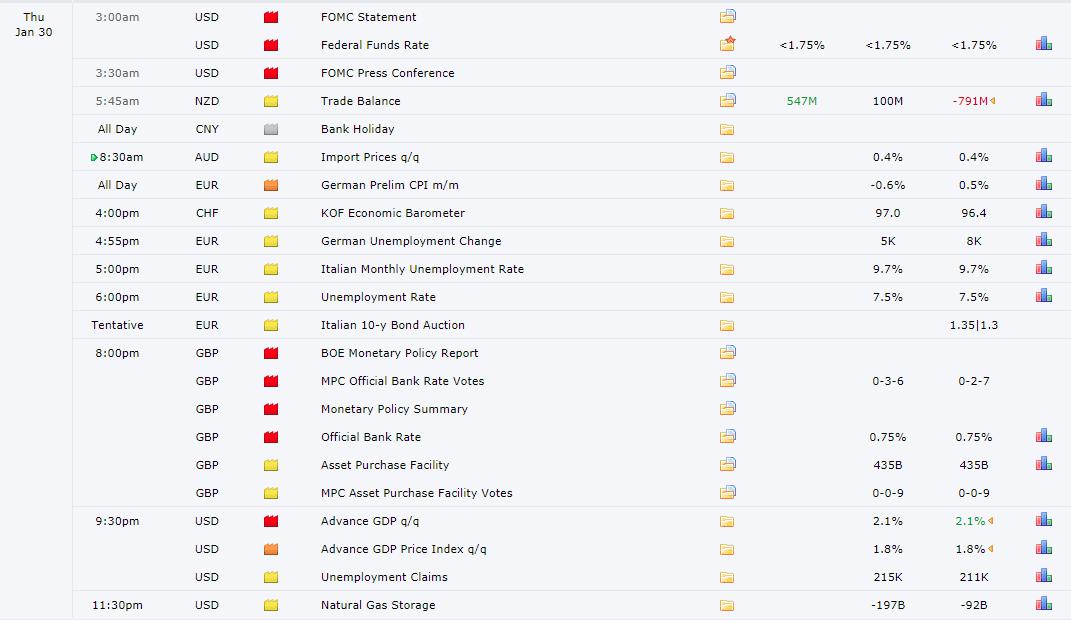
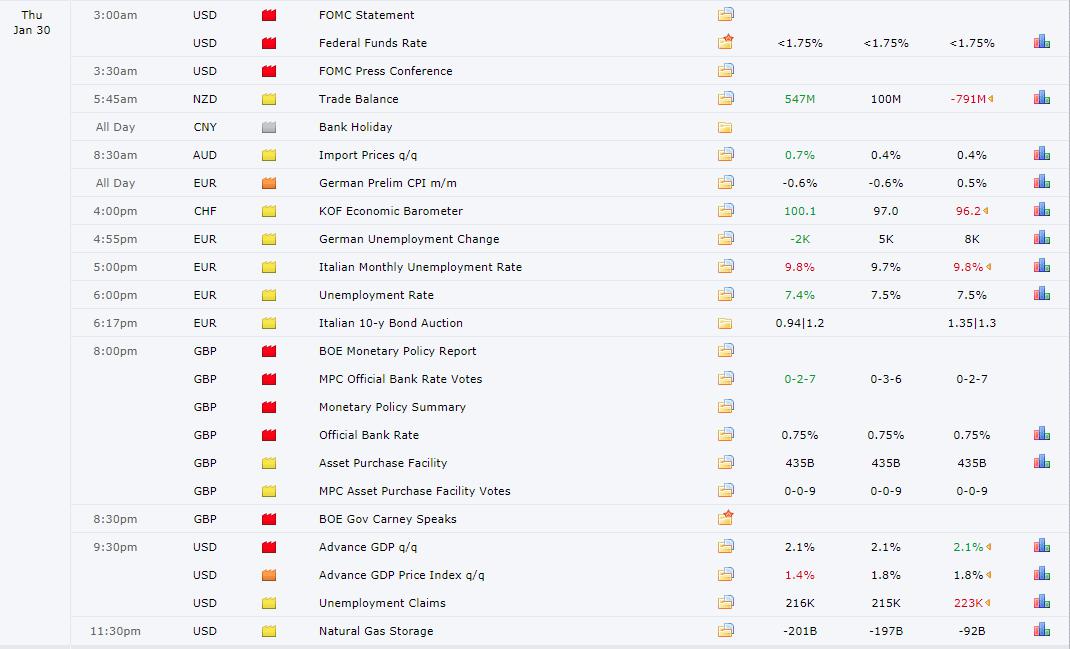
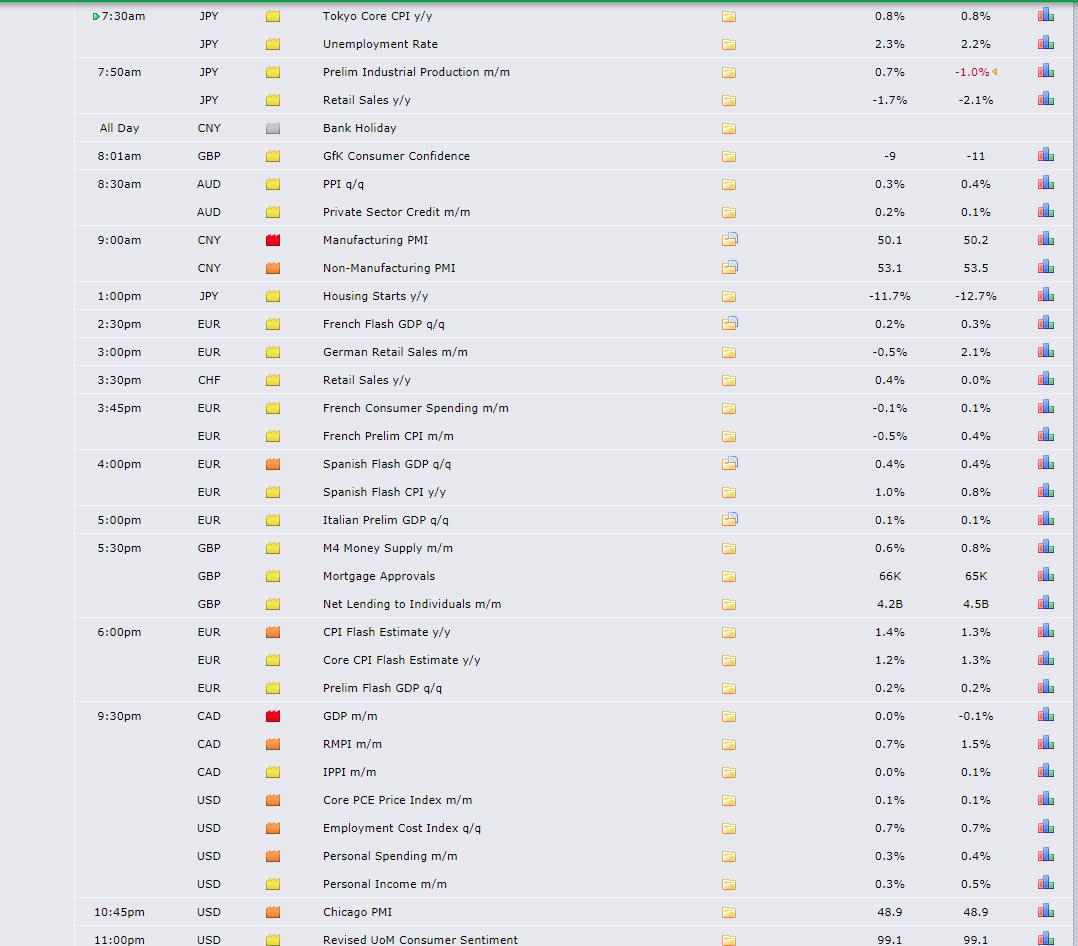
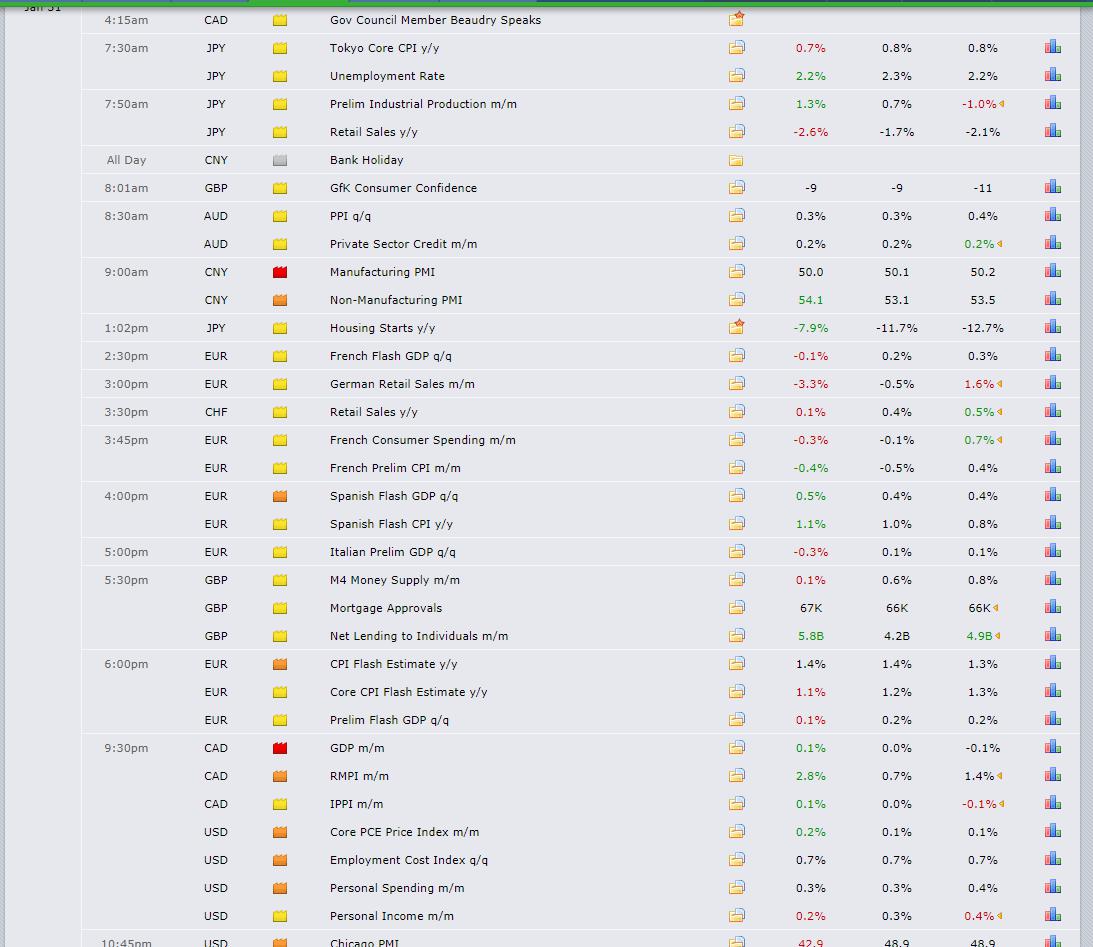
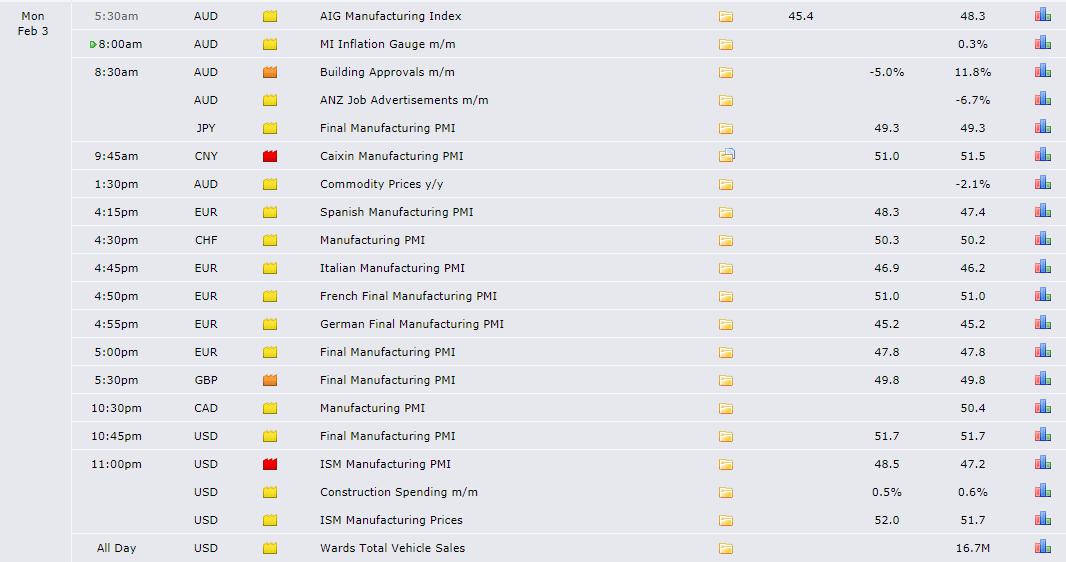
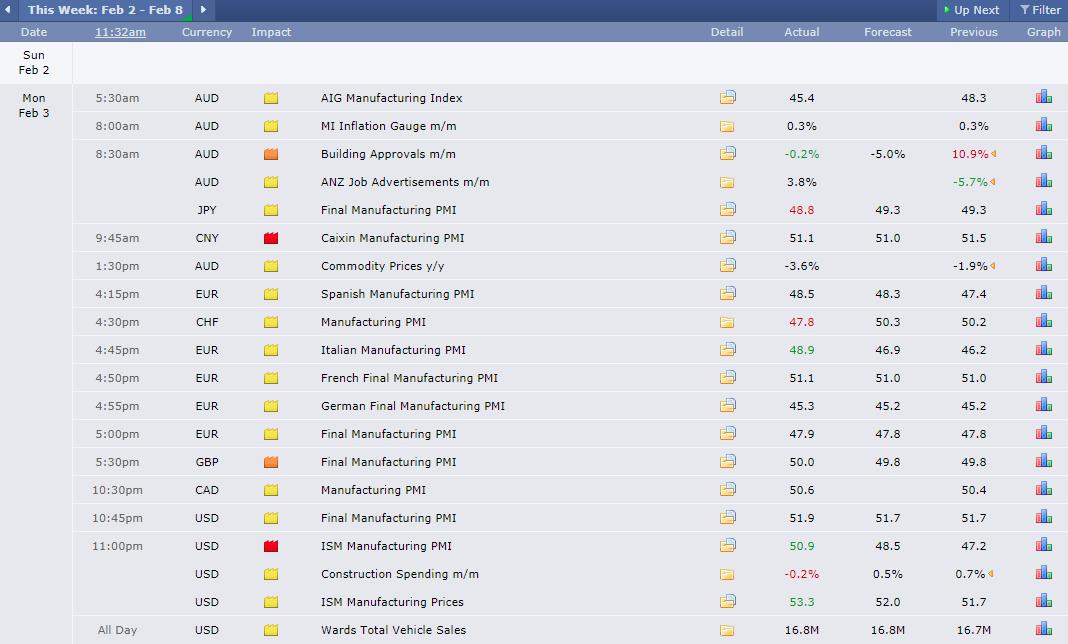
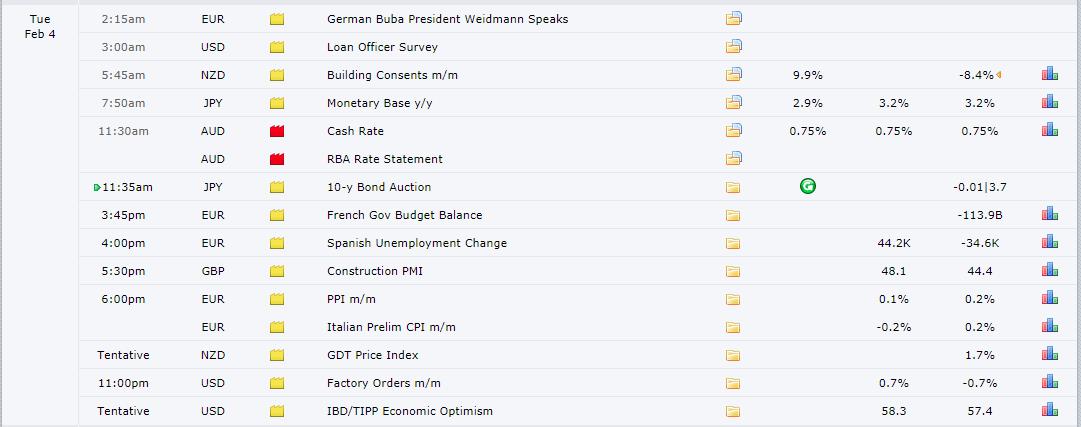
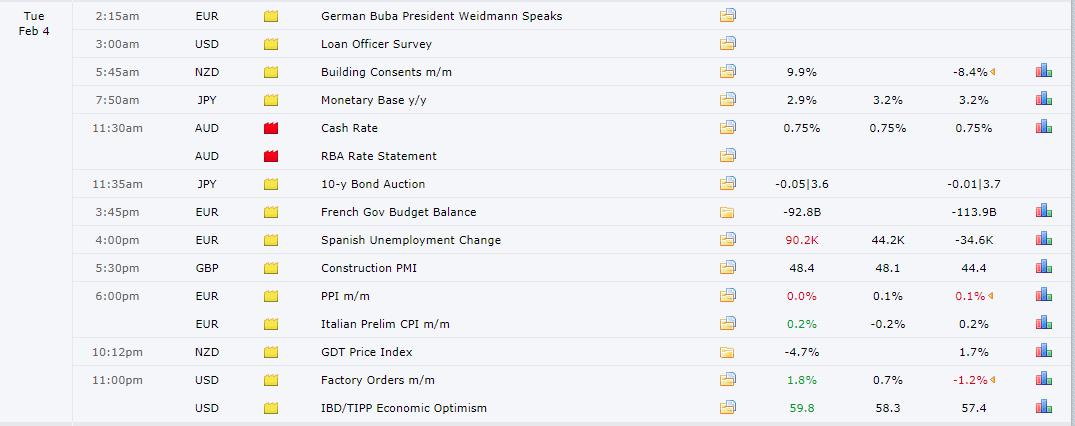
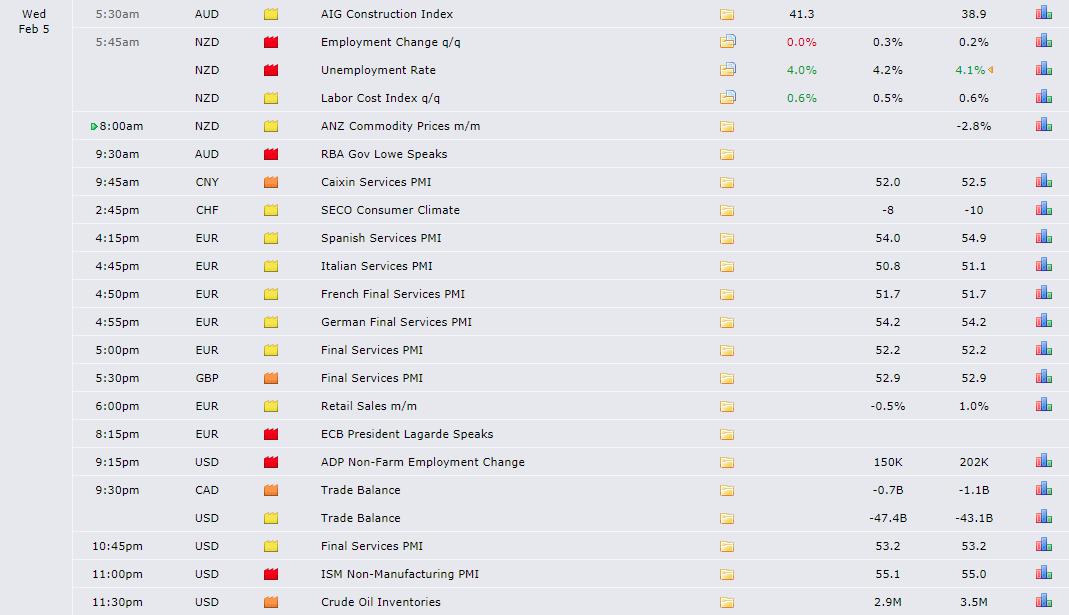
Recent Economic Indicators & Events Ahead
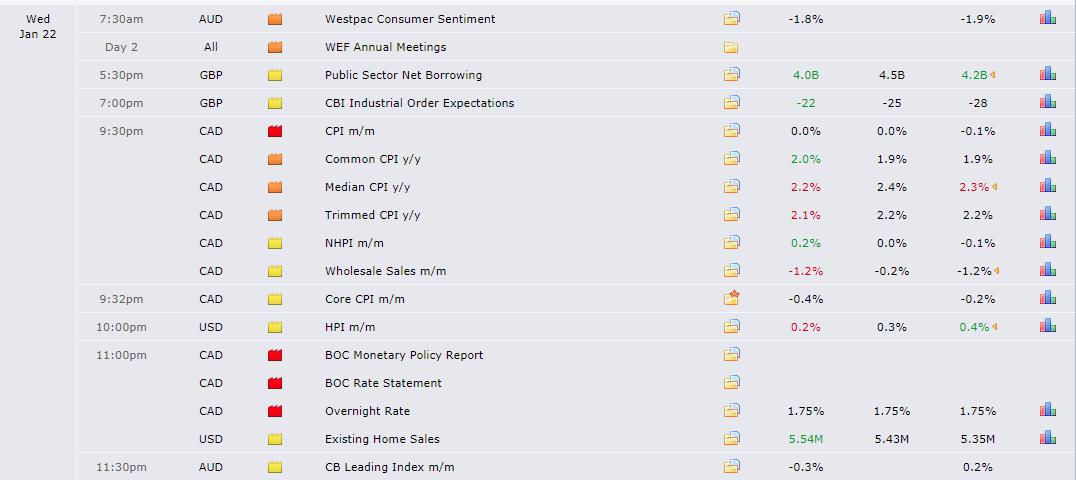
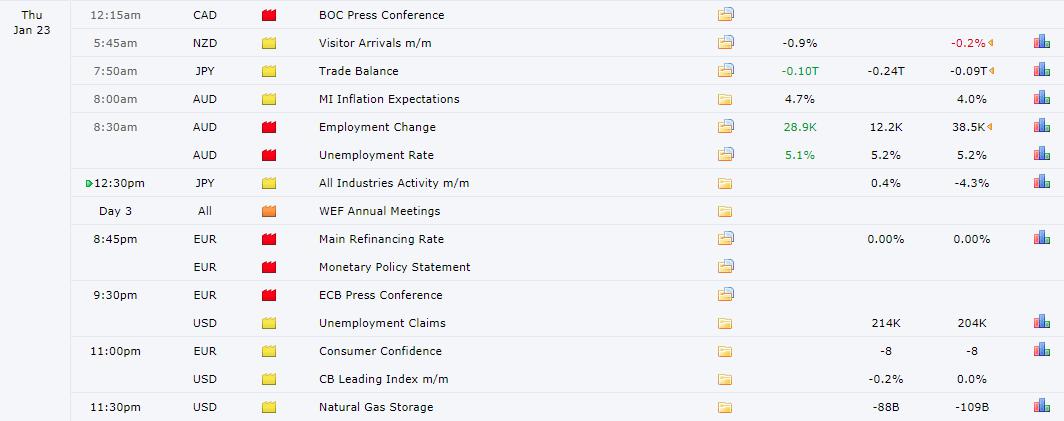
Source: Forexfactory
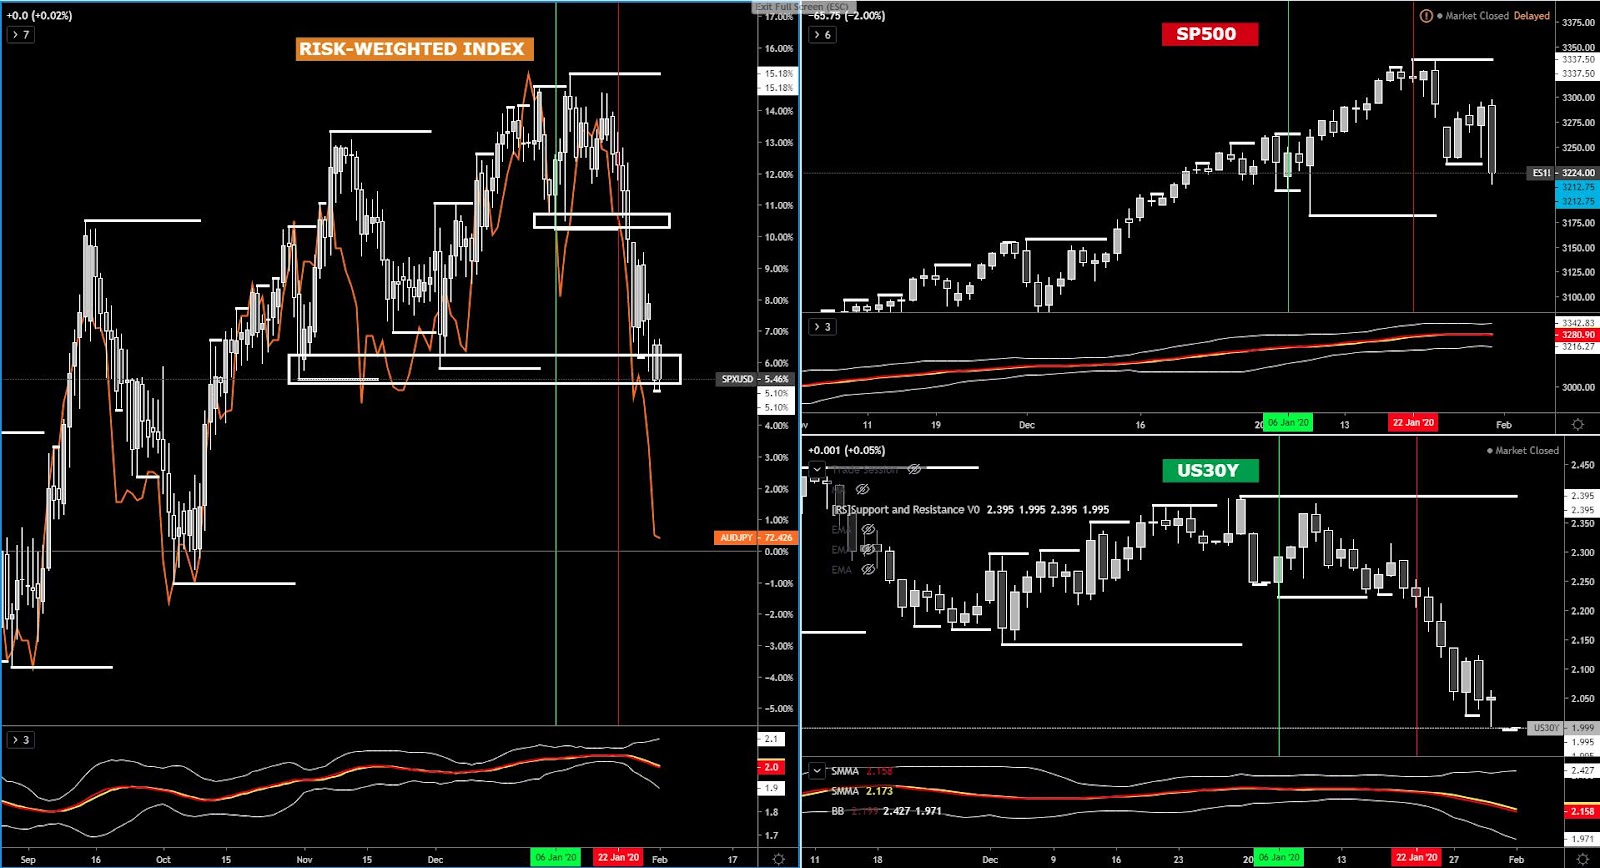
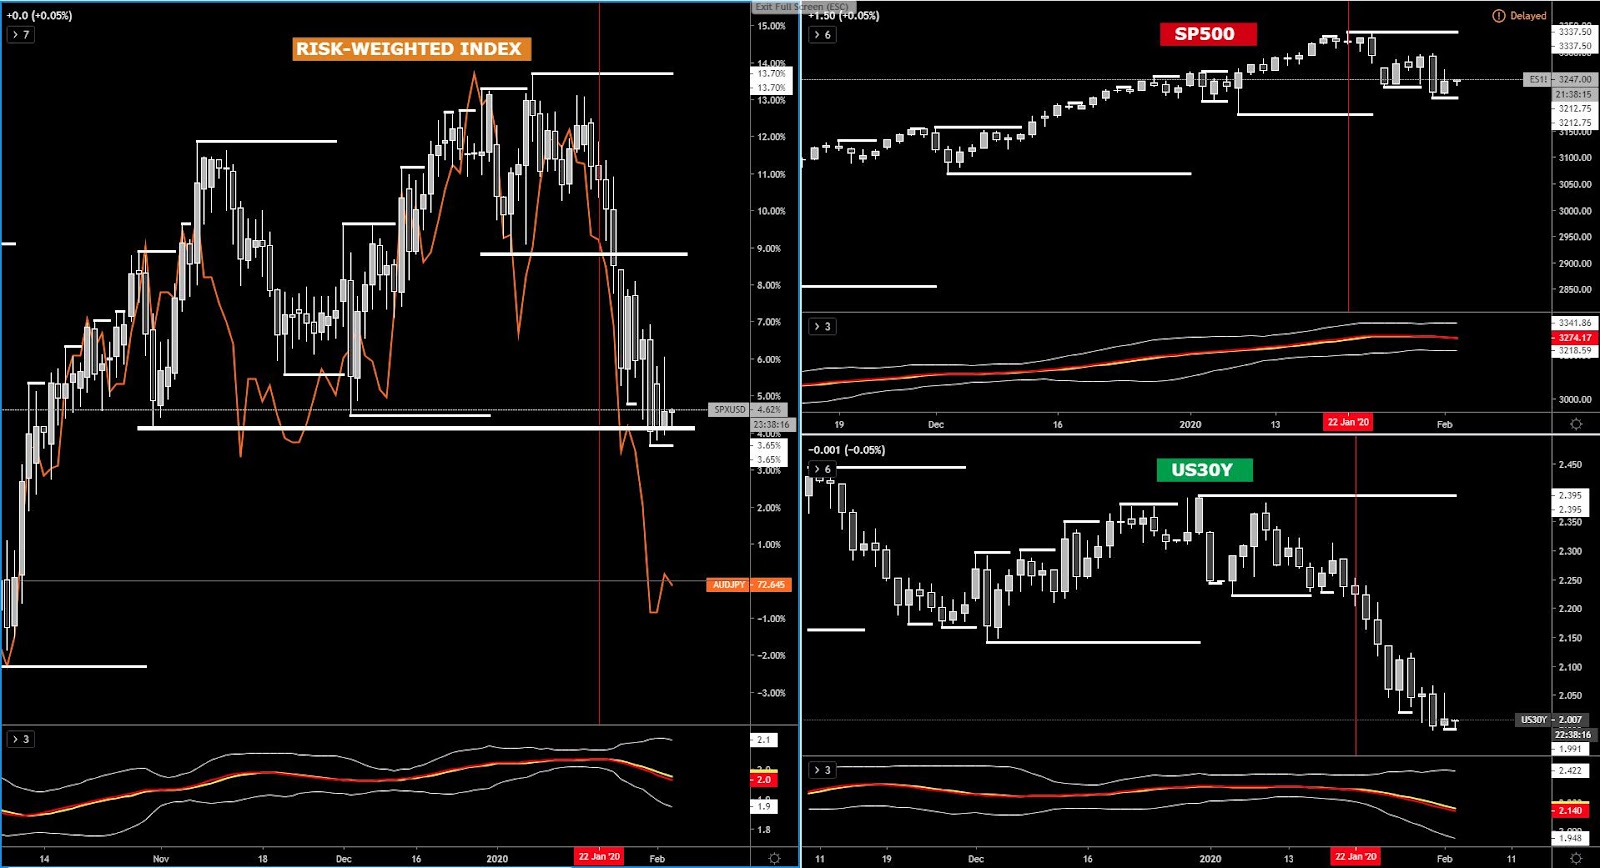
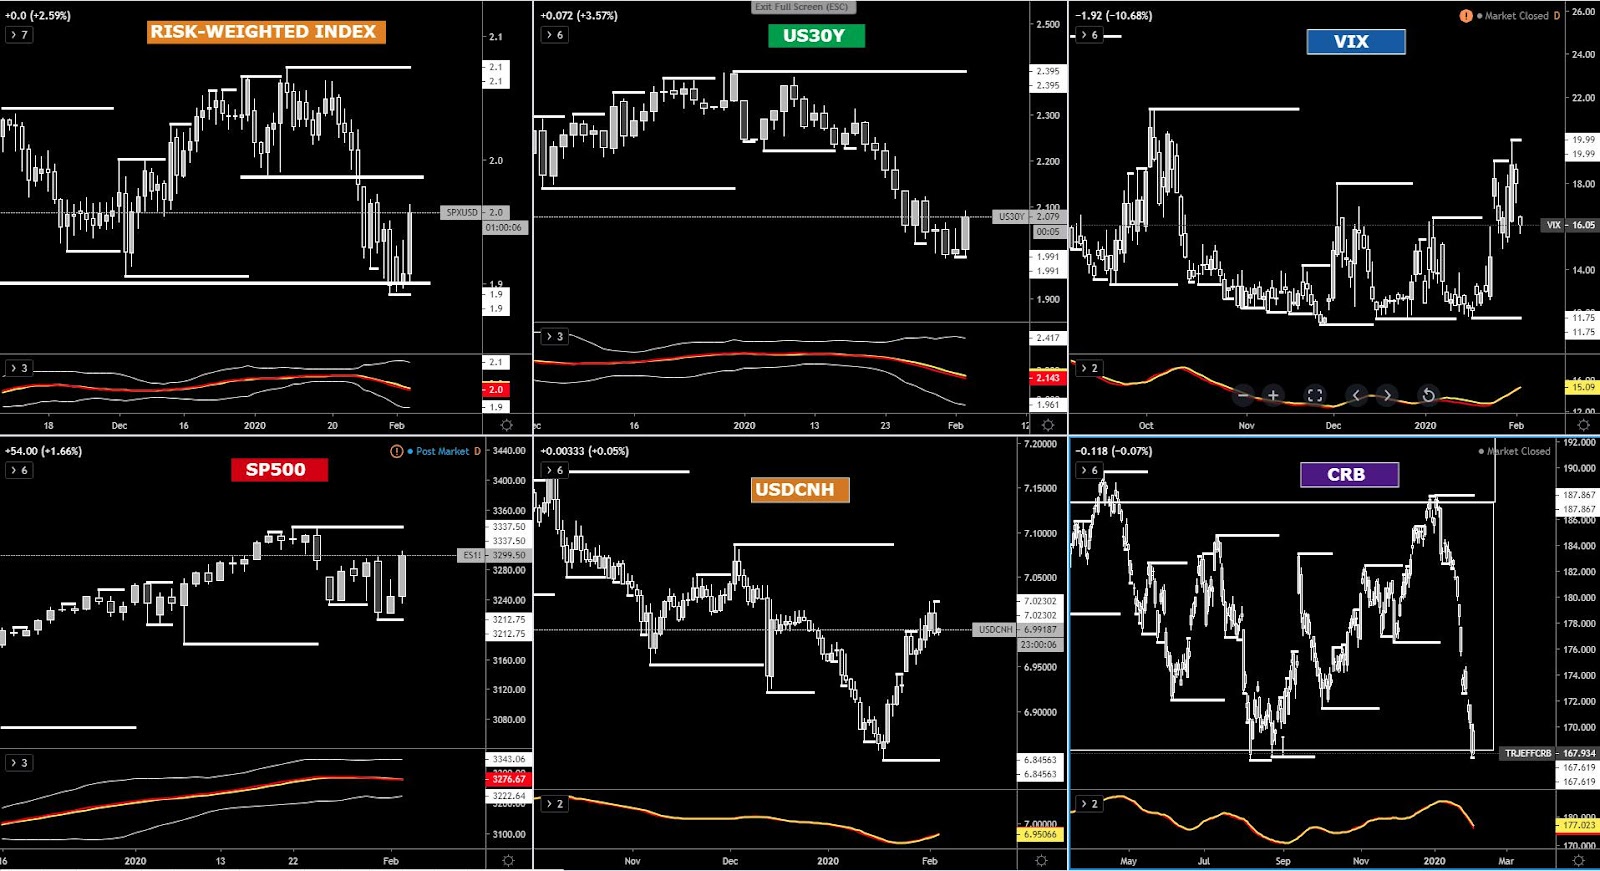
Insights Into FX Index Charts
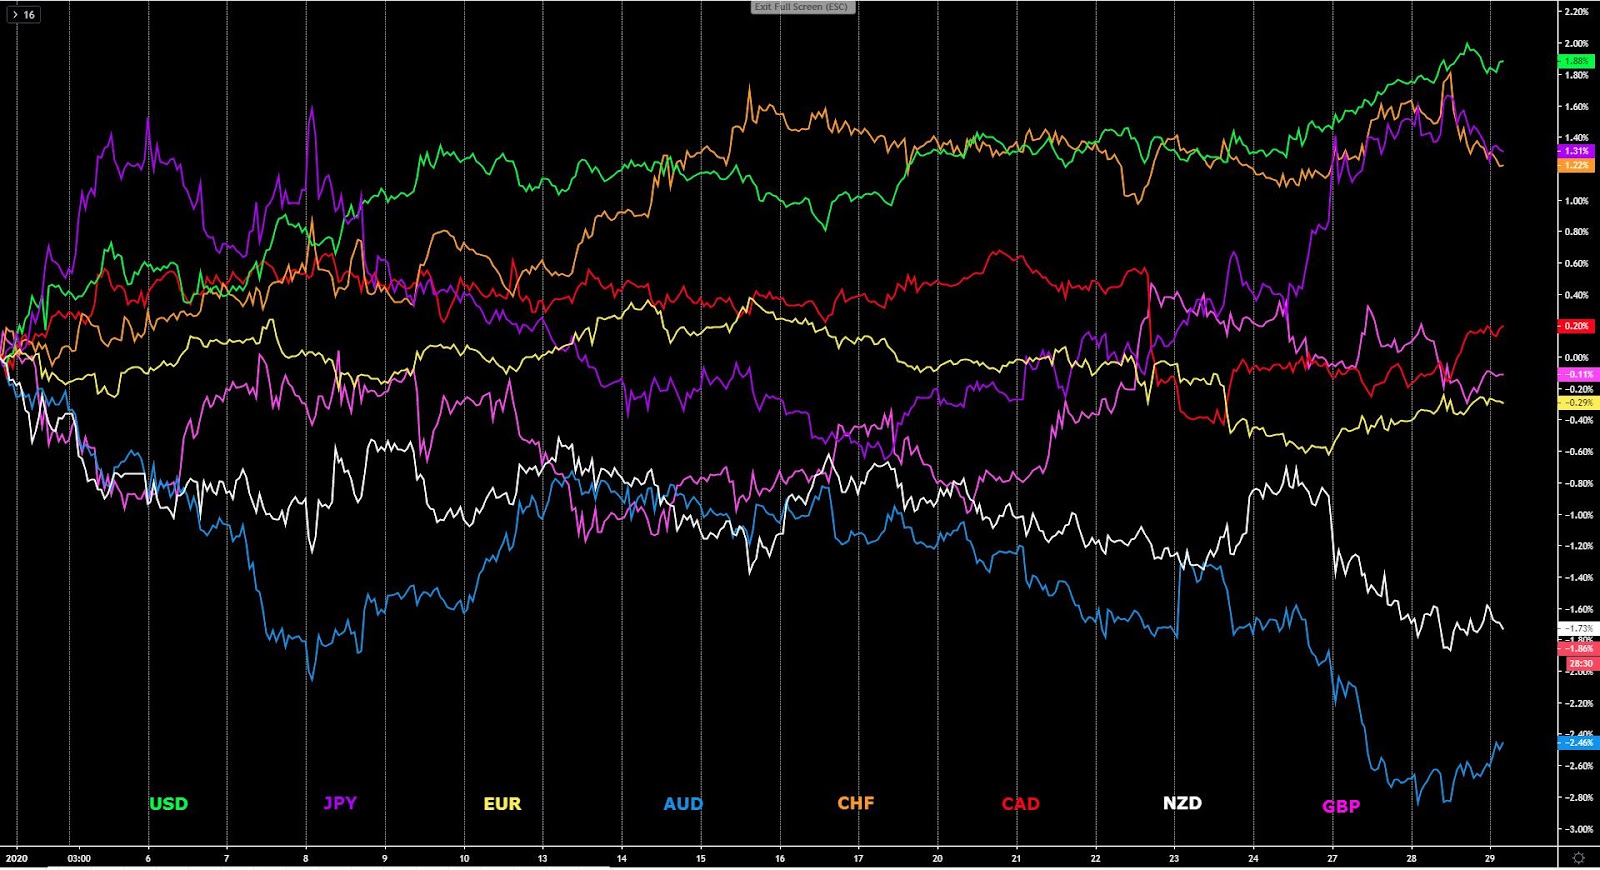
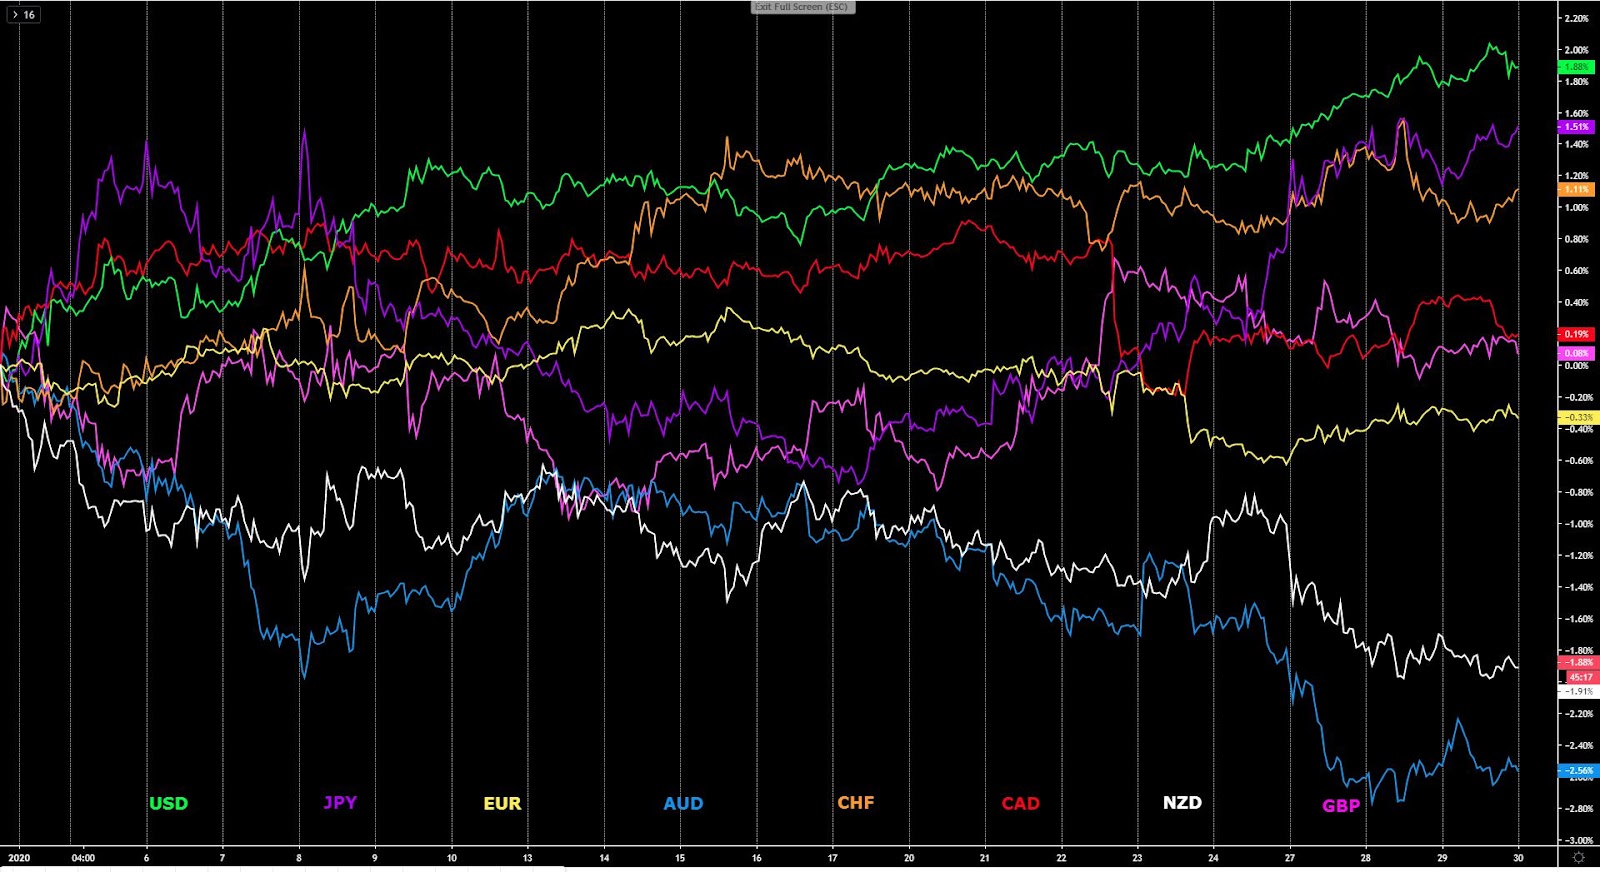
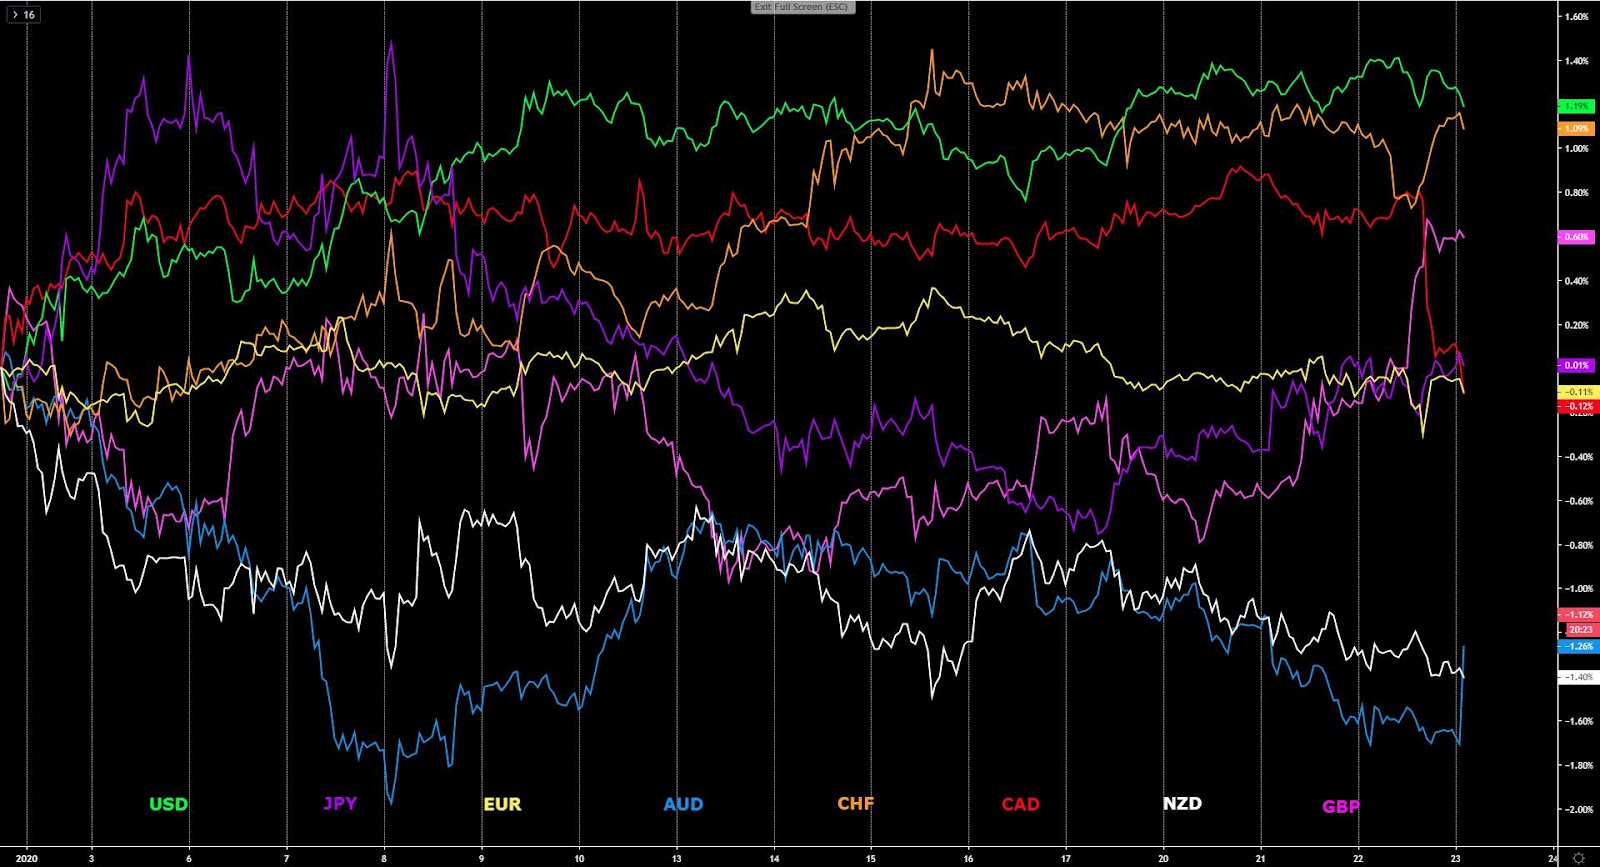
The indices show the performance of a particular currency vs G8 FX. An educational video on how to interpret these indices can be found in the Global Prime's Research section. The idea of this analysis is to complement one’s daily bias by accounting for this holistic analysis.
If you found the content in this section valuable, give us a share by just clicking here!
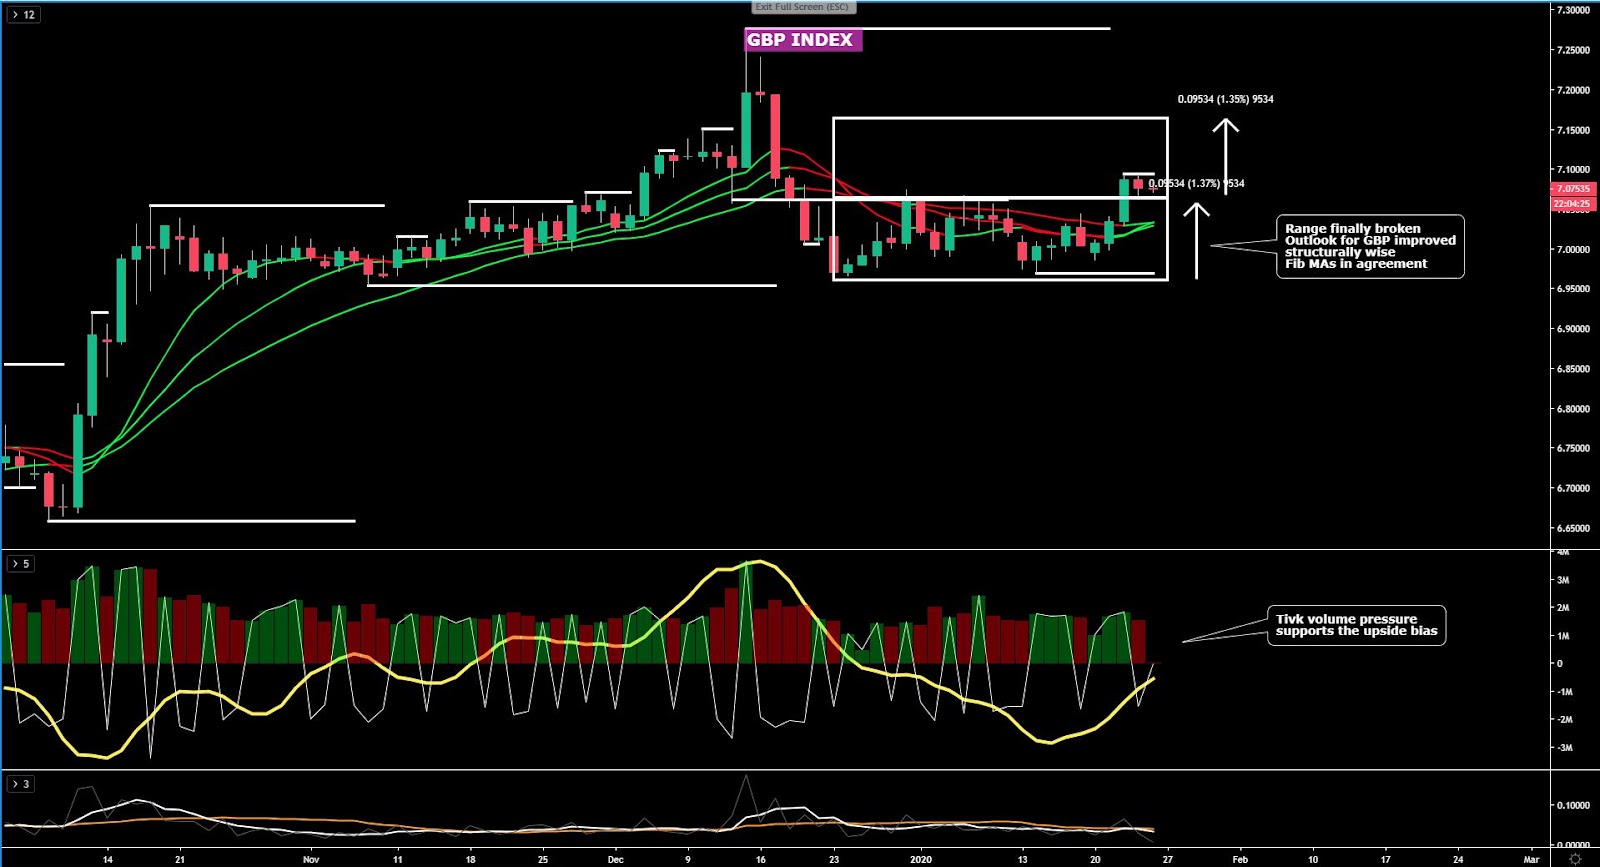
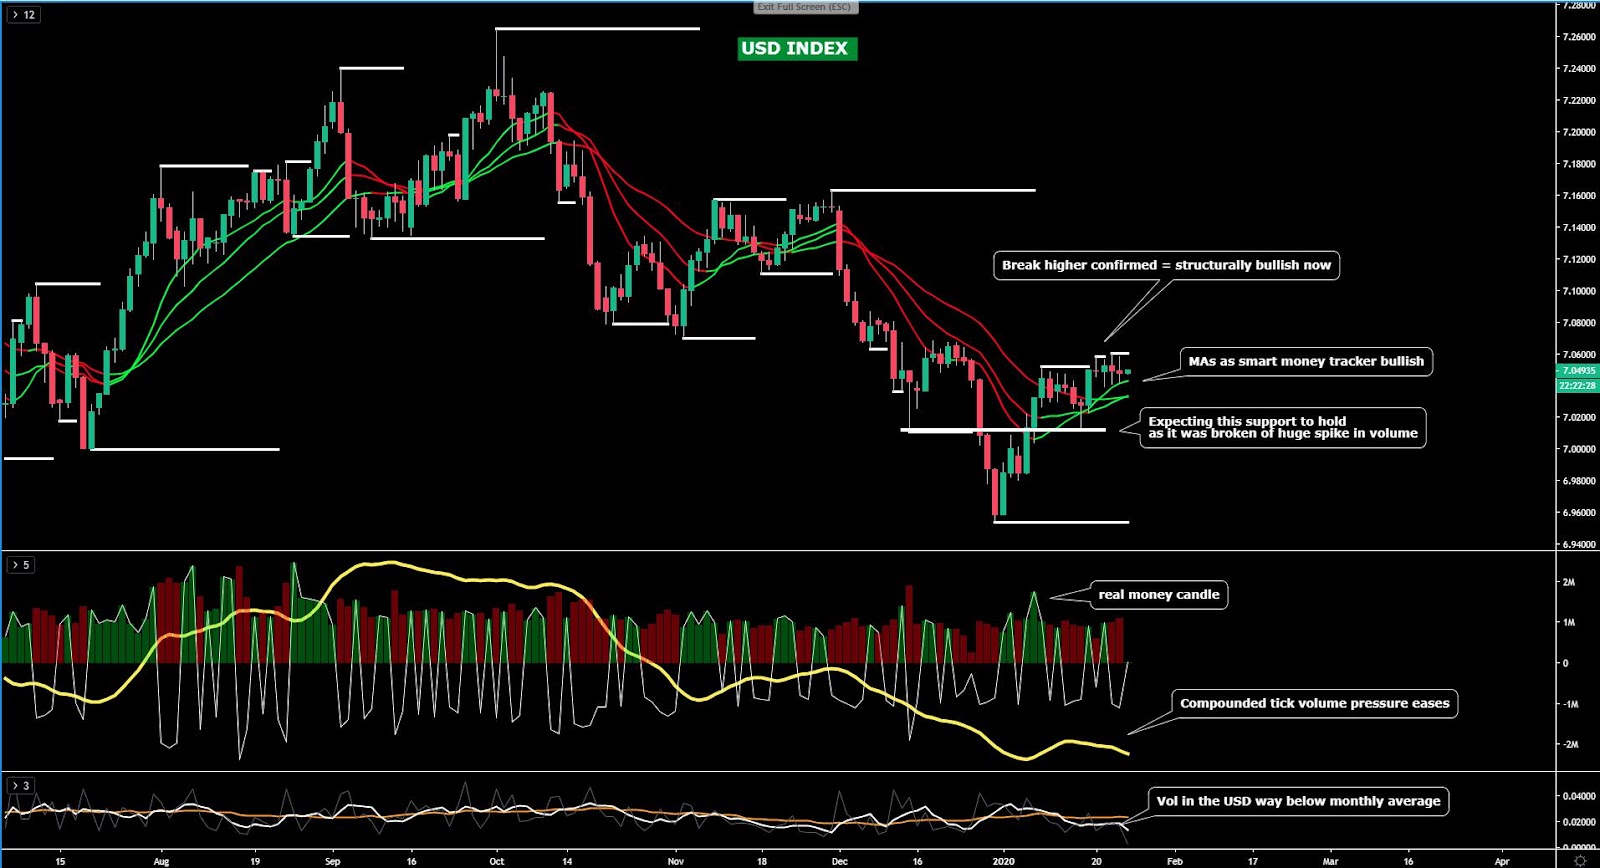
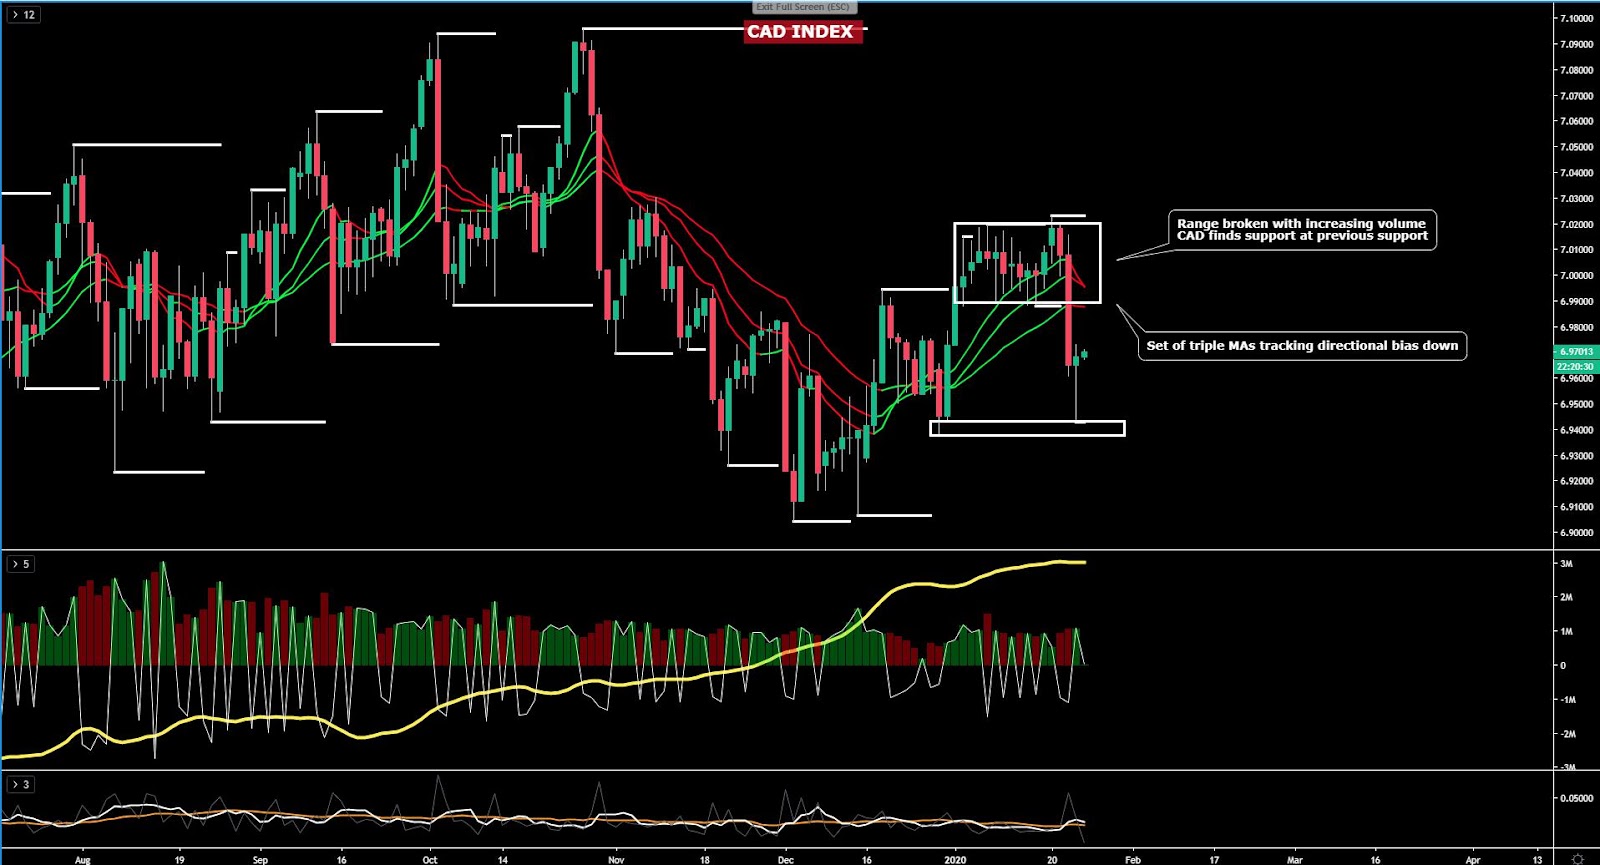
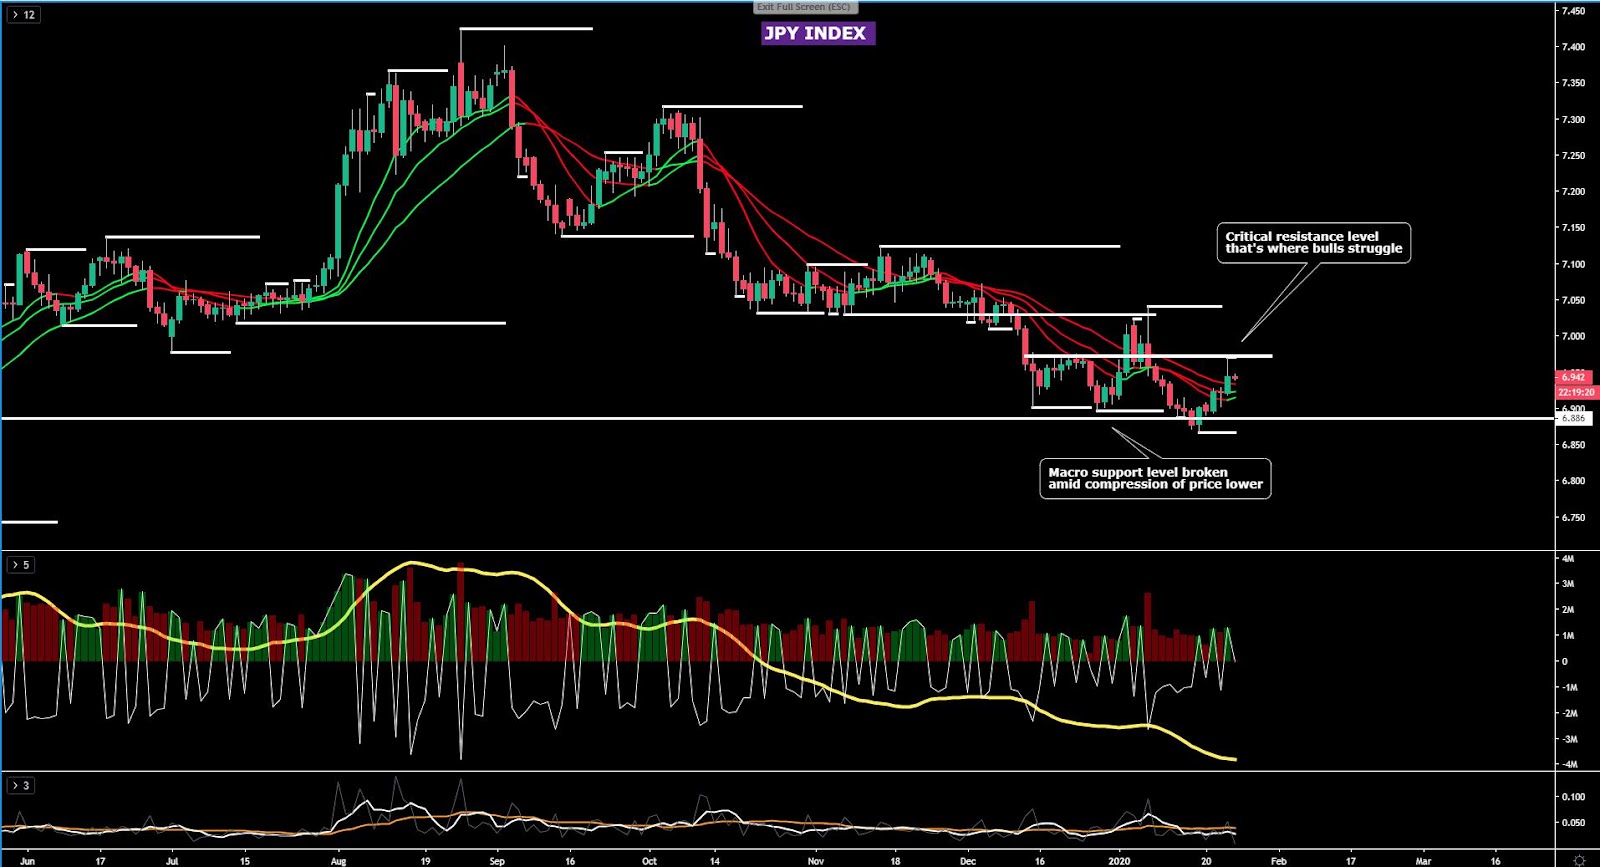
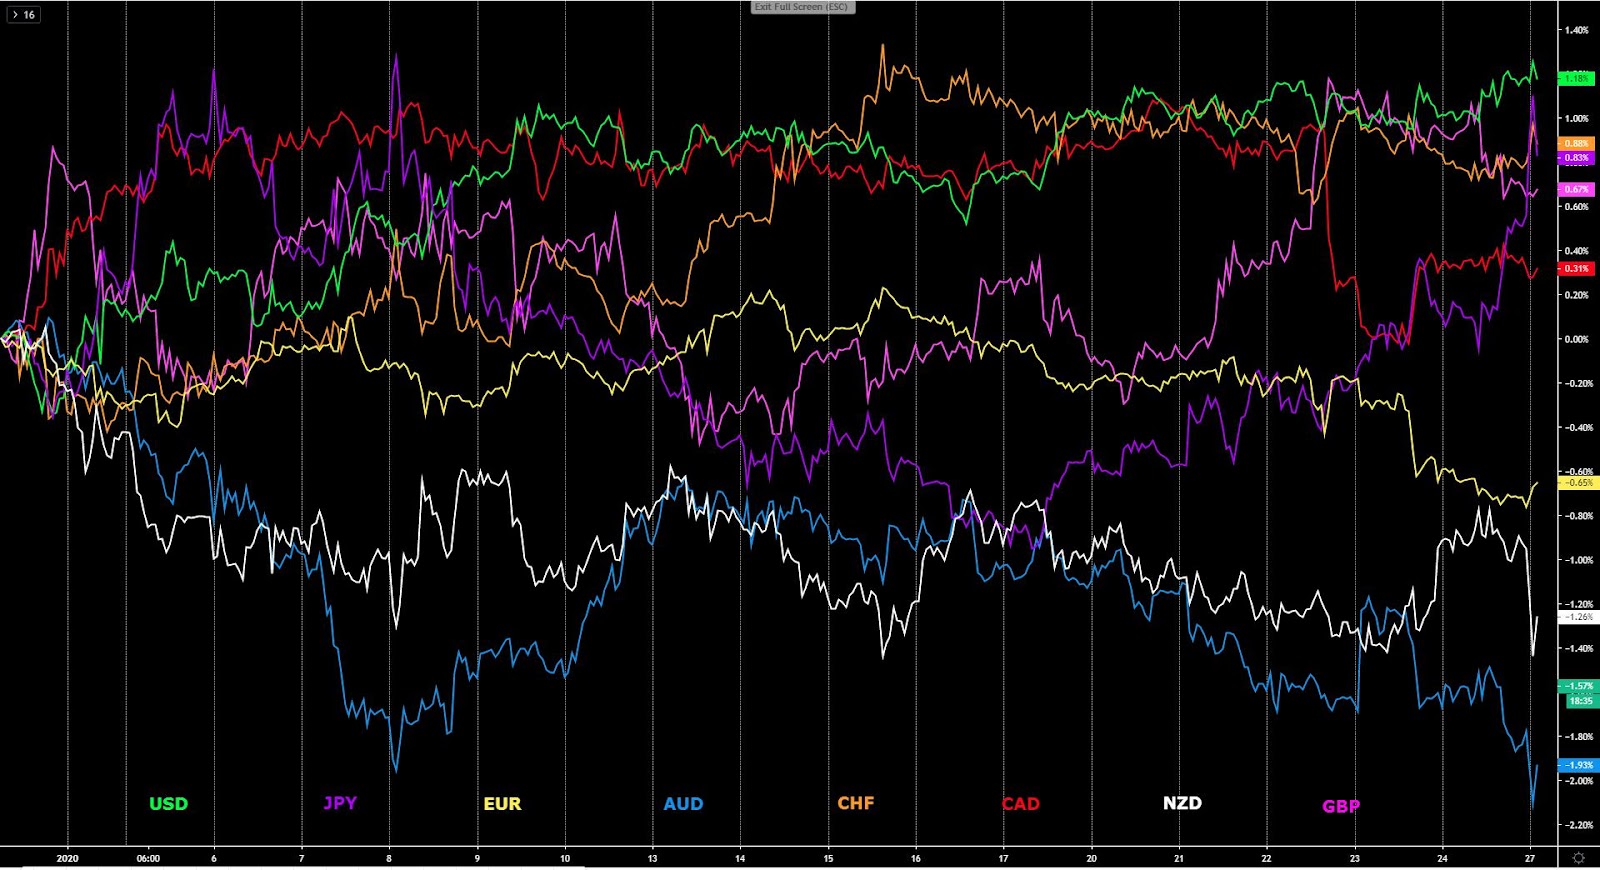
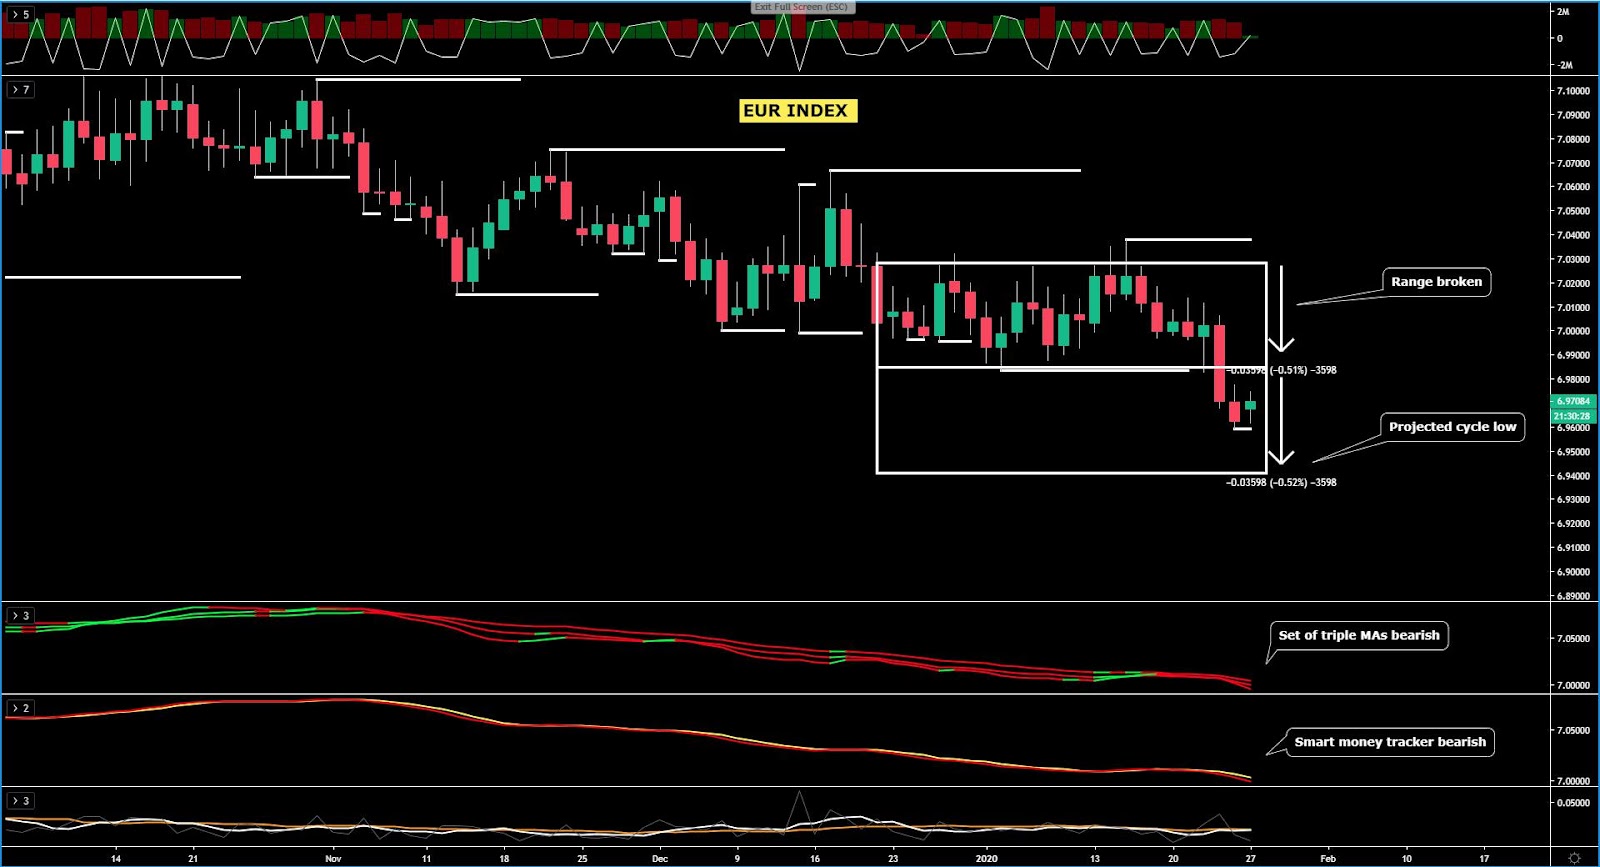
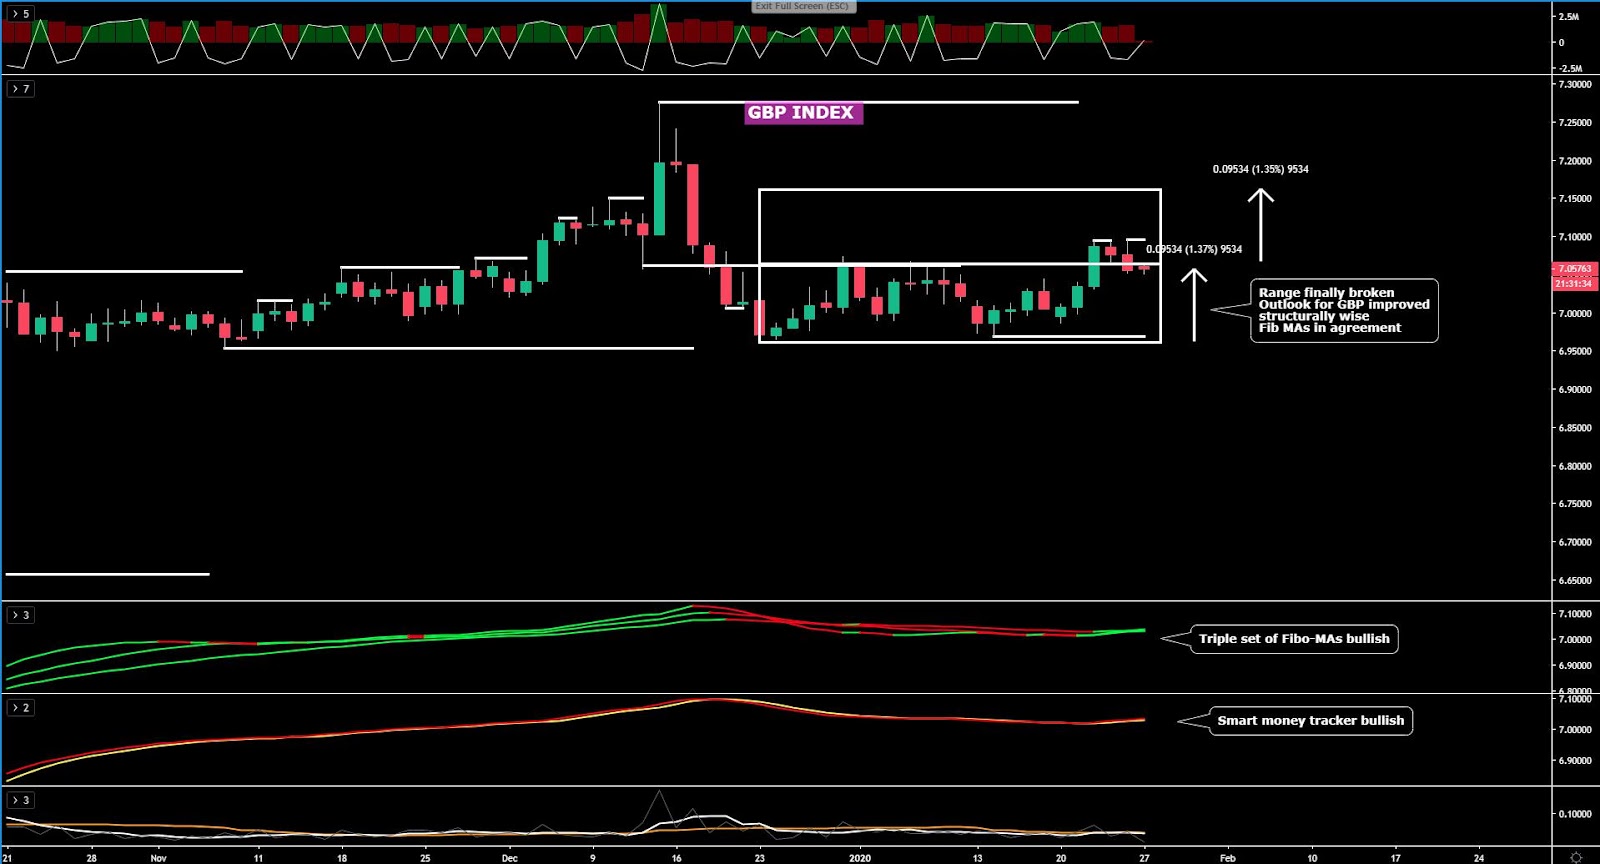
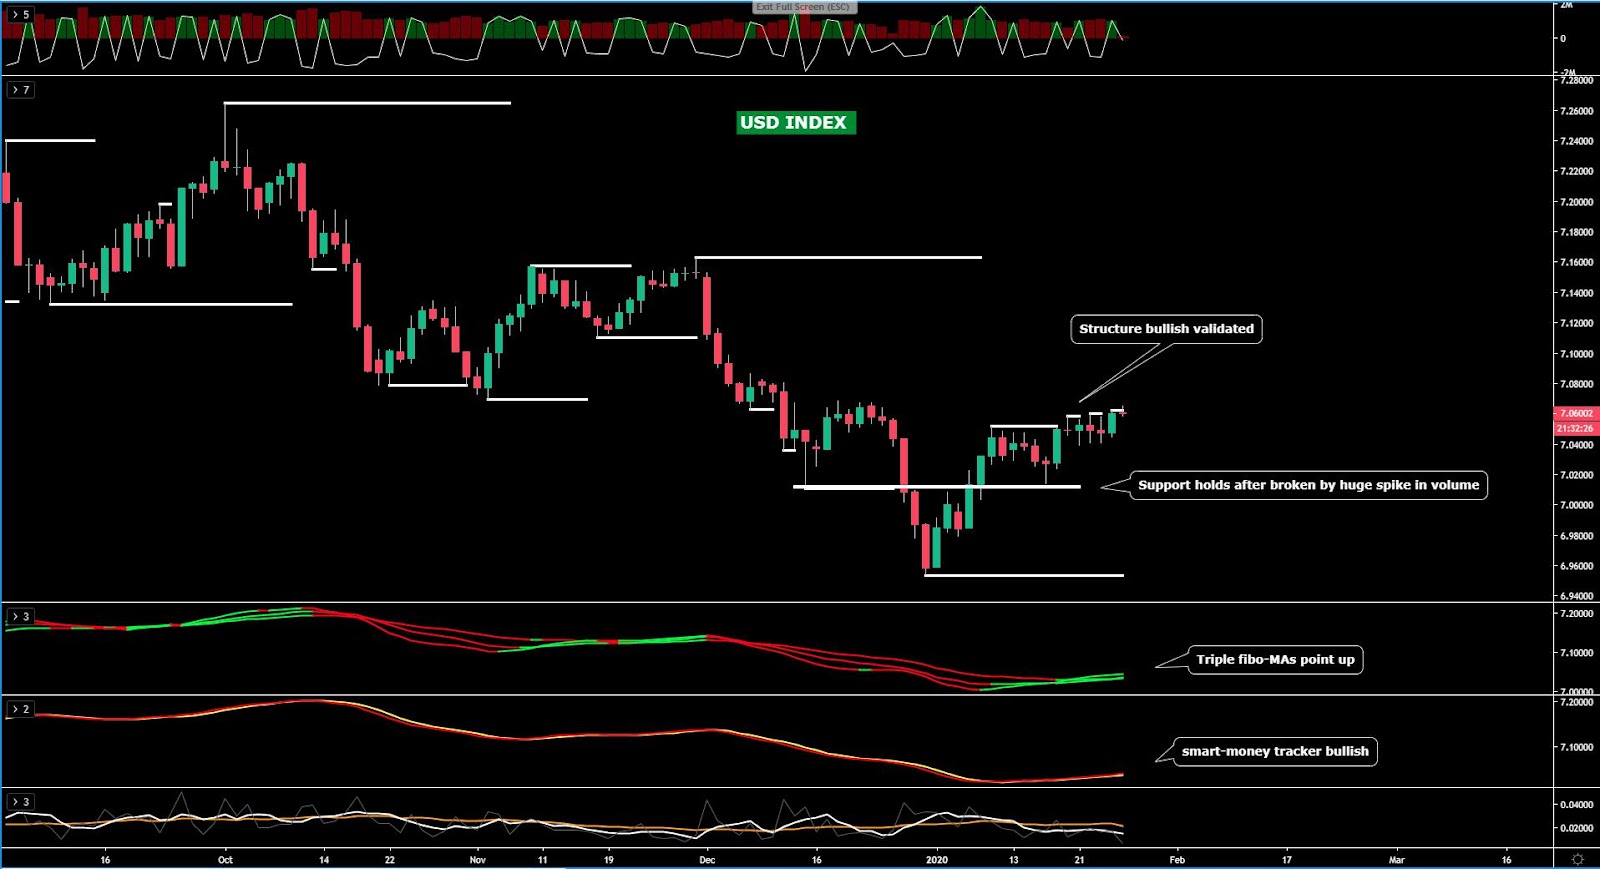
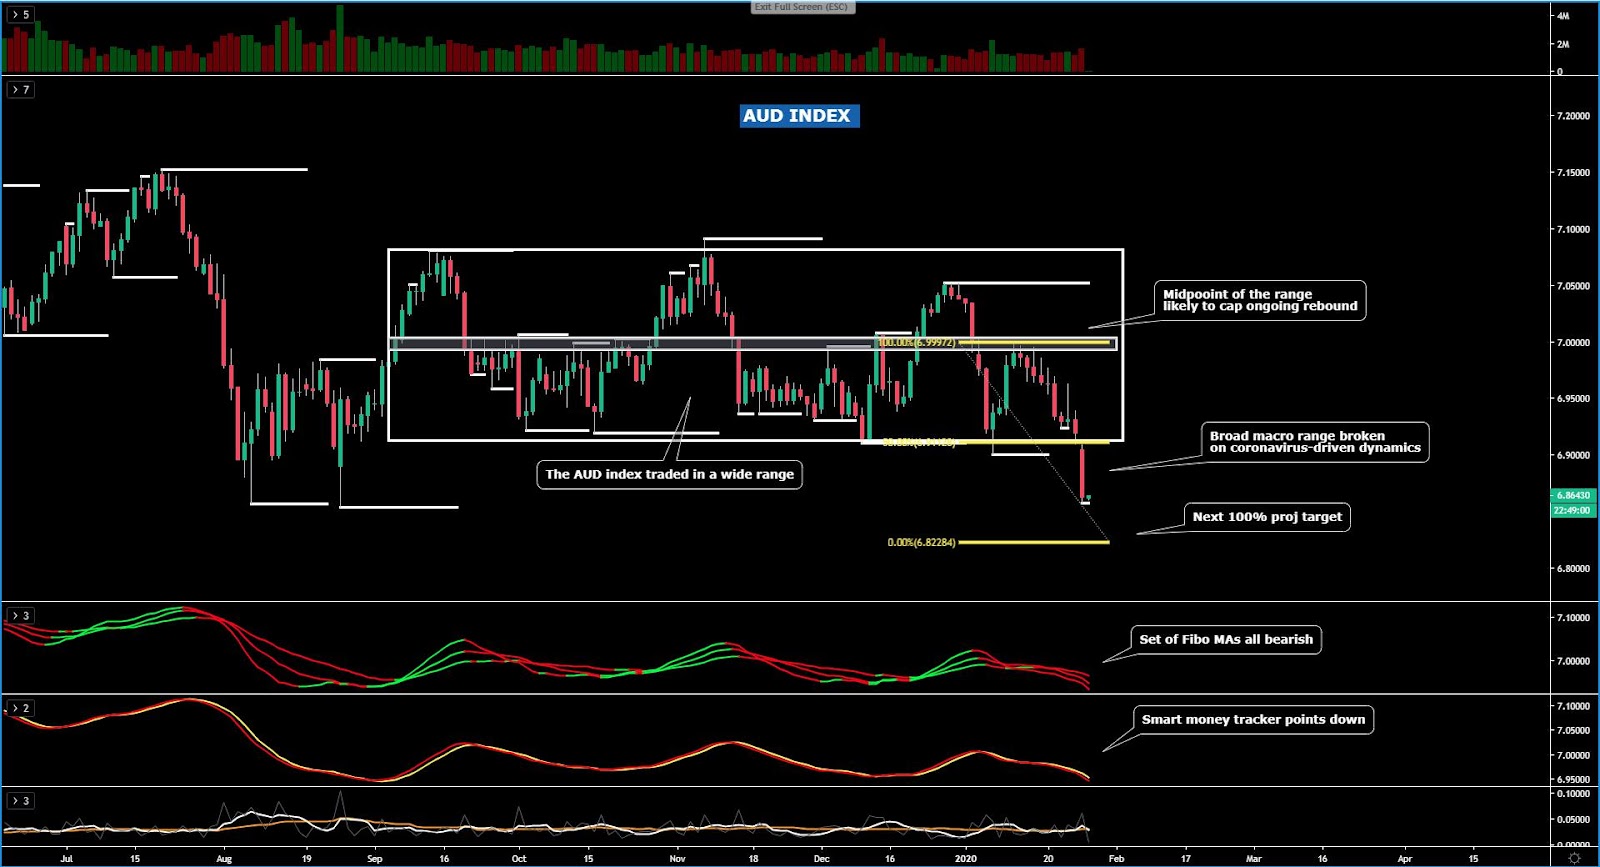
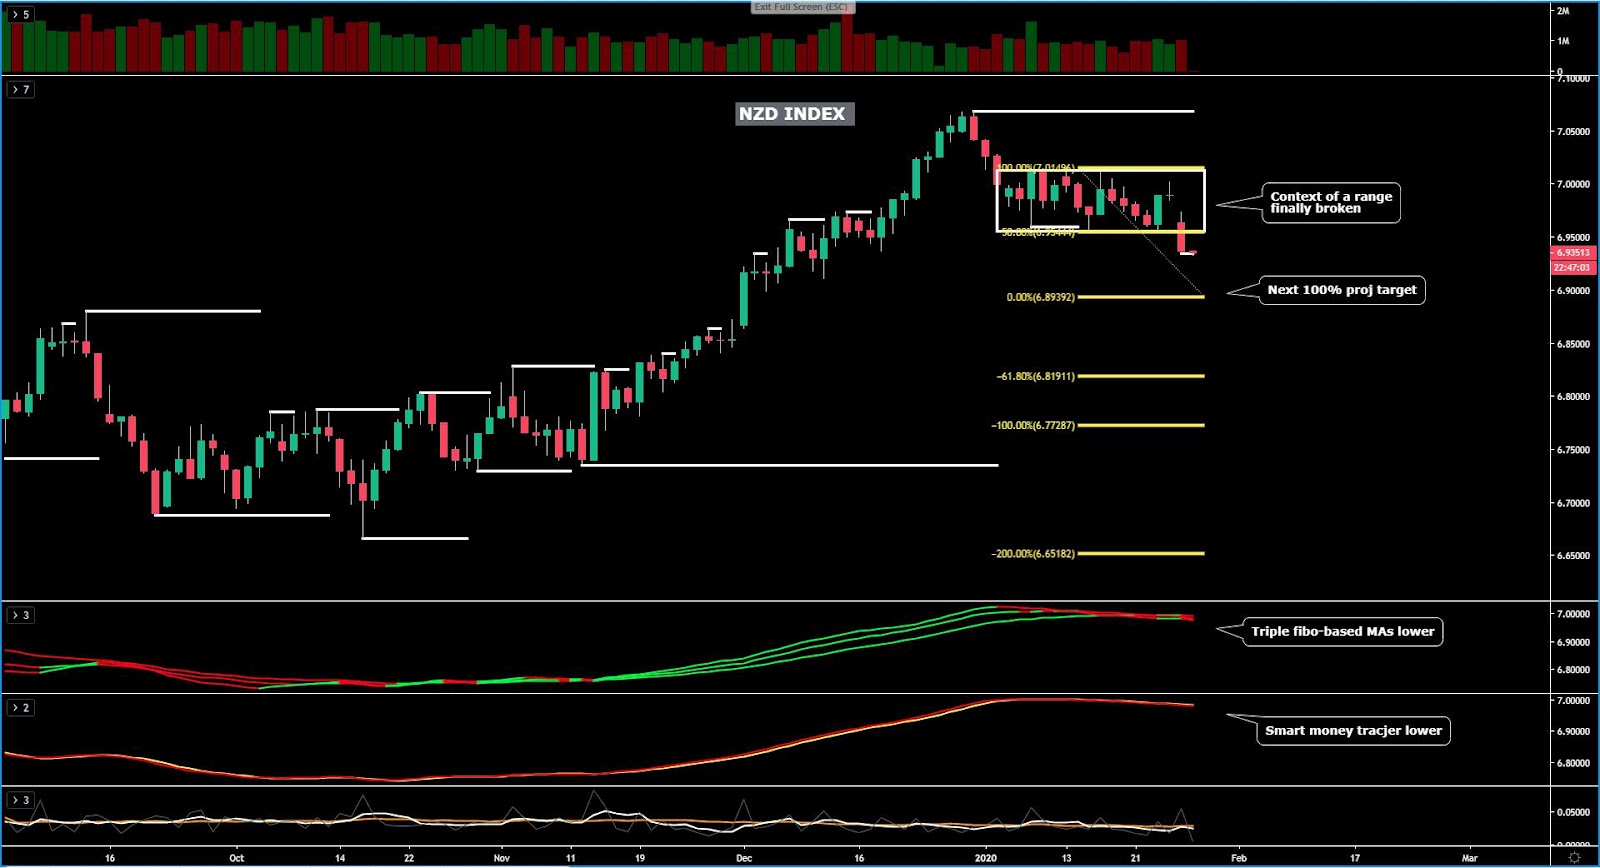
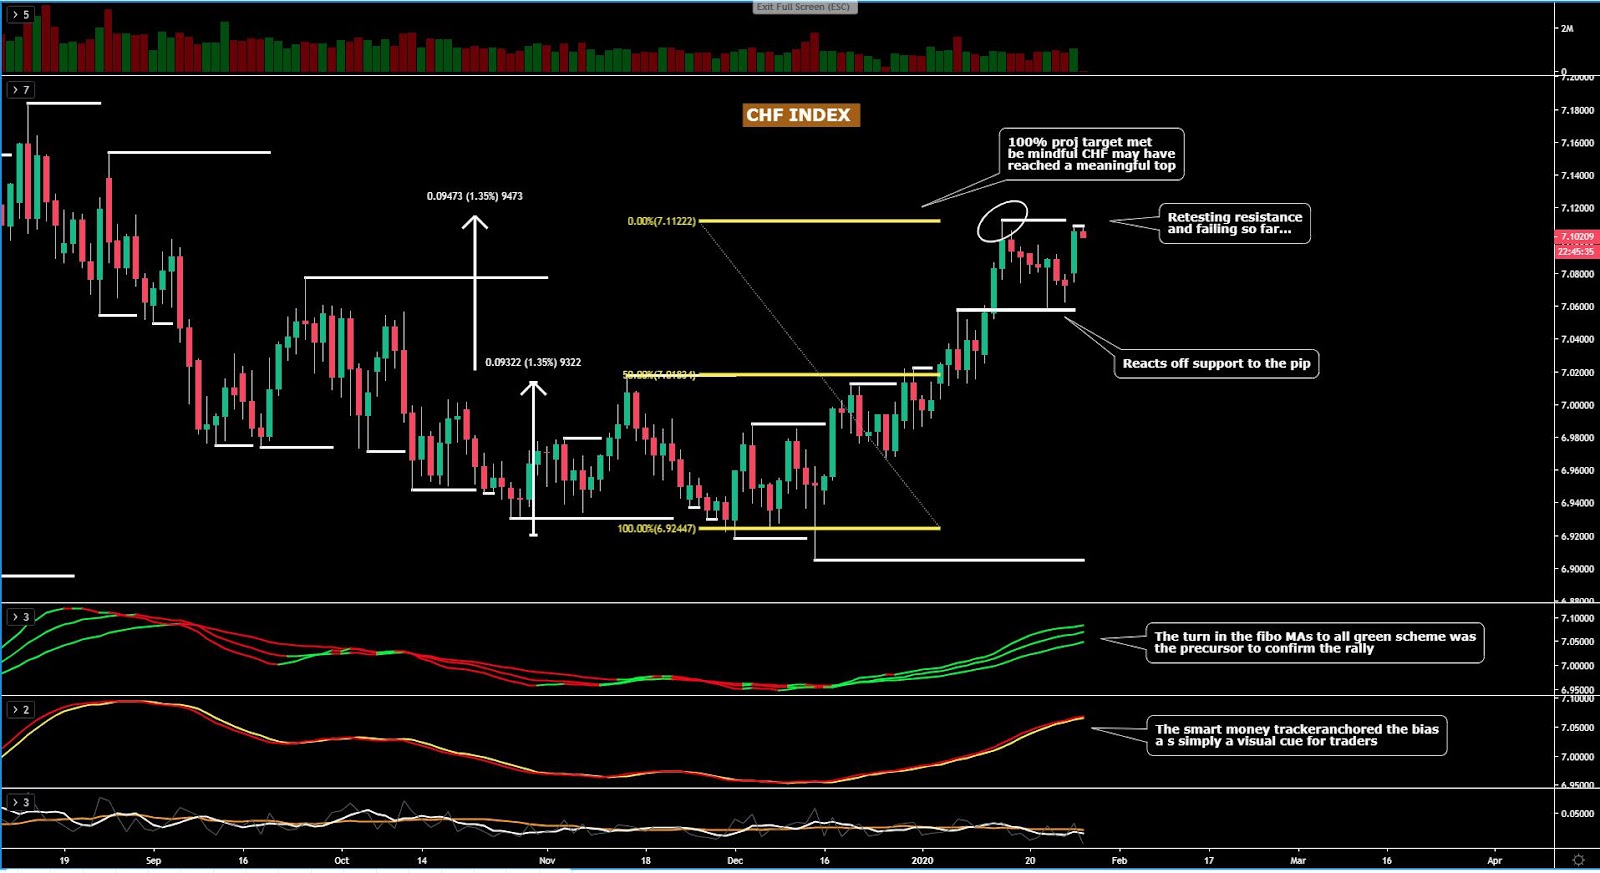
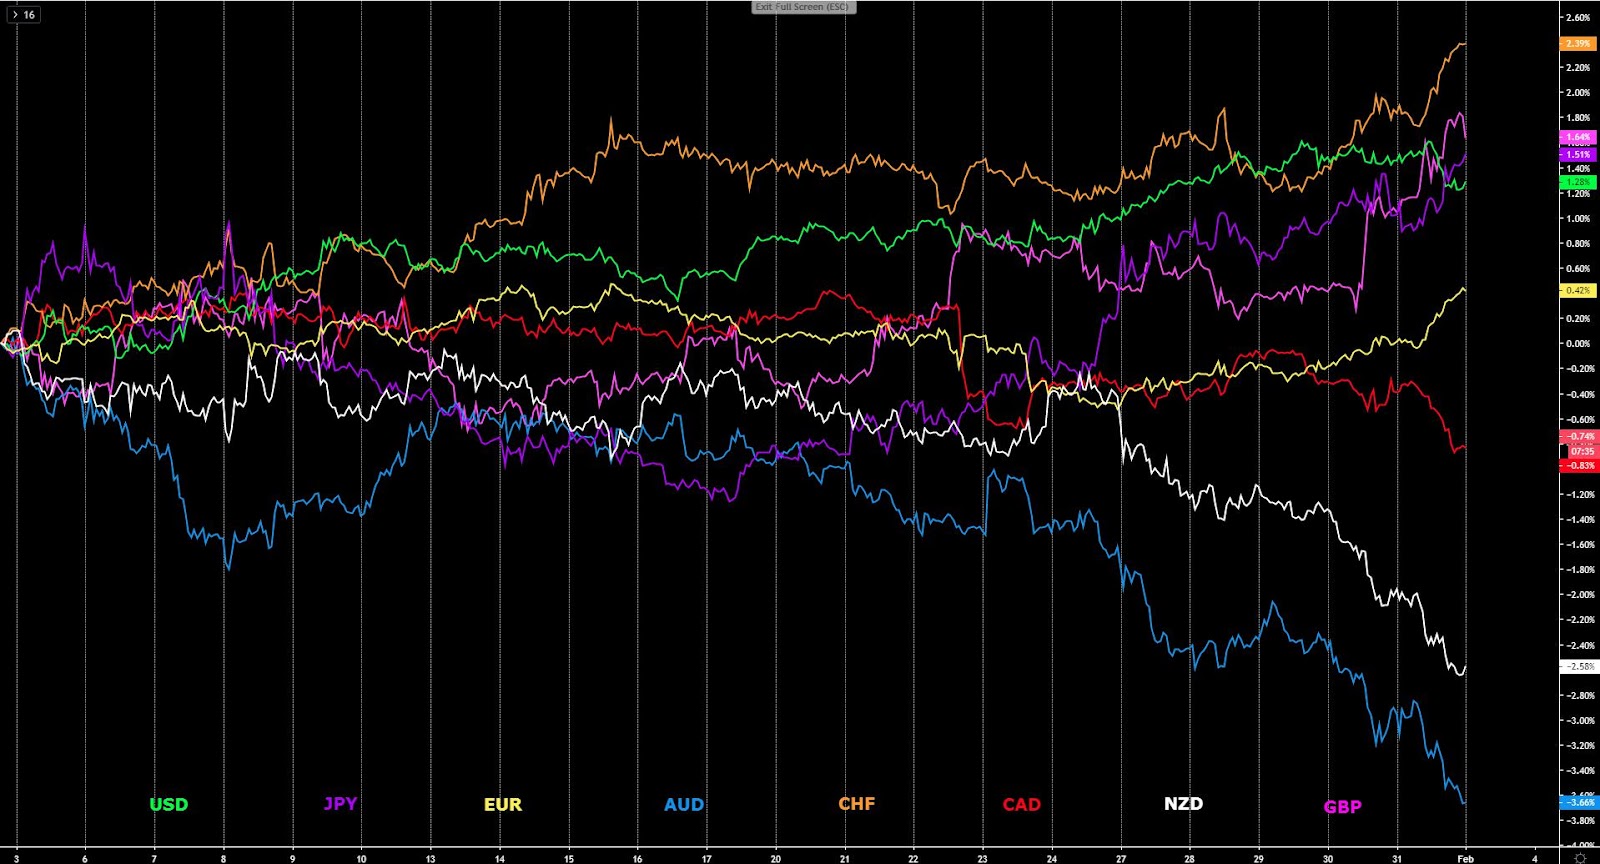
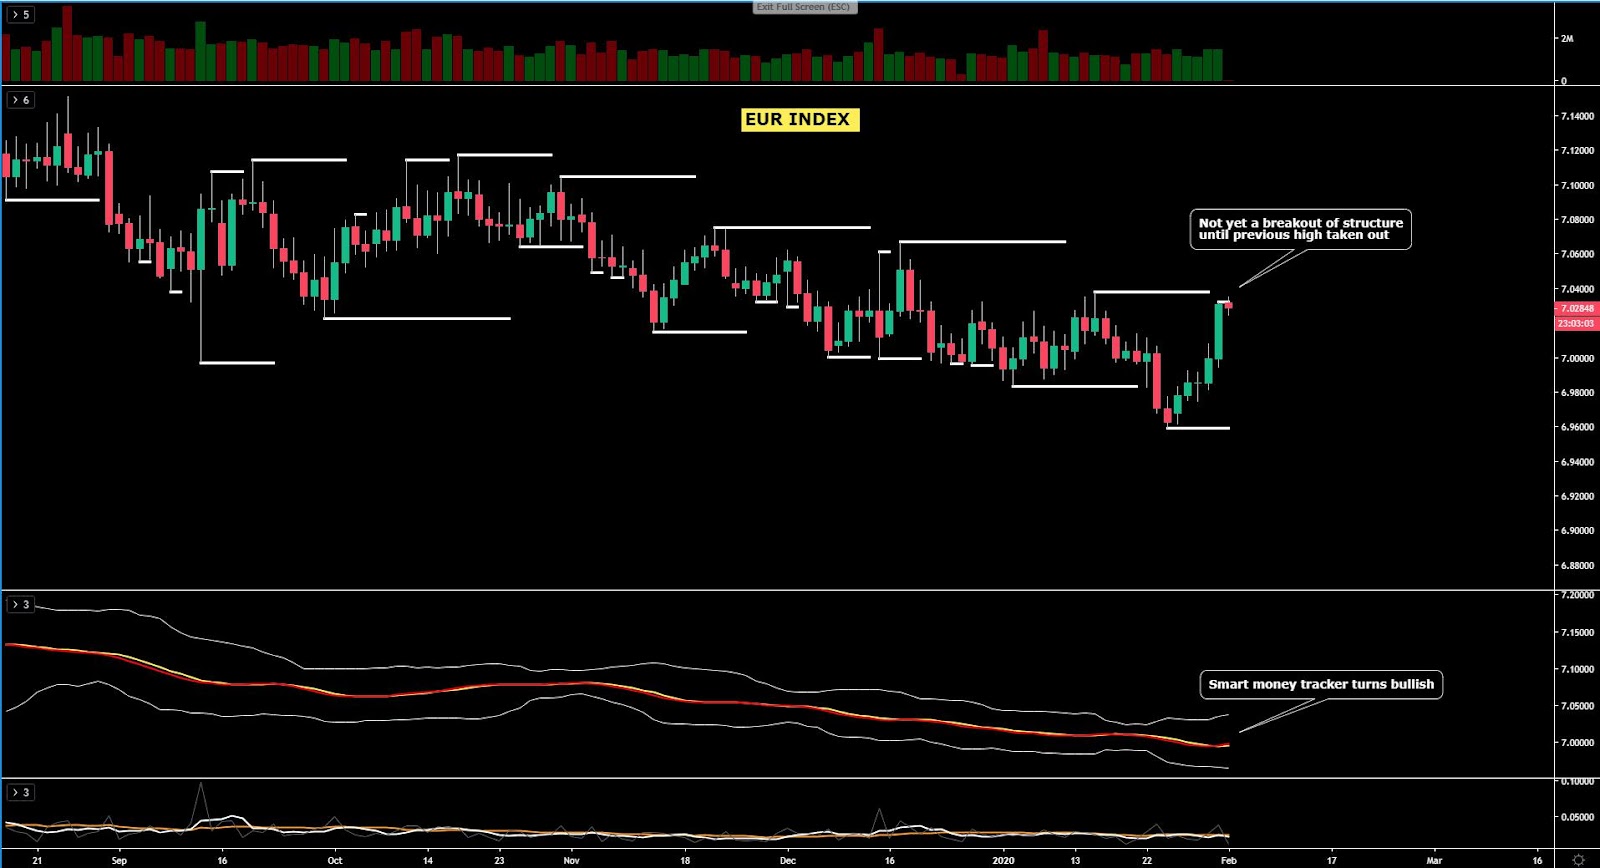
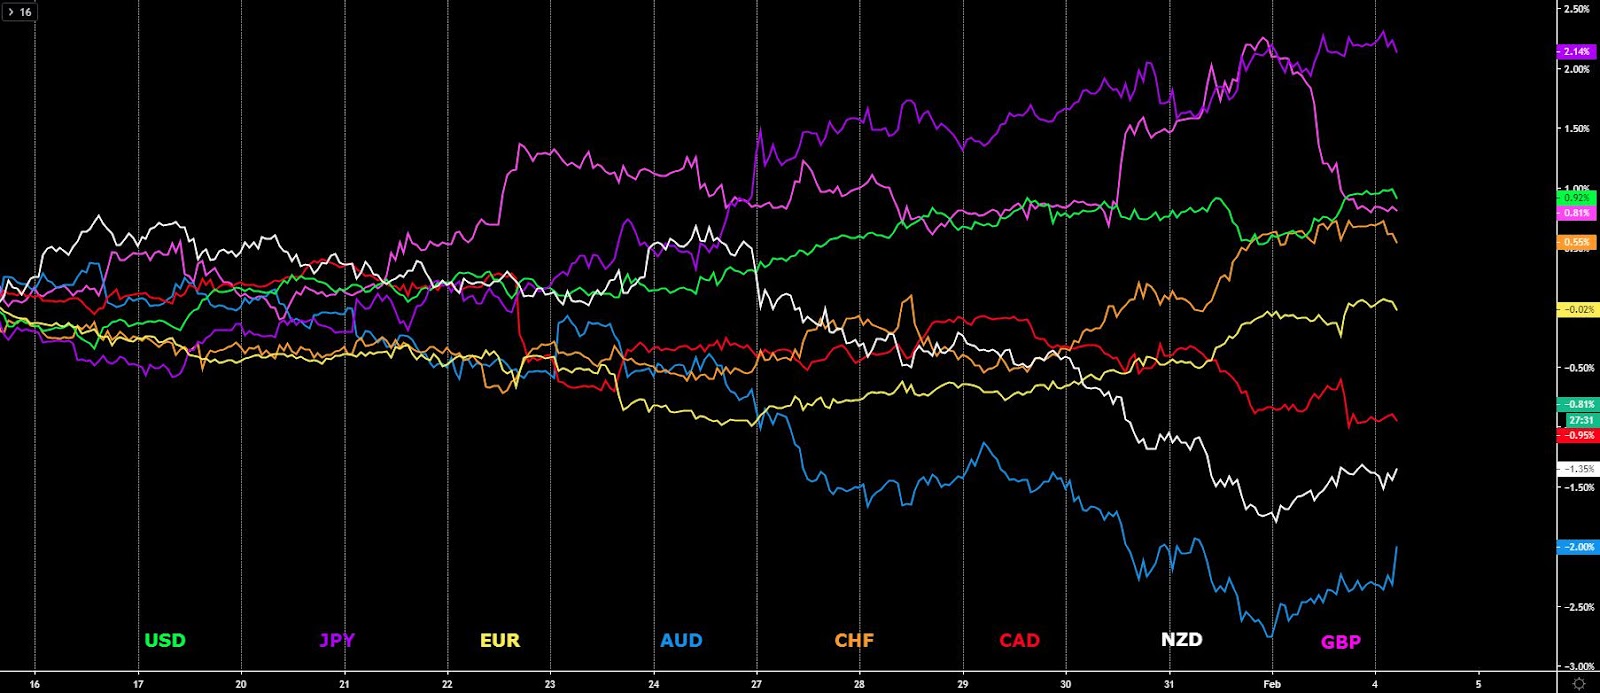
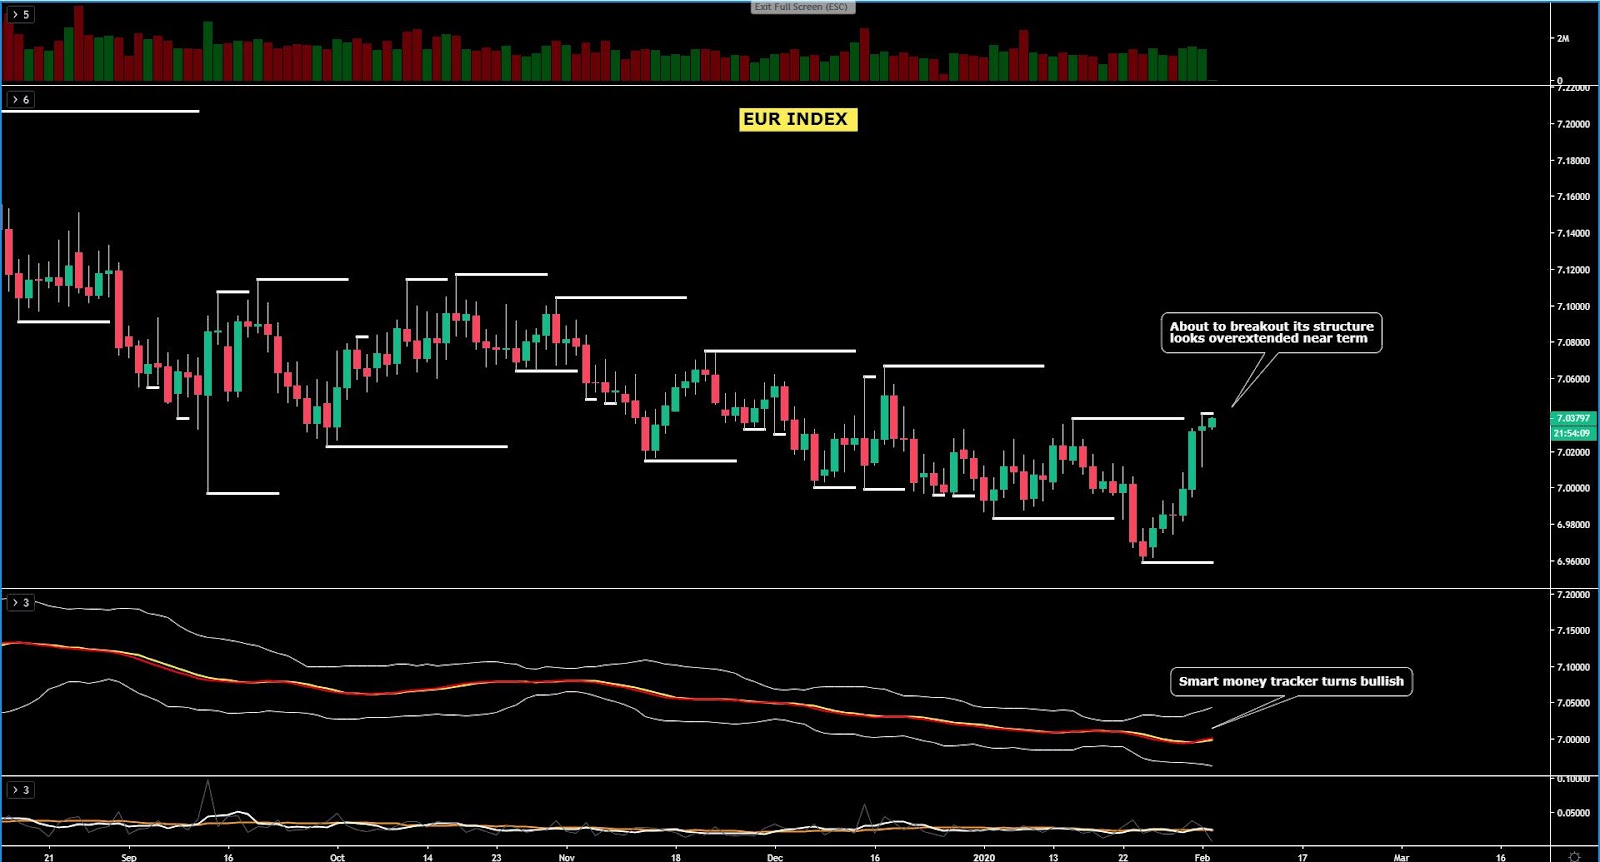
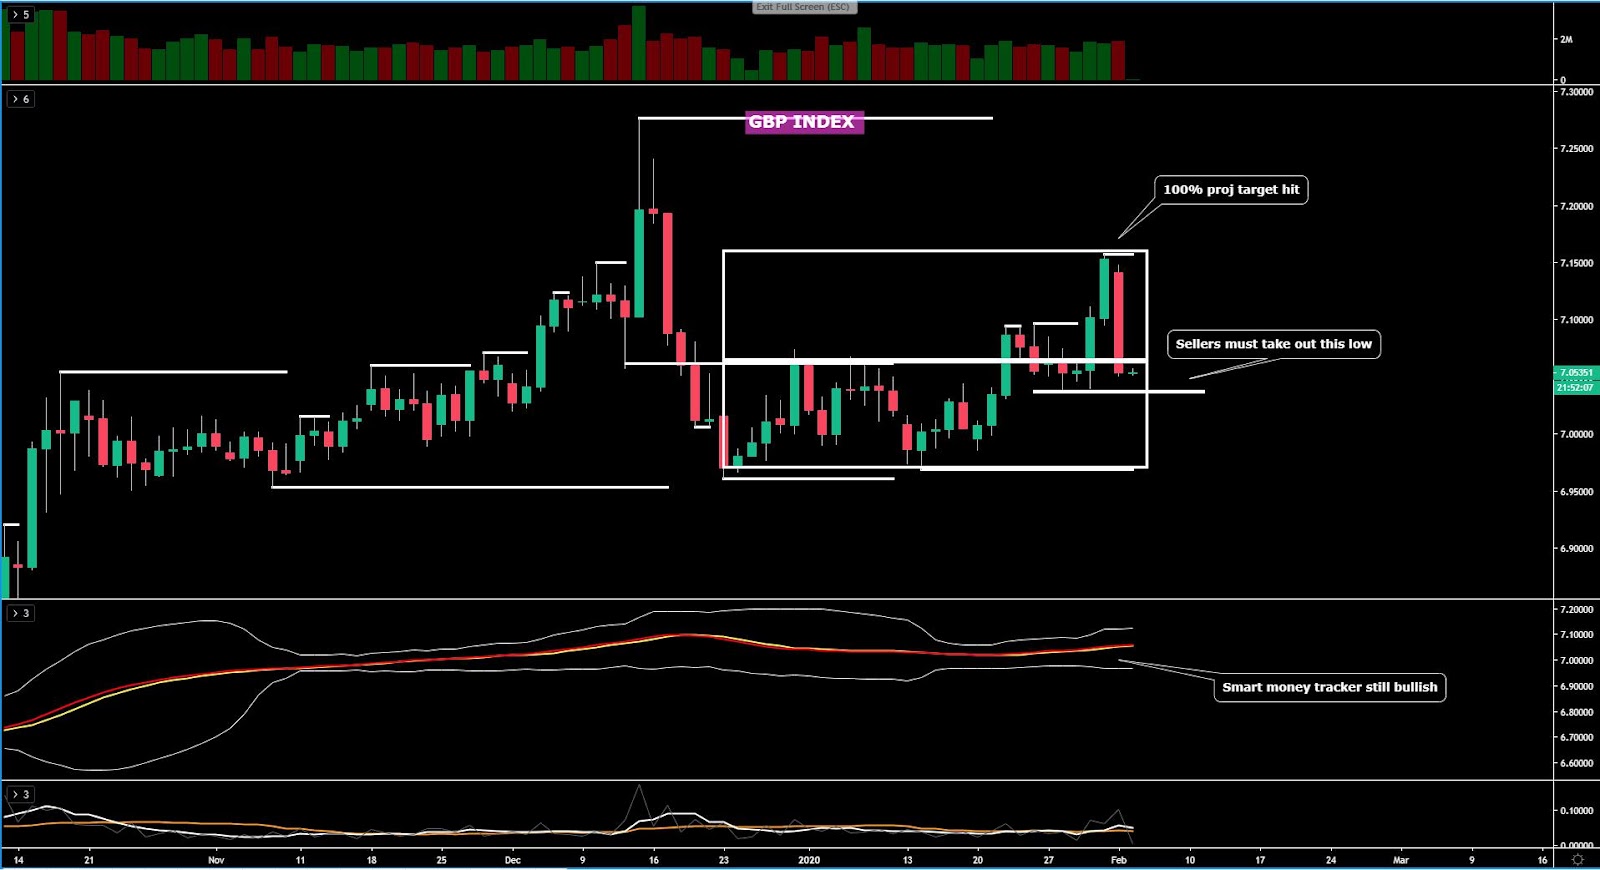
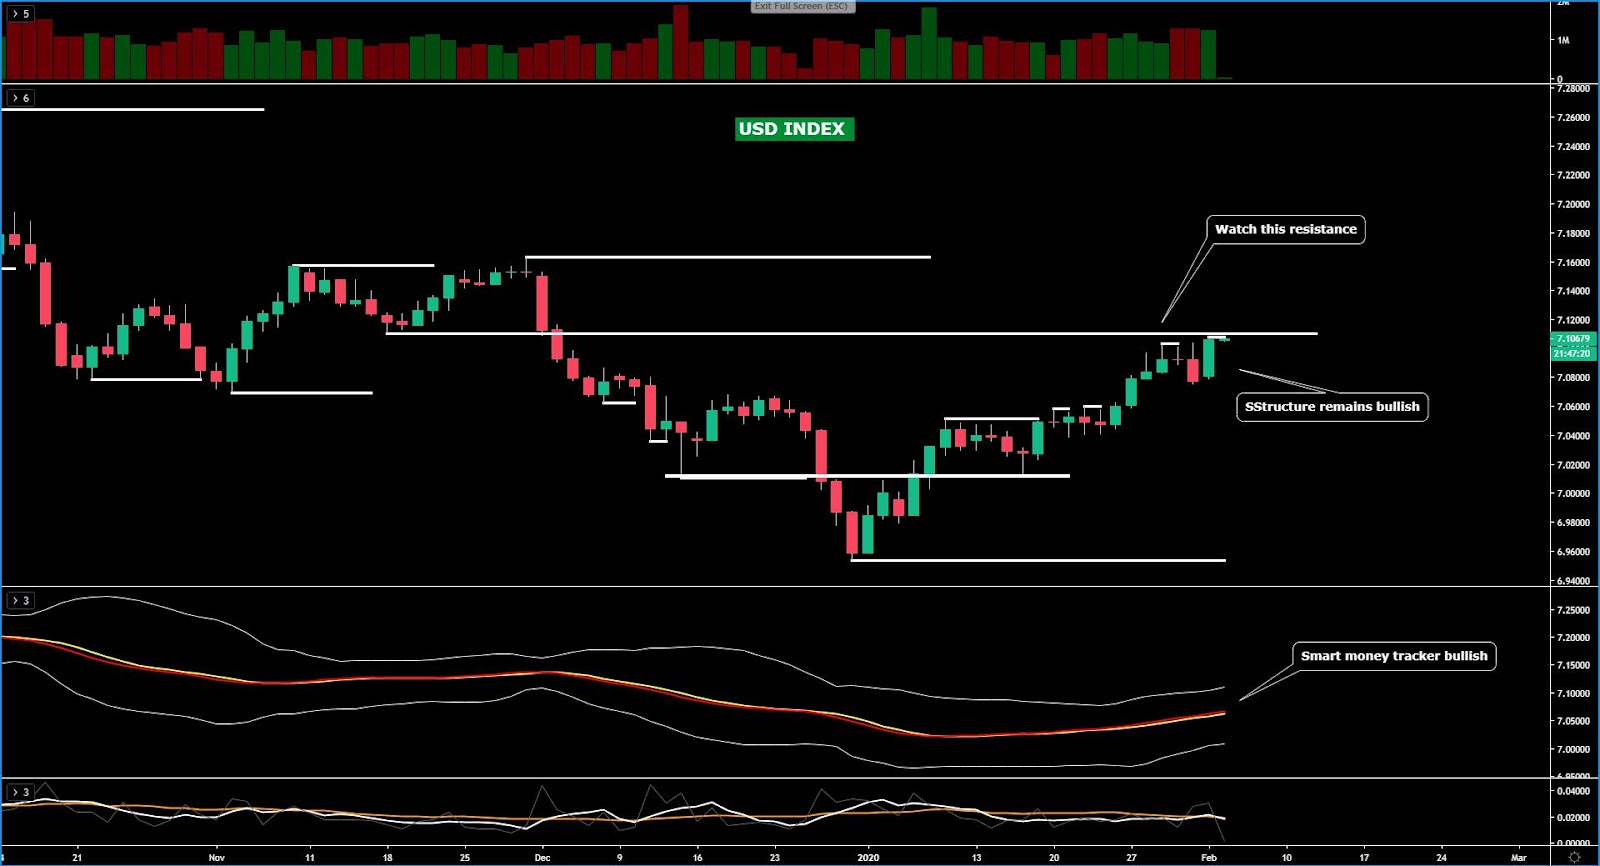
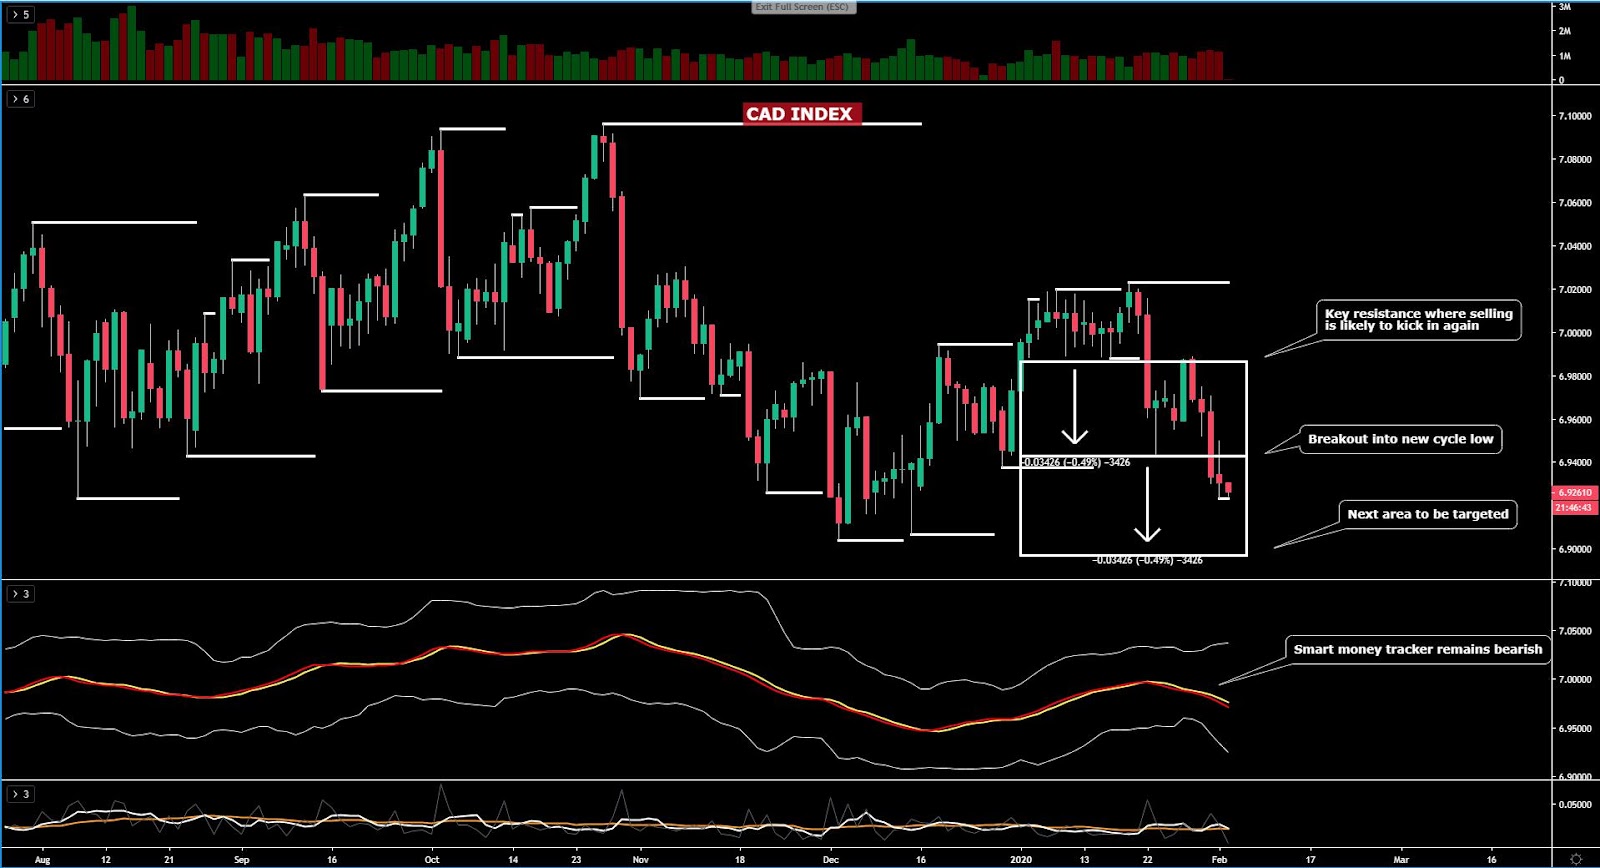
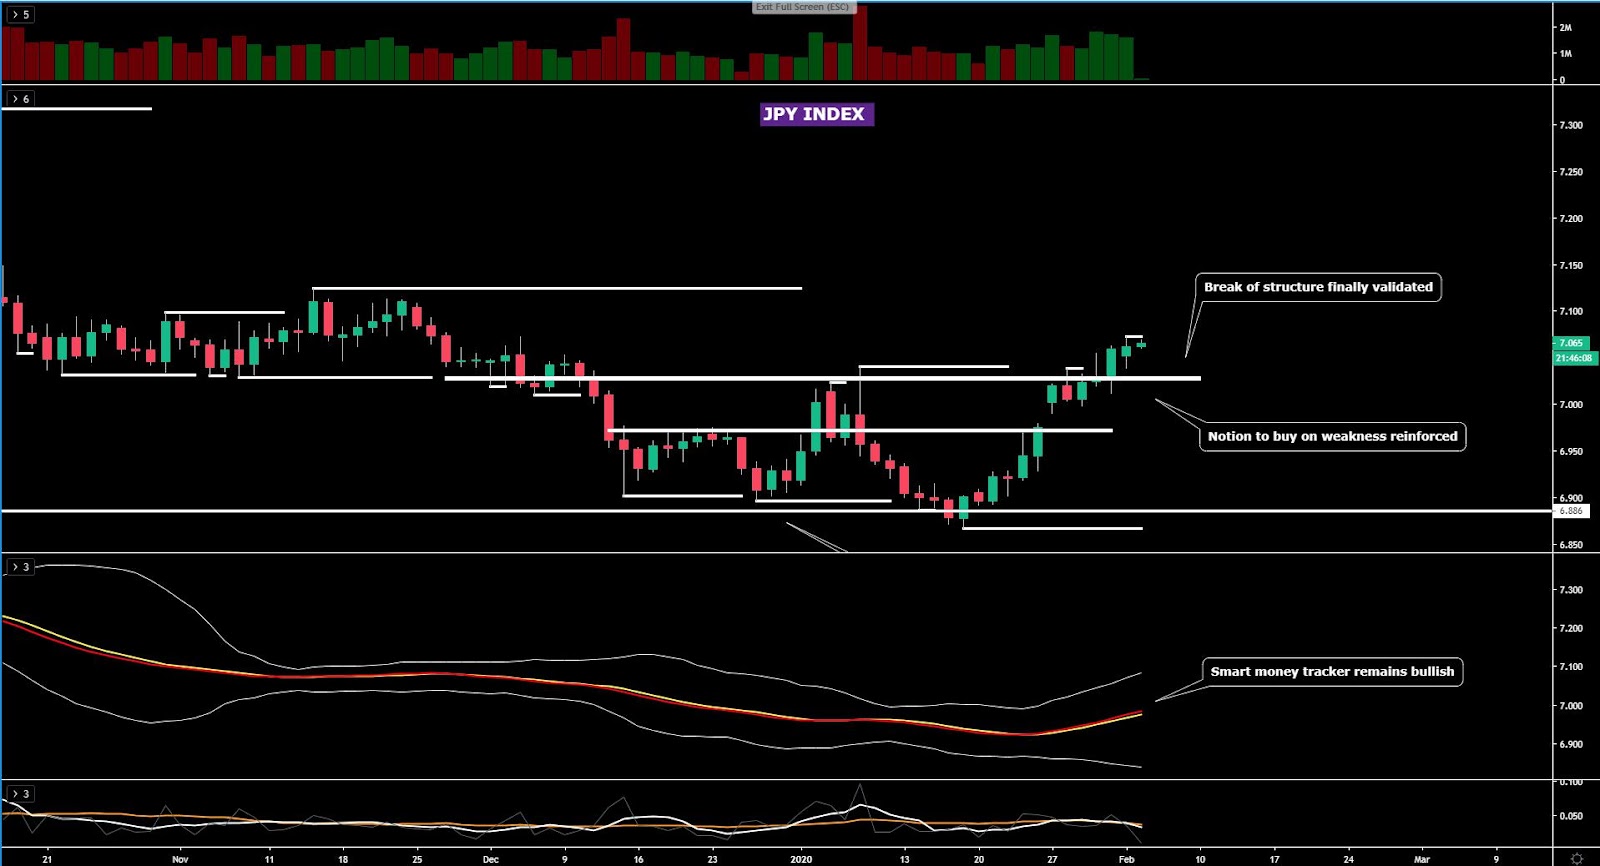
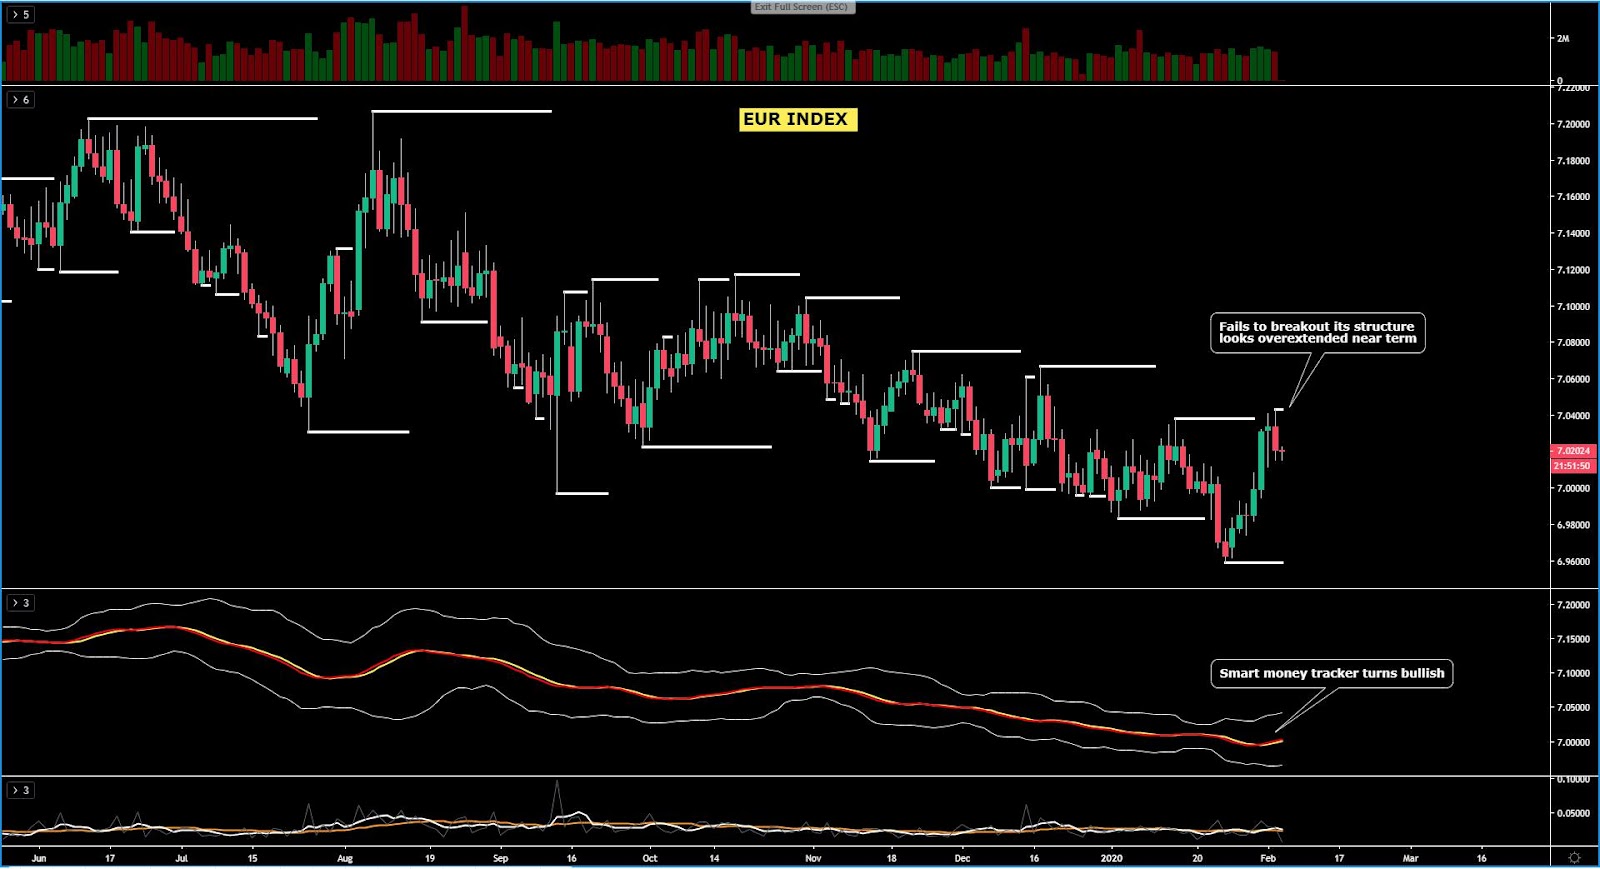
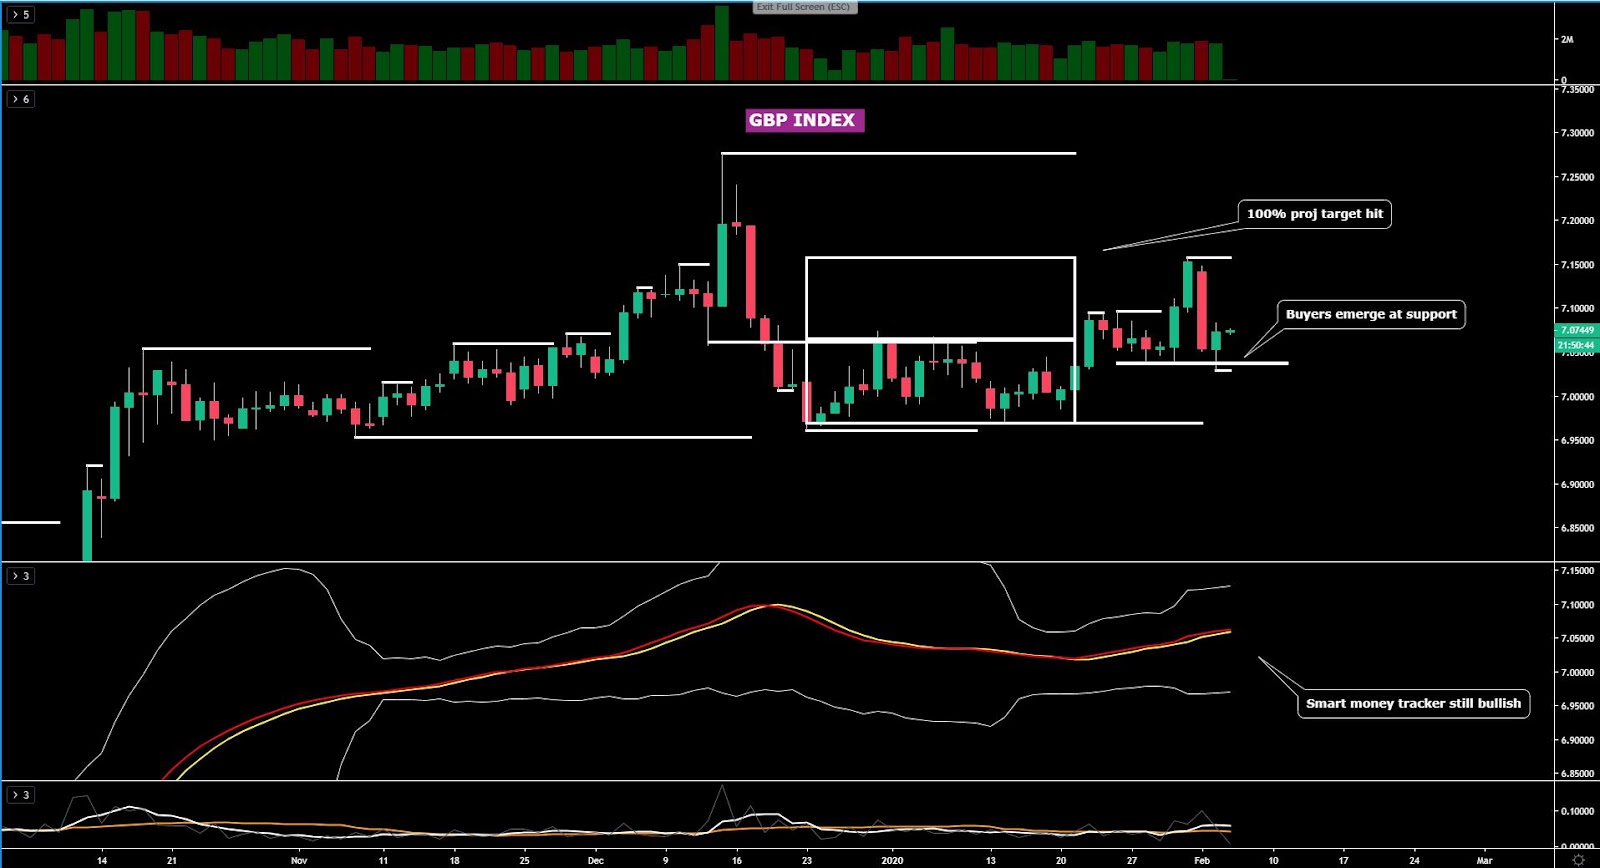
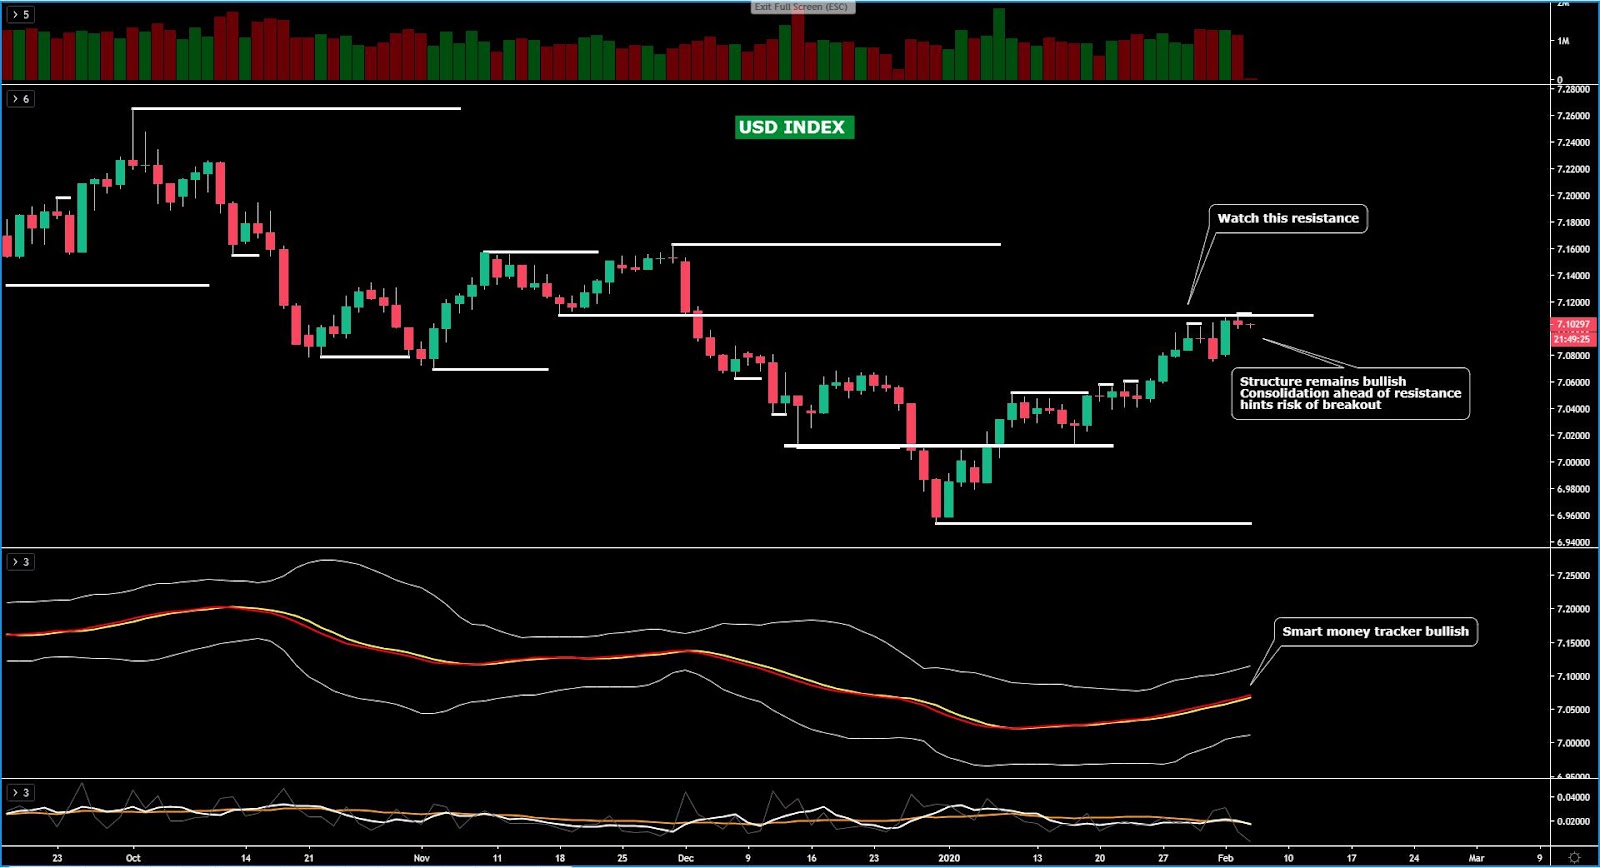
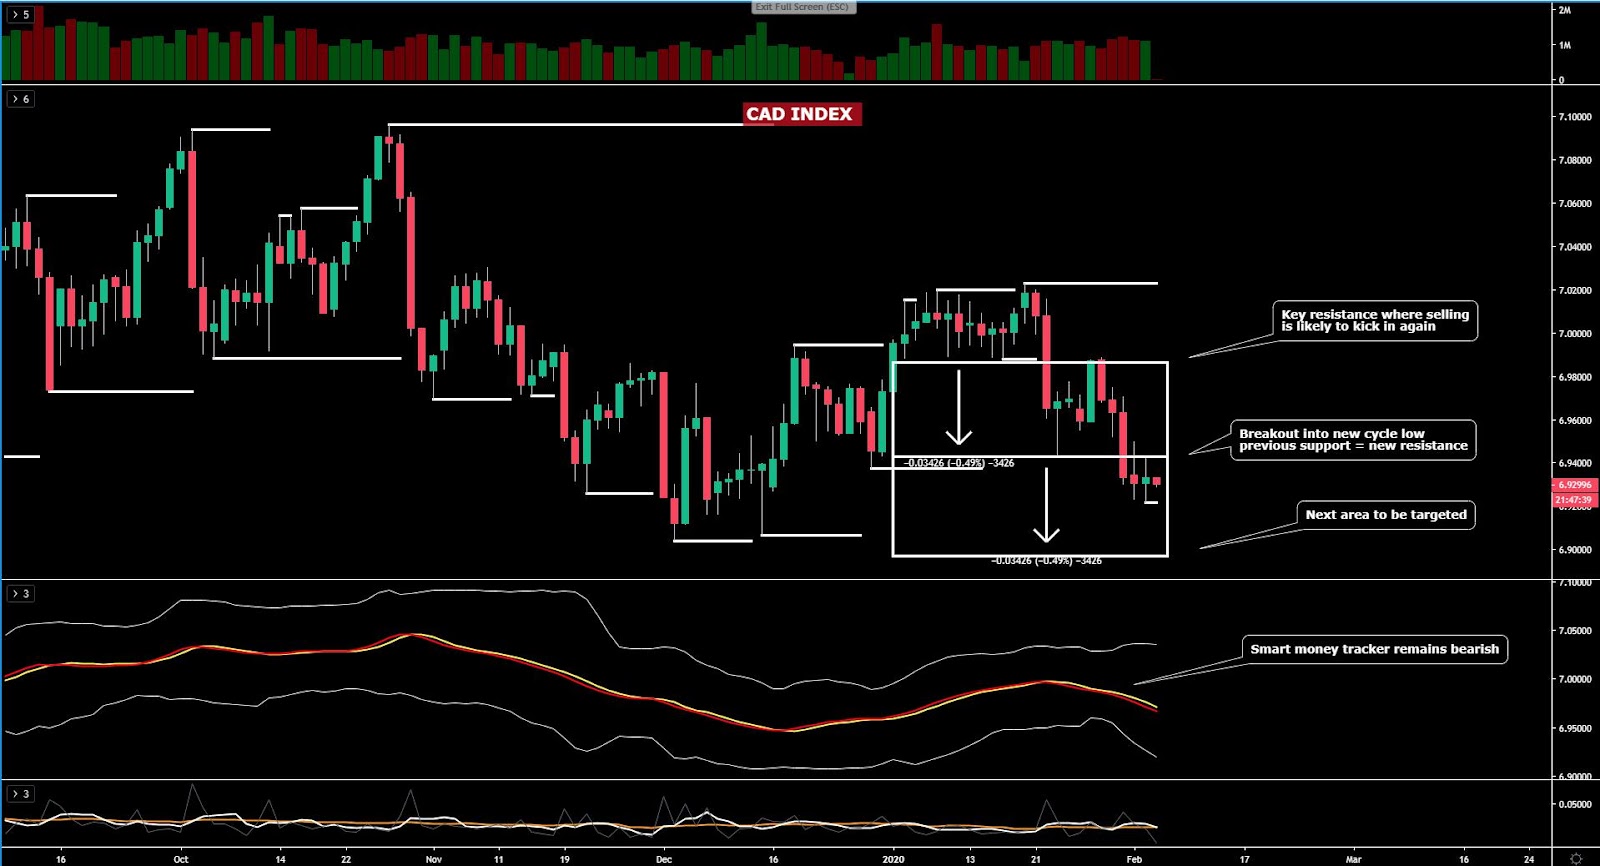
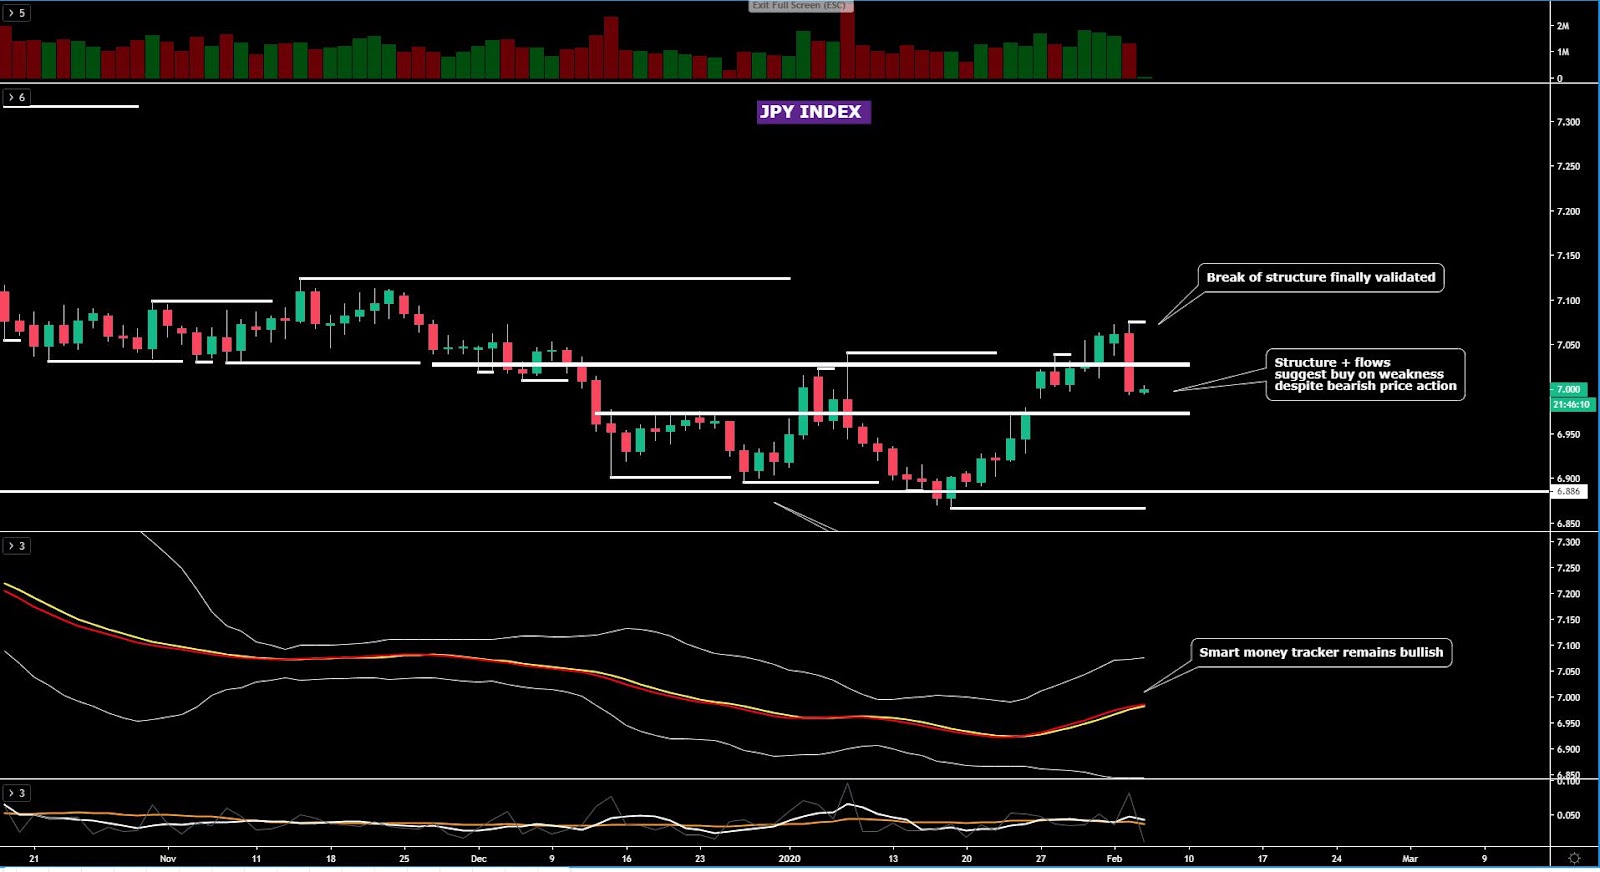
As the charts below illustrate, we have a number of currencies, that when matched, are starting to trend quite nicely. Today, as part of my analysis, I use a set of fibonacci-derived weighted moving averages (13, 21, 34), which is going to provide great insights on what currencies are currently showing the strongest versus the weakest ebbs and flows.
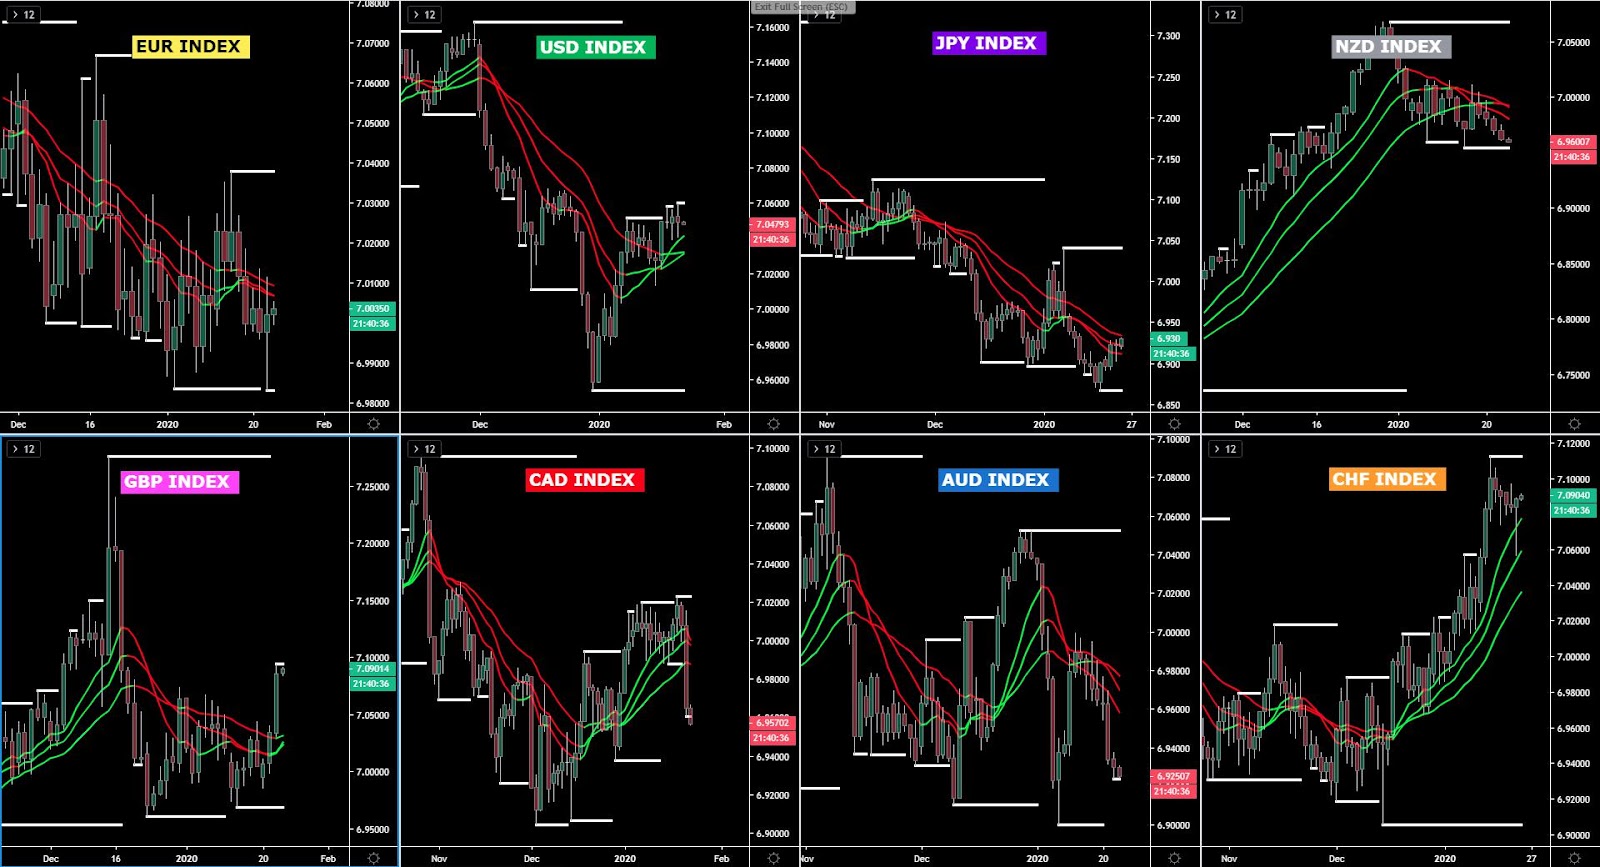
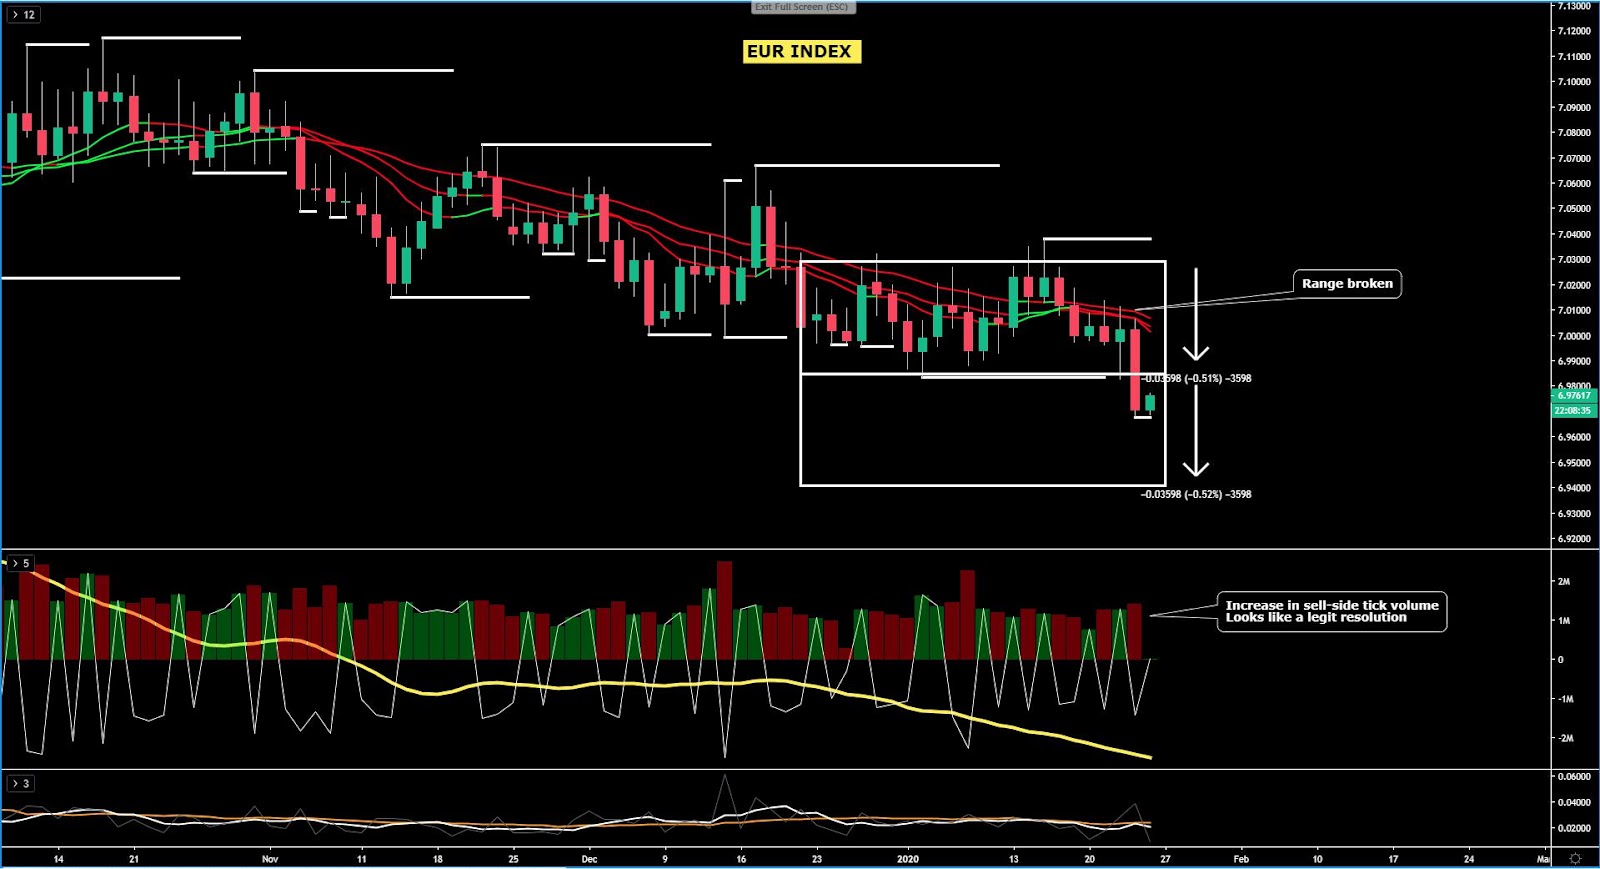
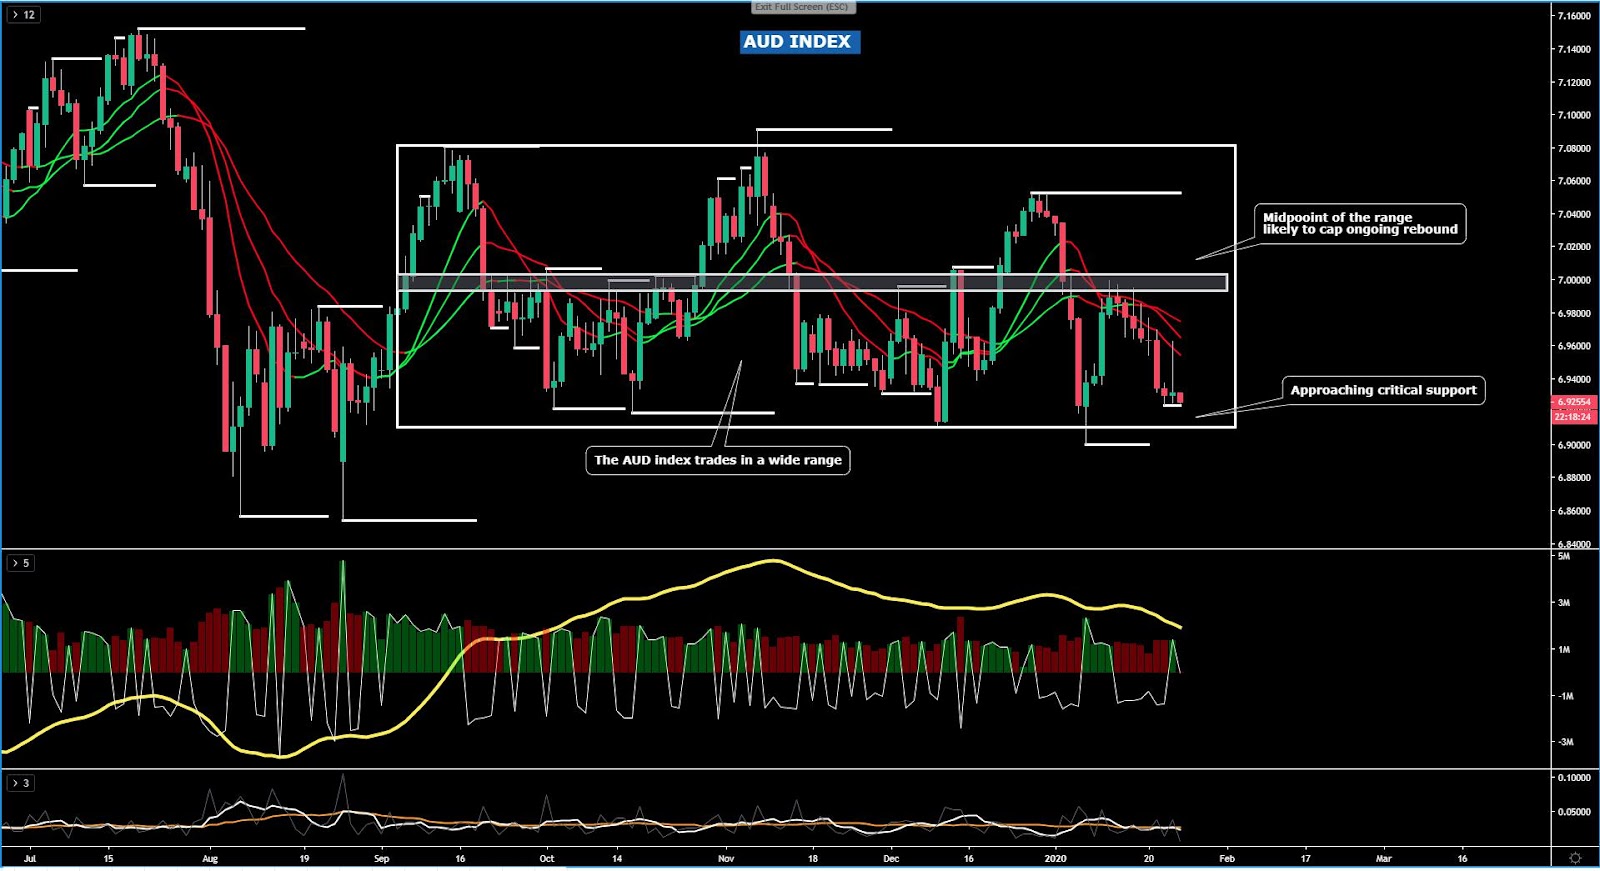
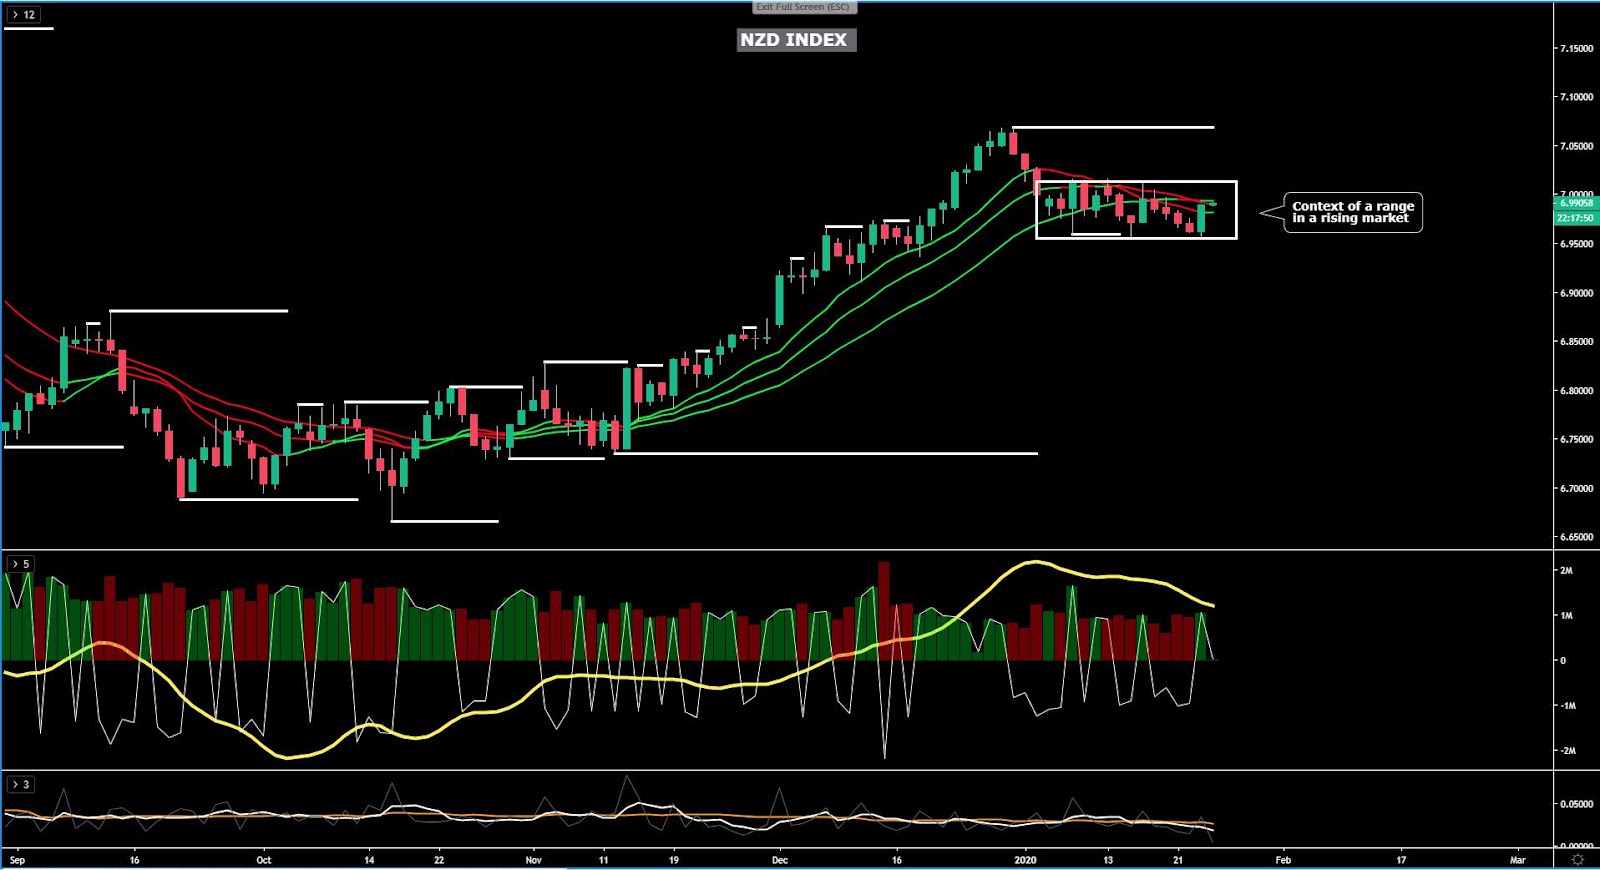
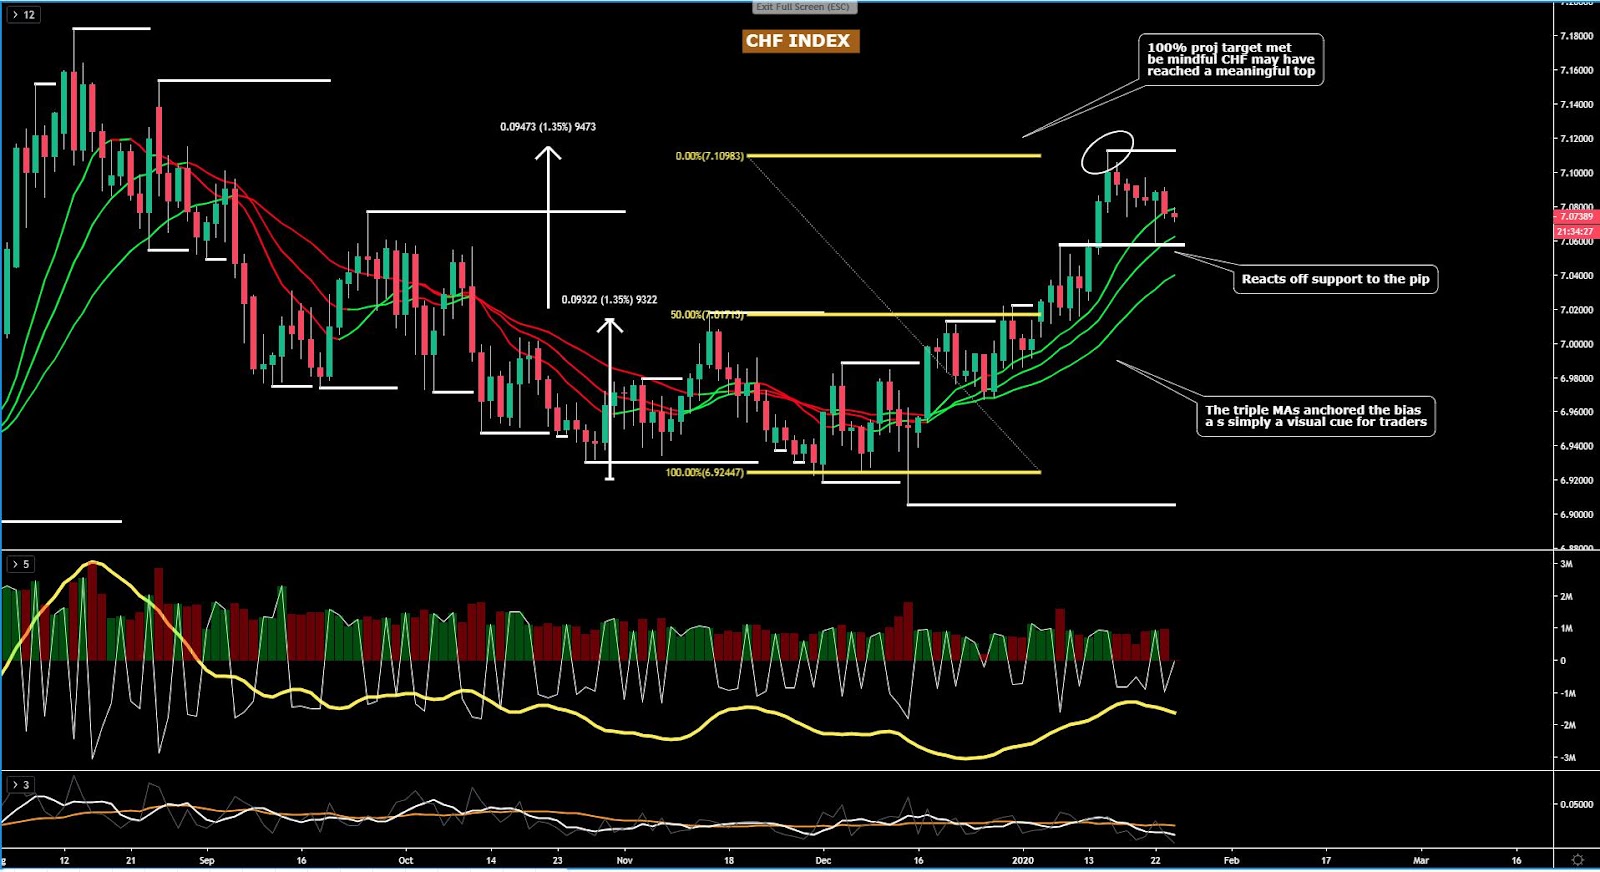
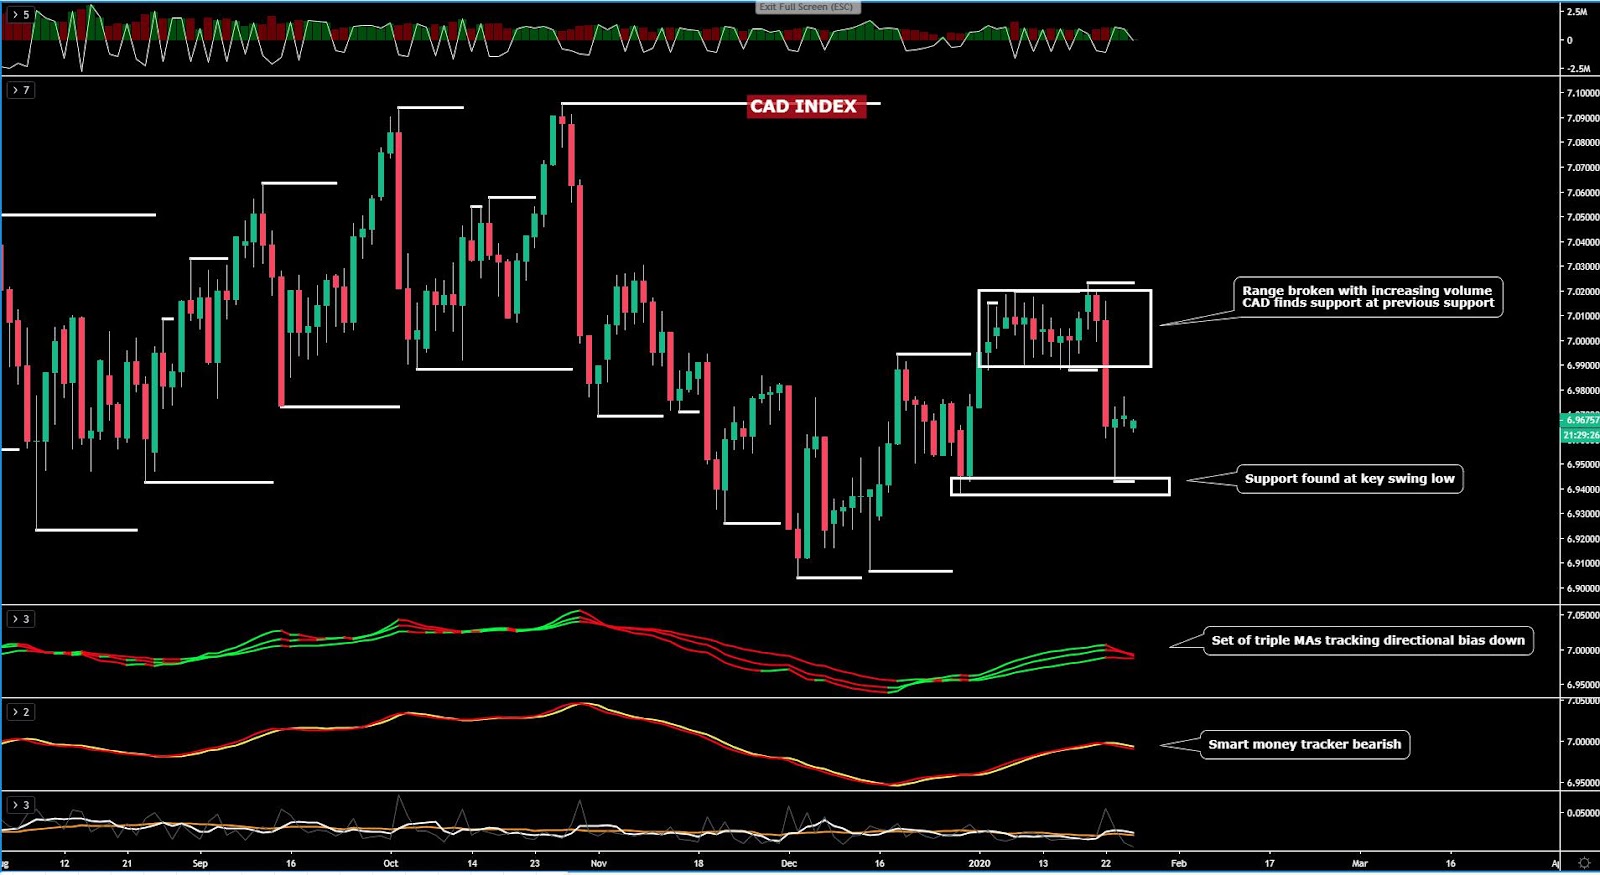
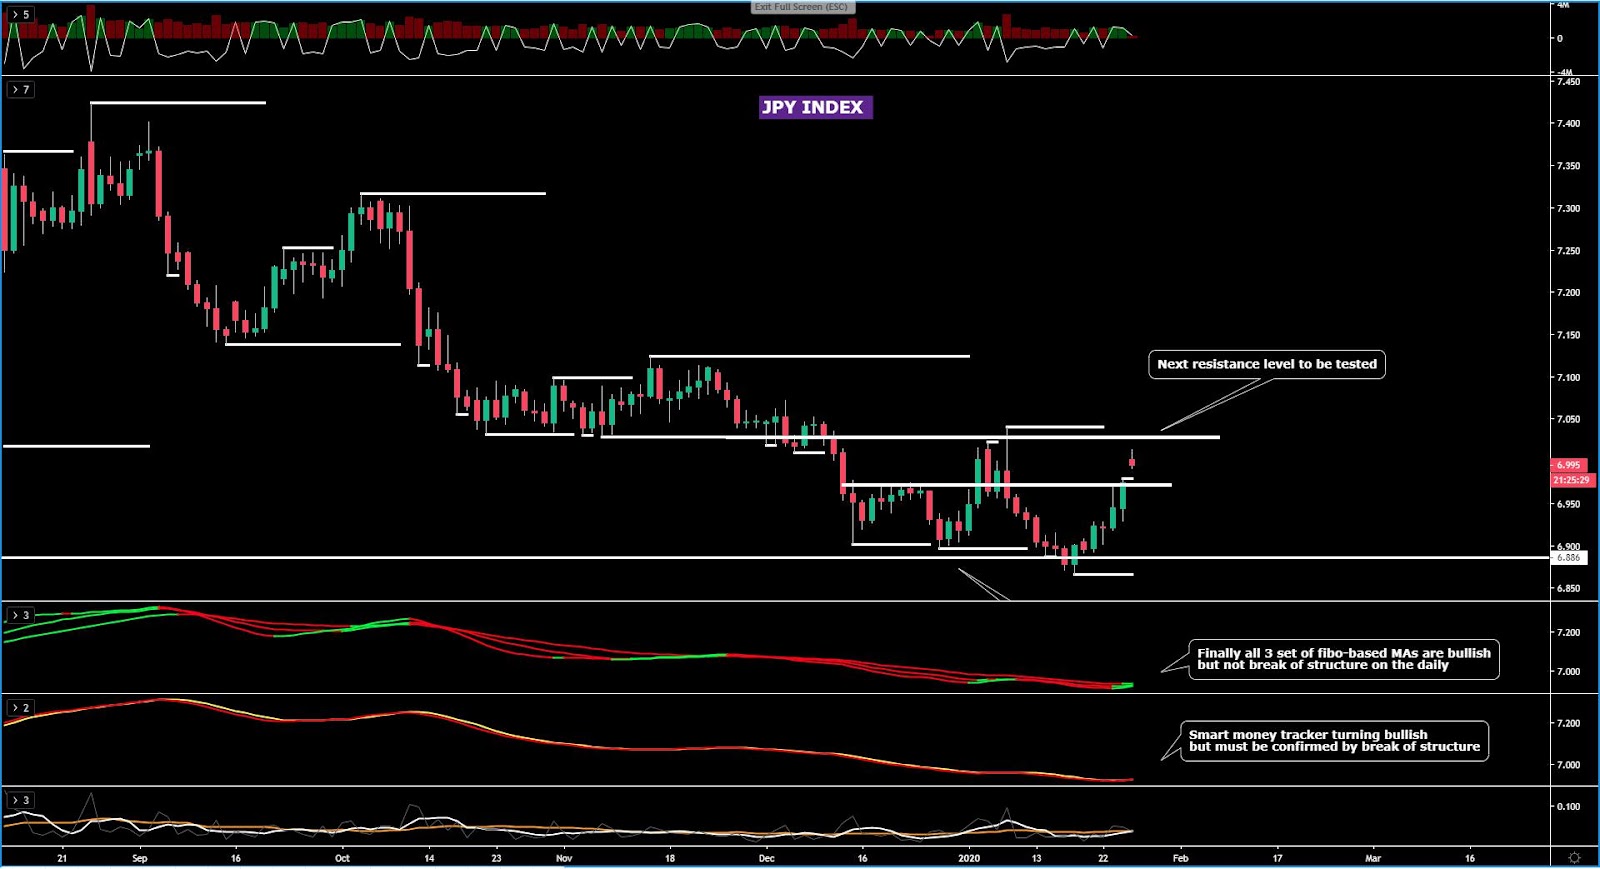
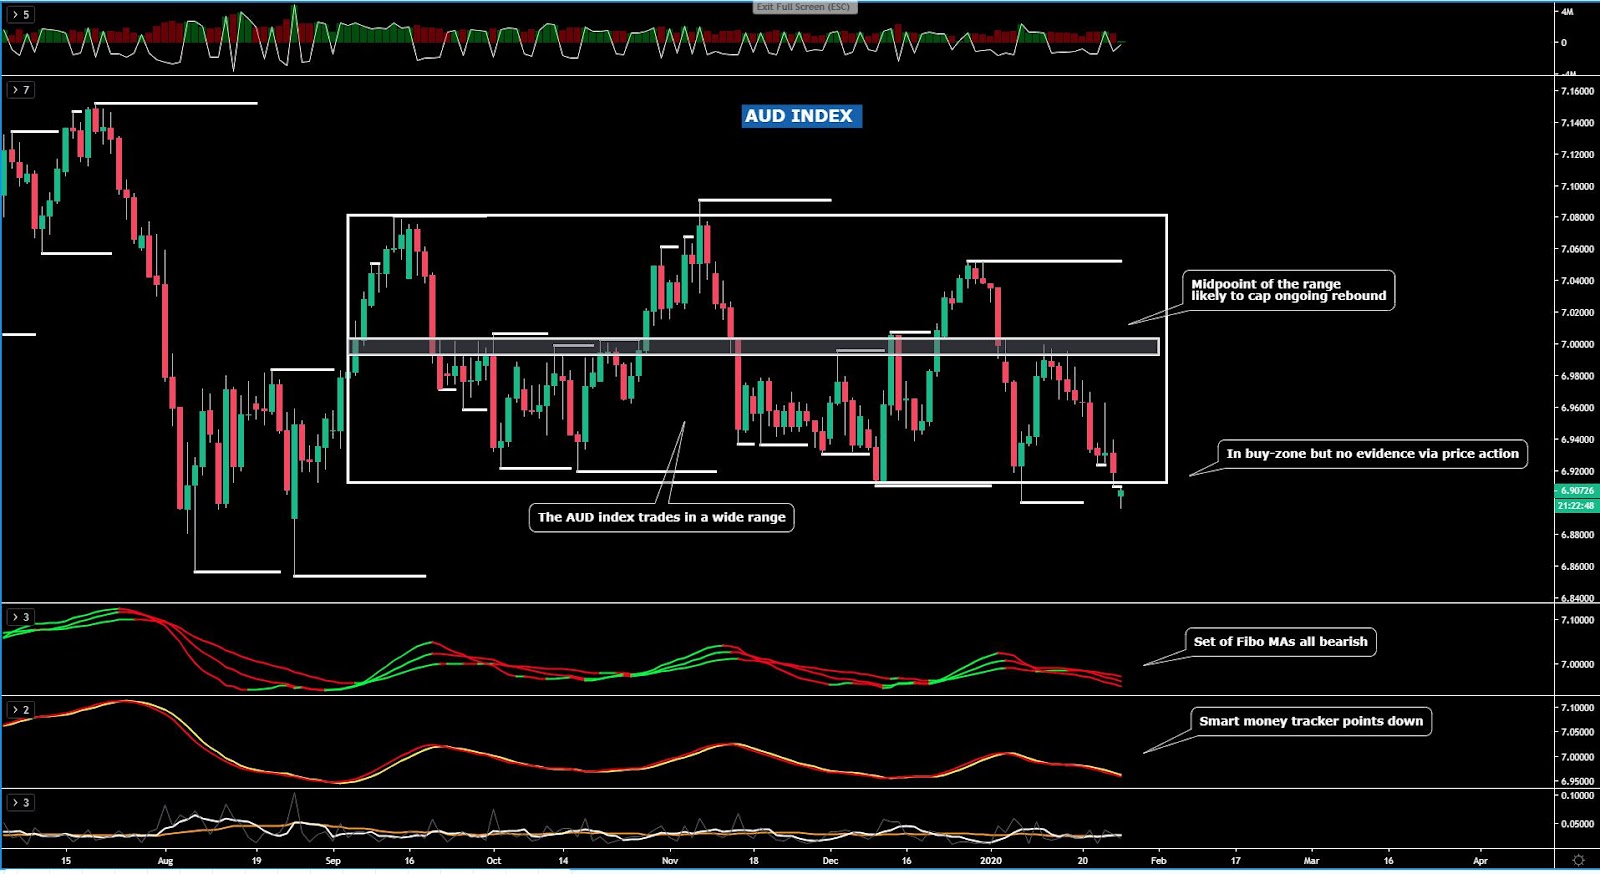
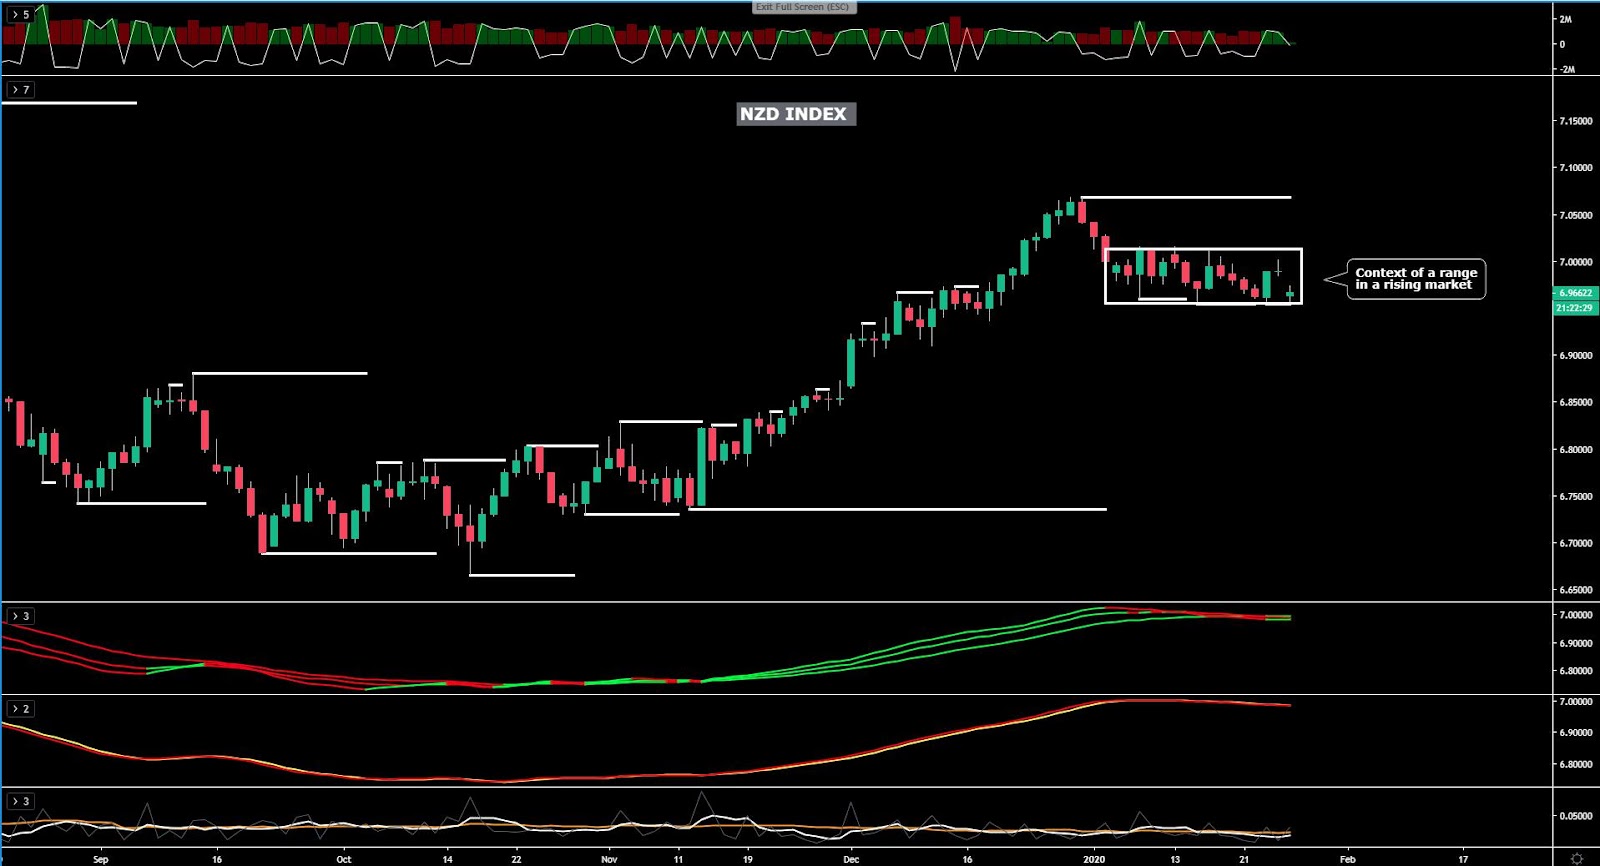
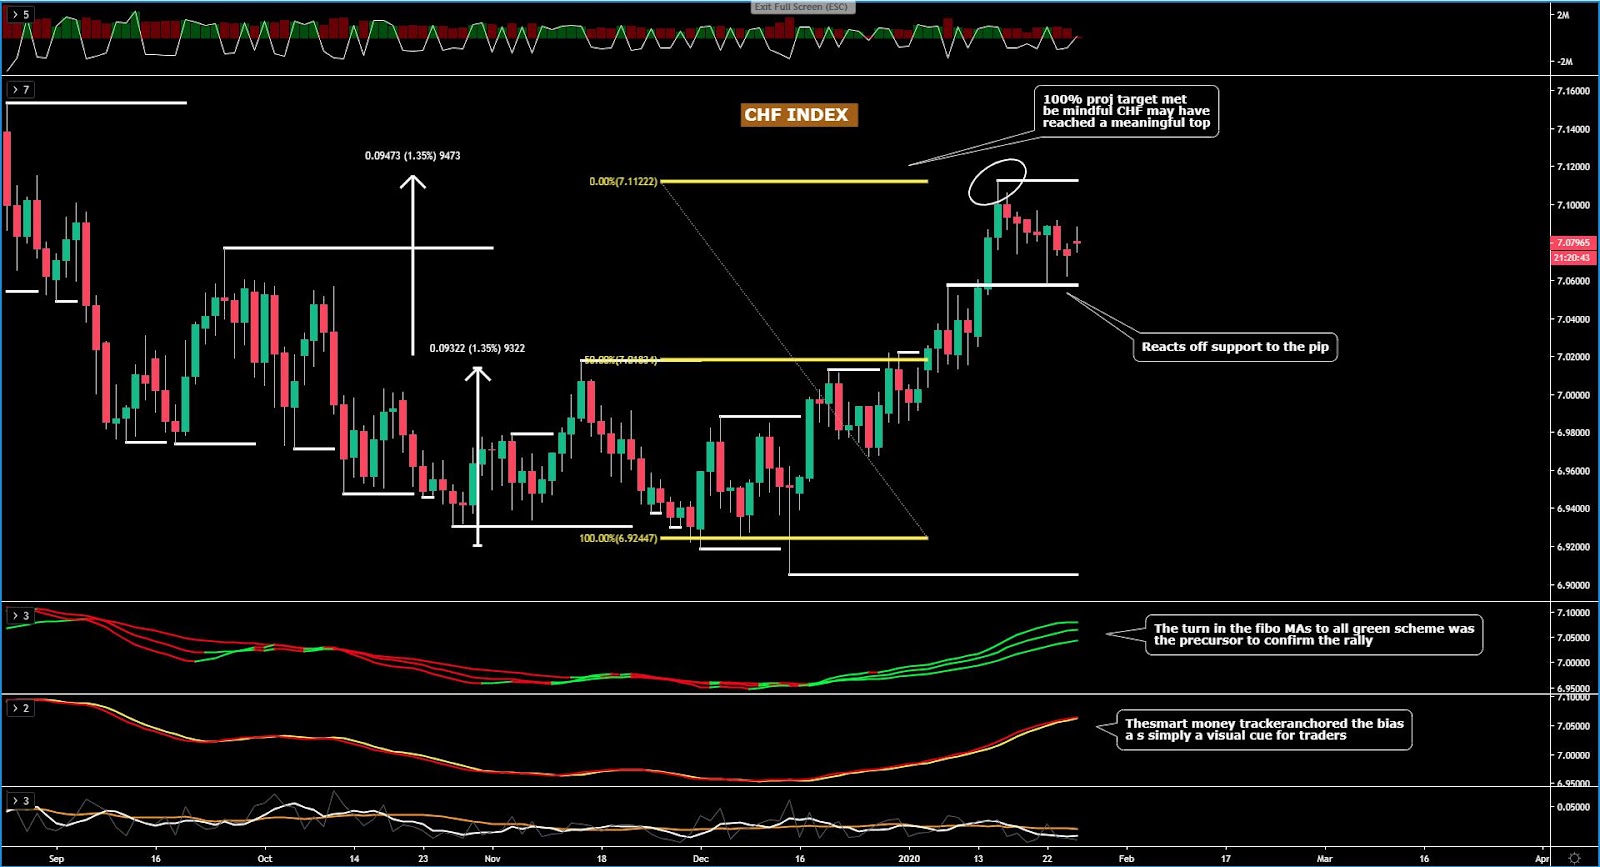
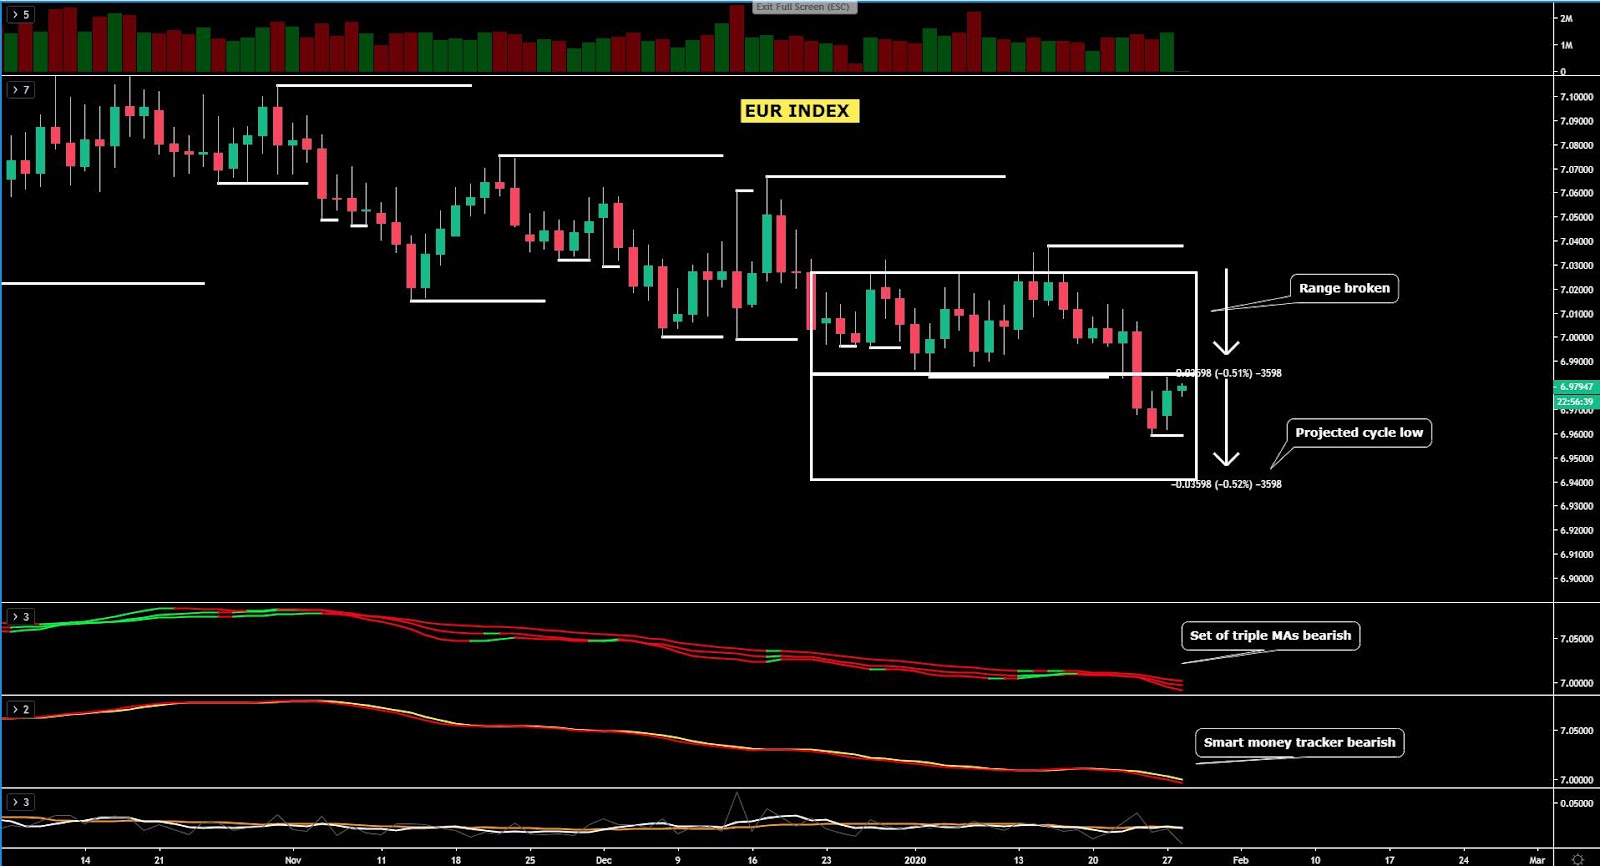
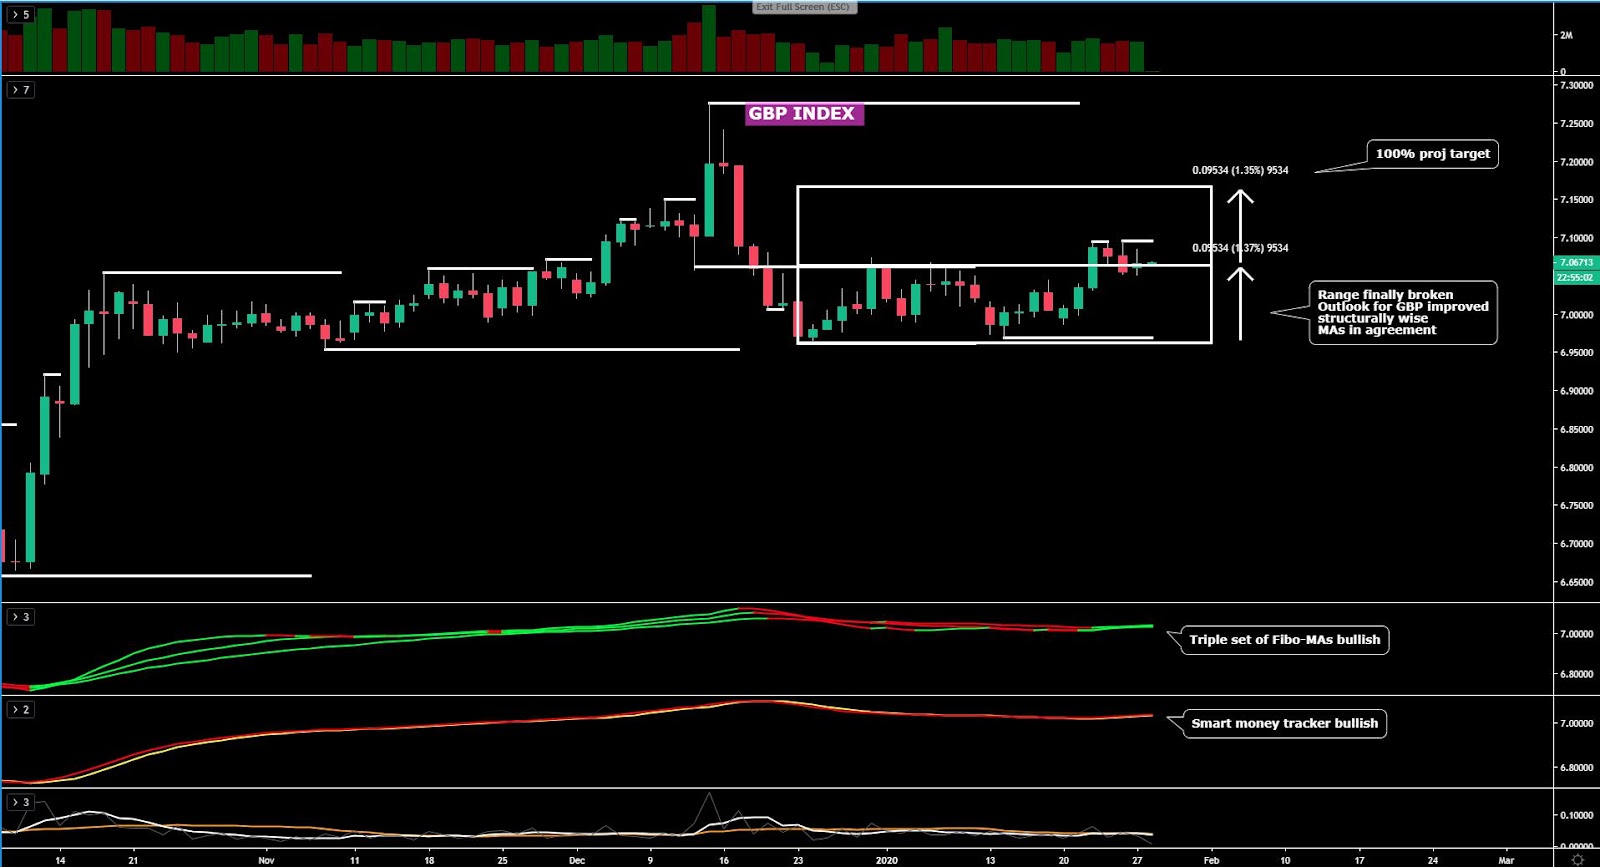
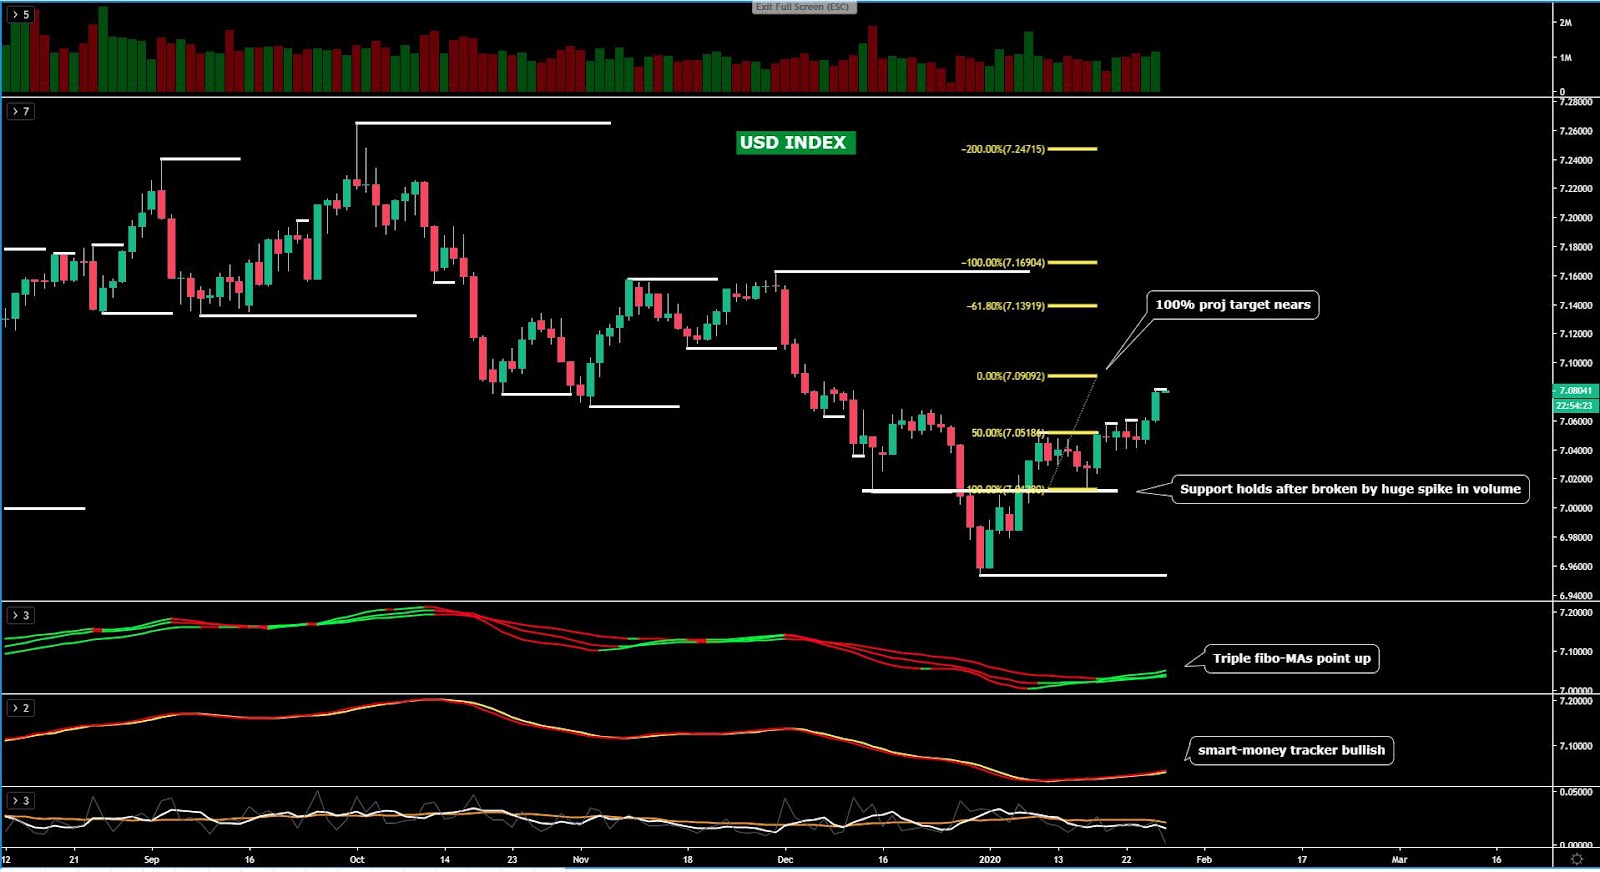
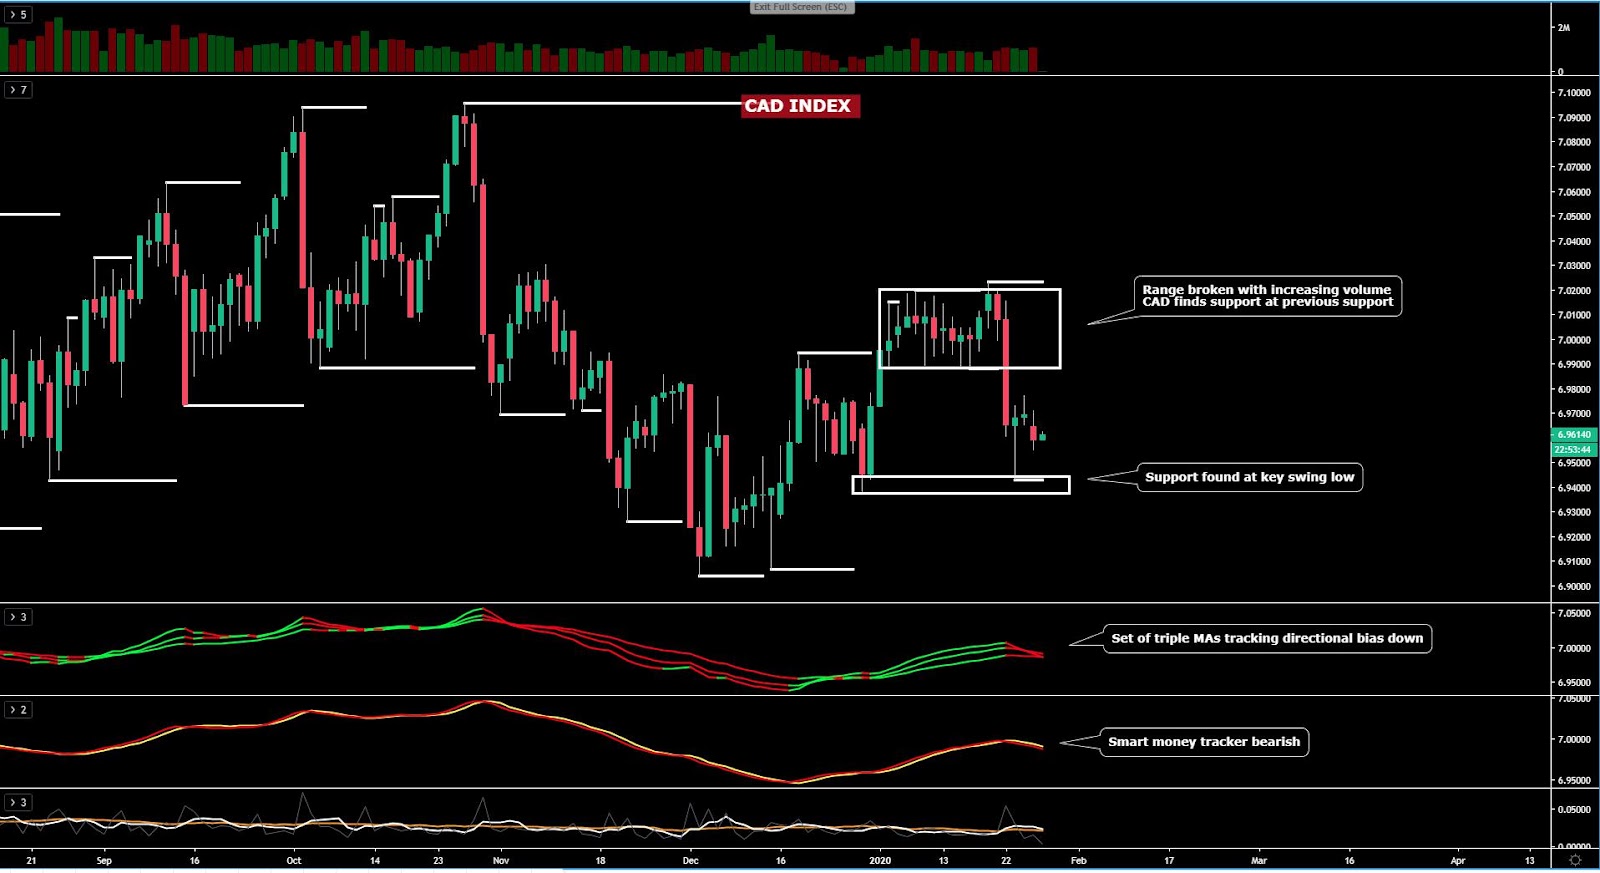
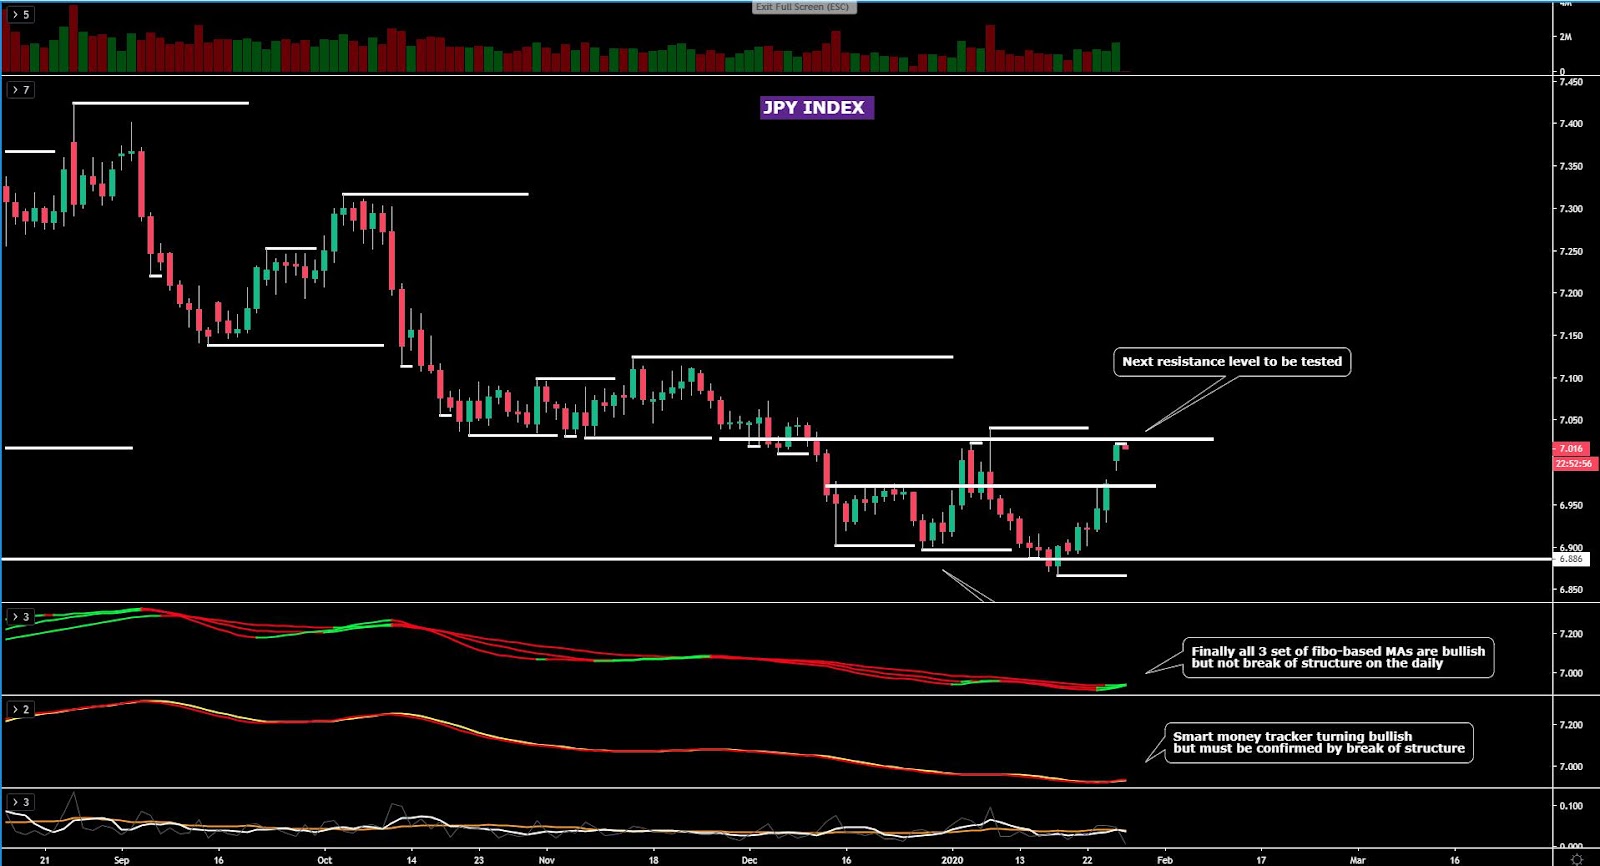
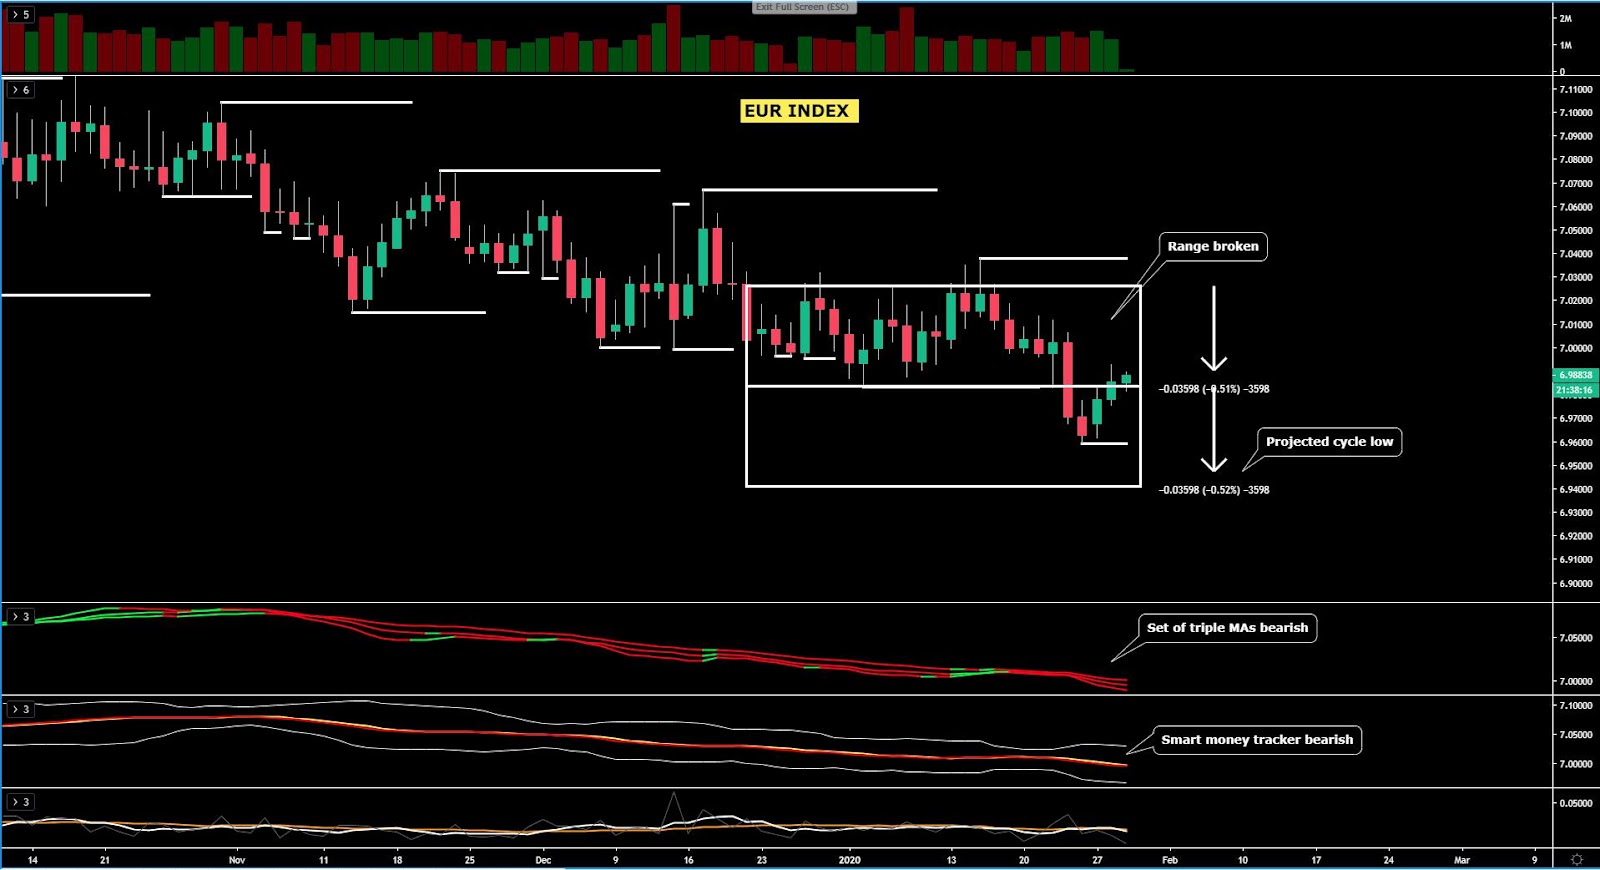
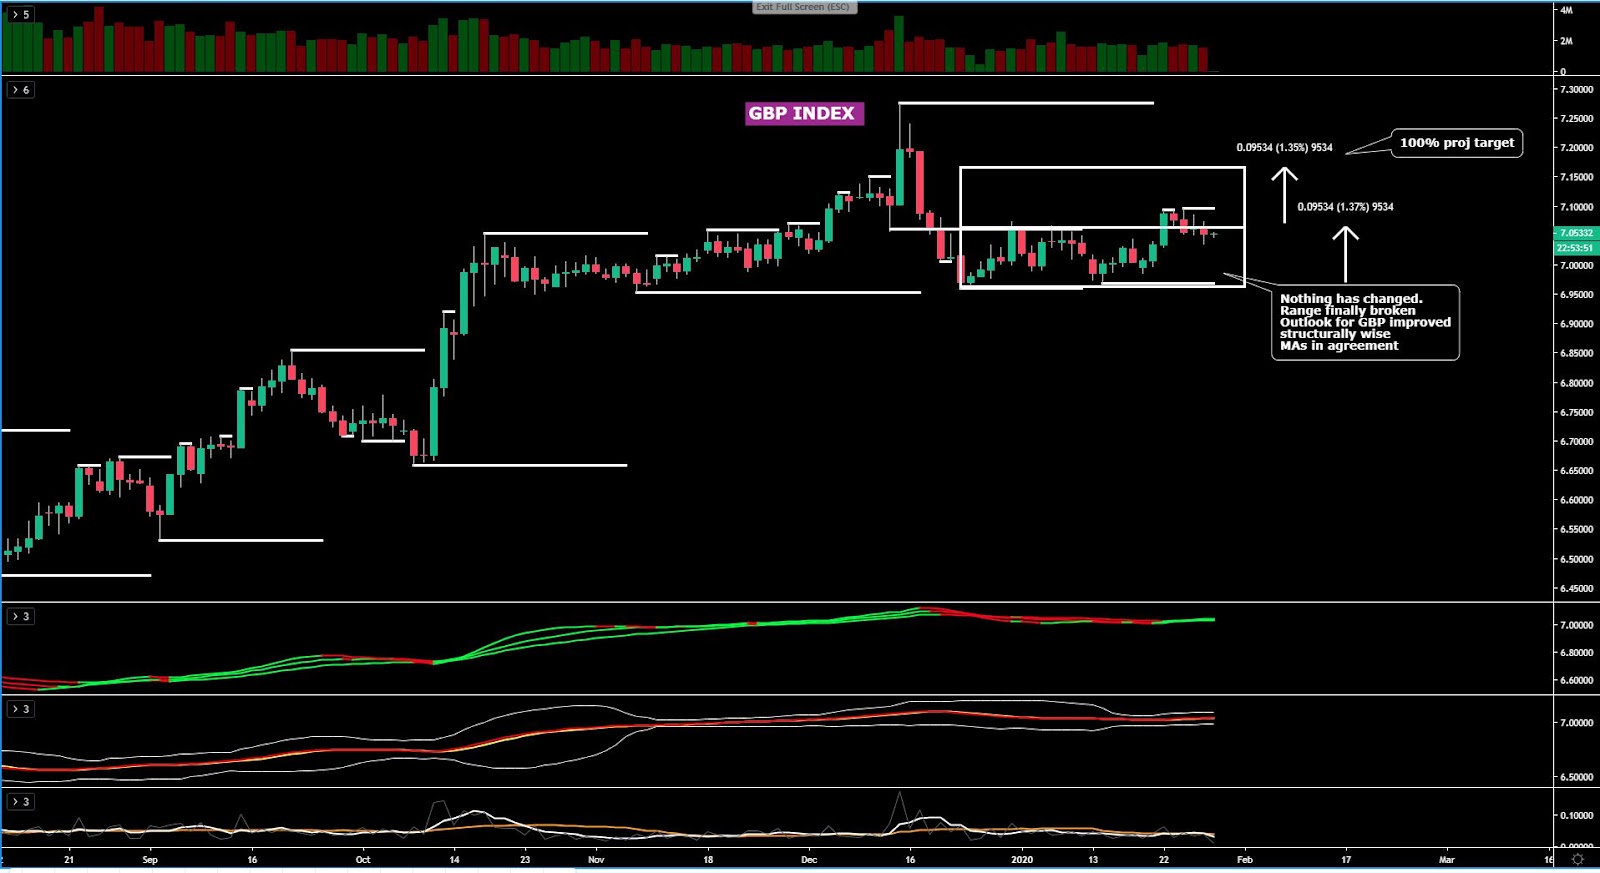
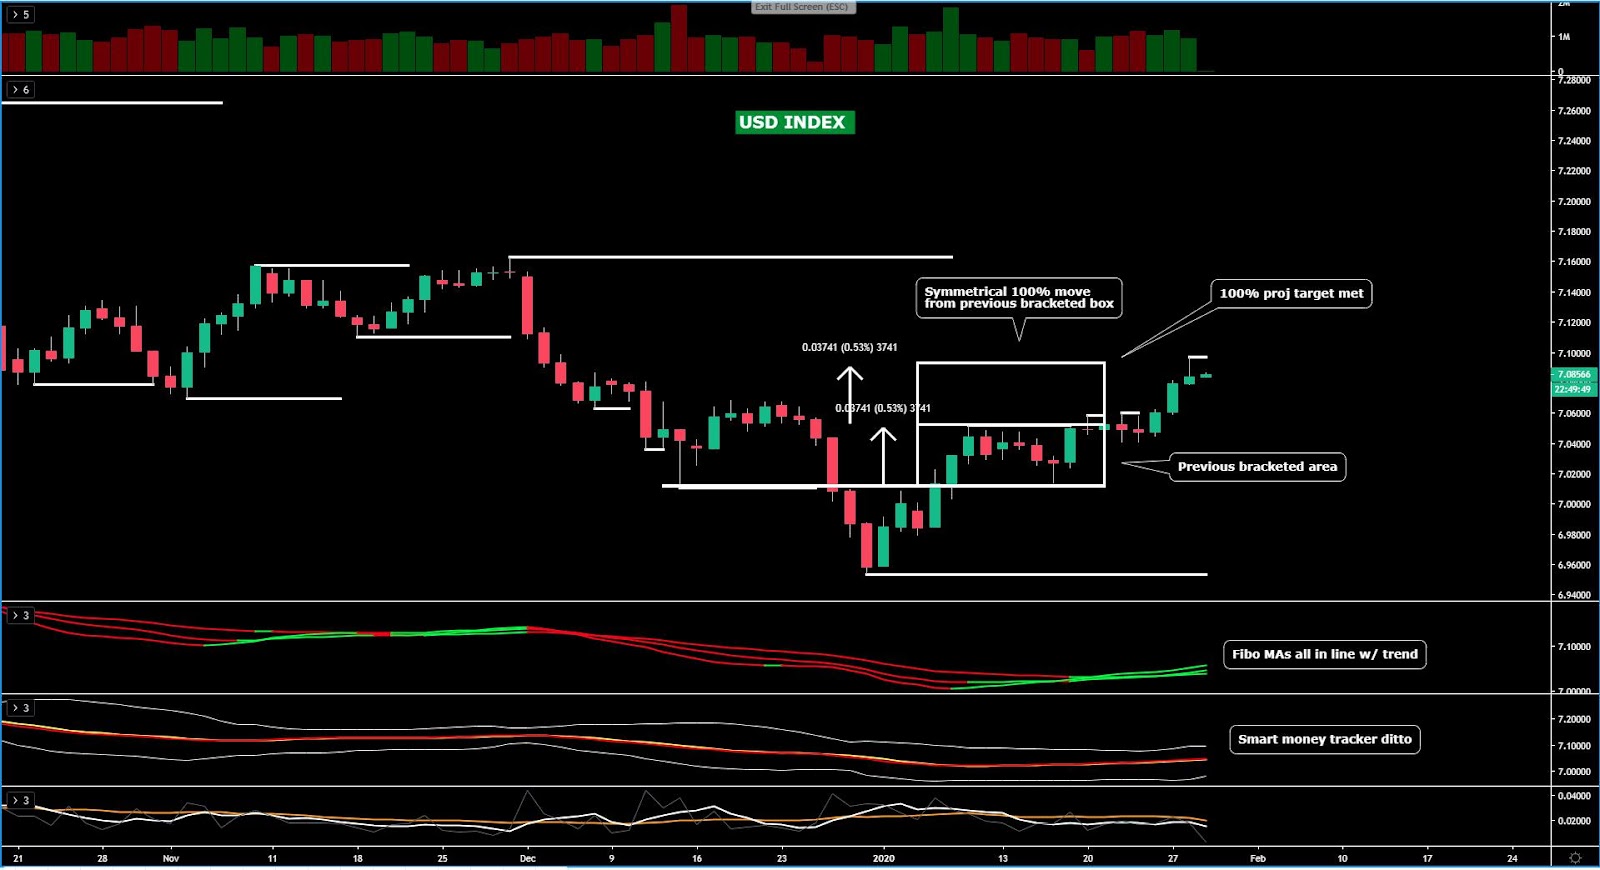
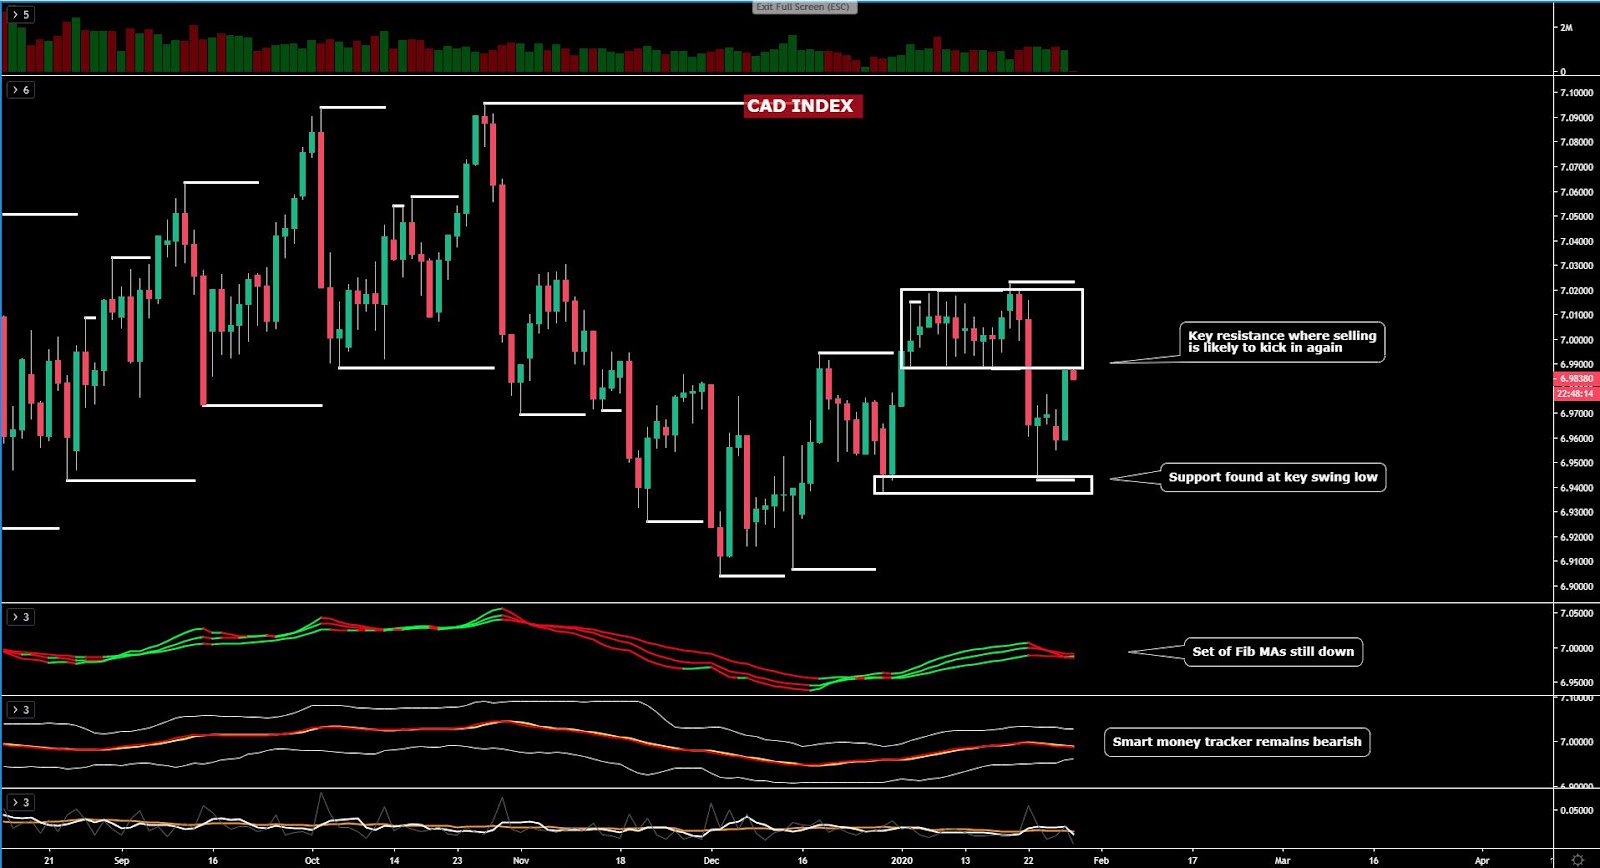
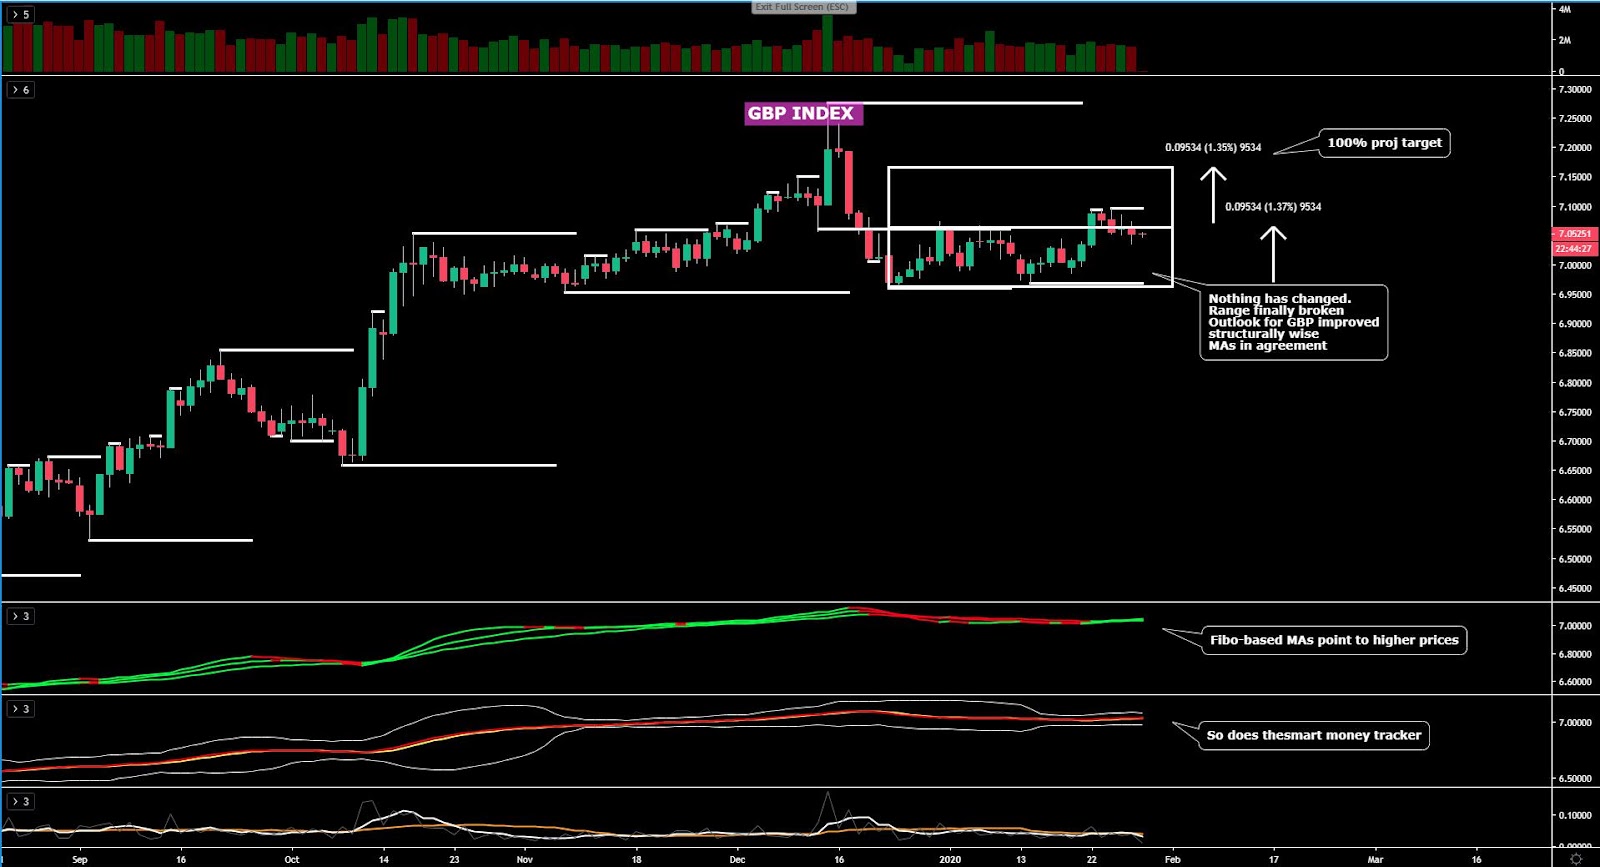
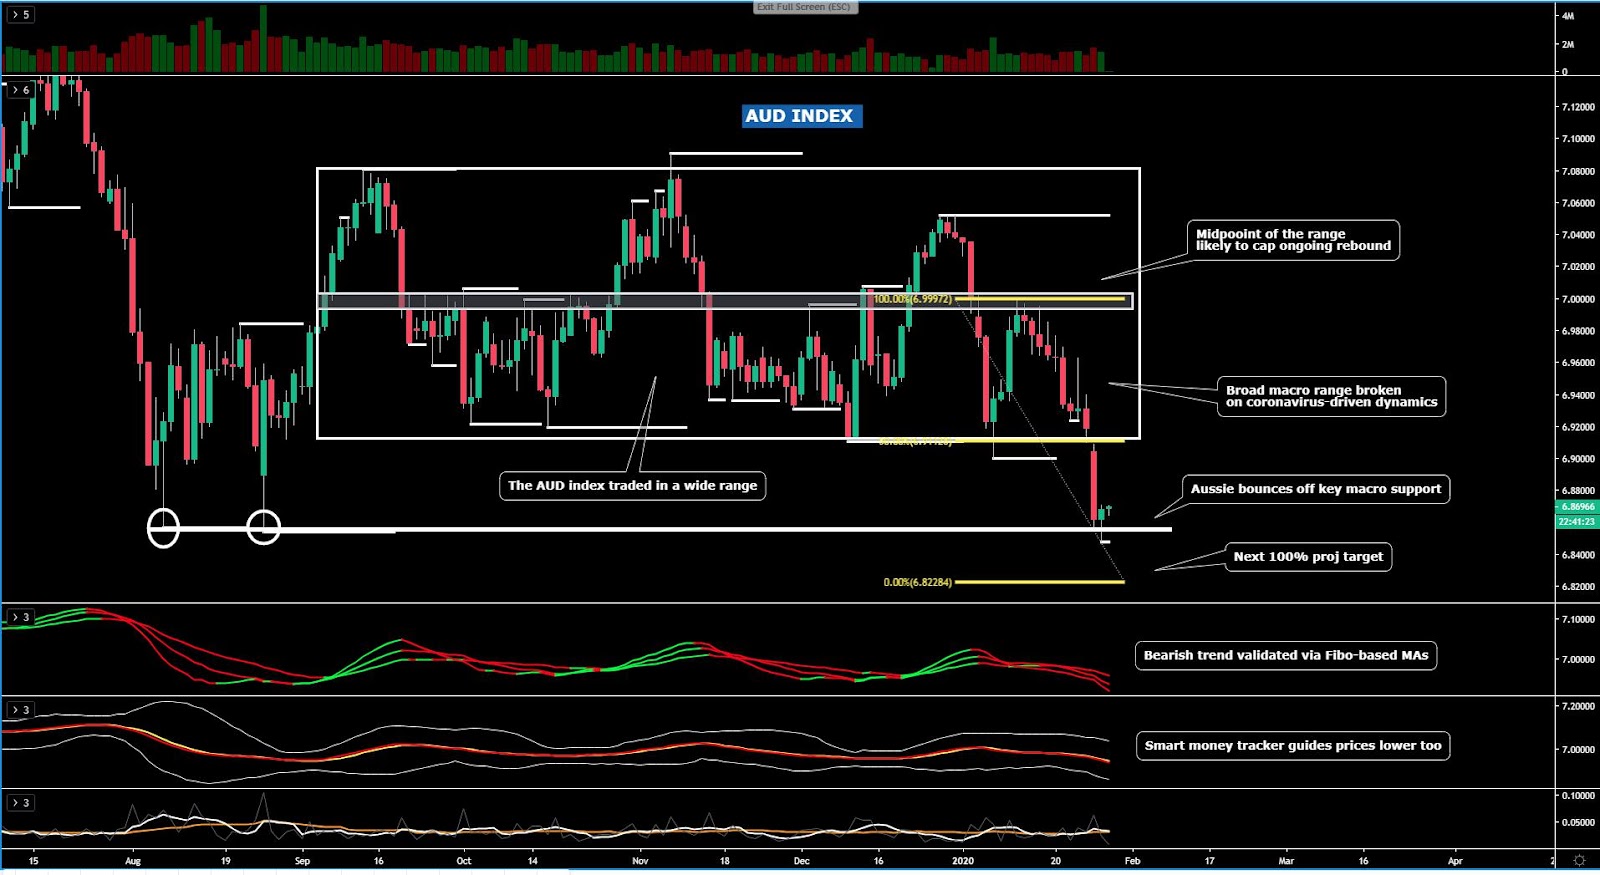
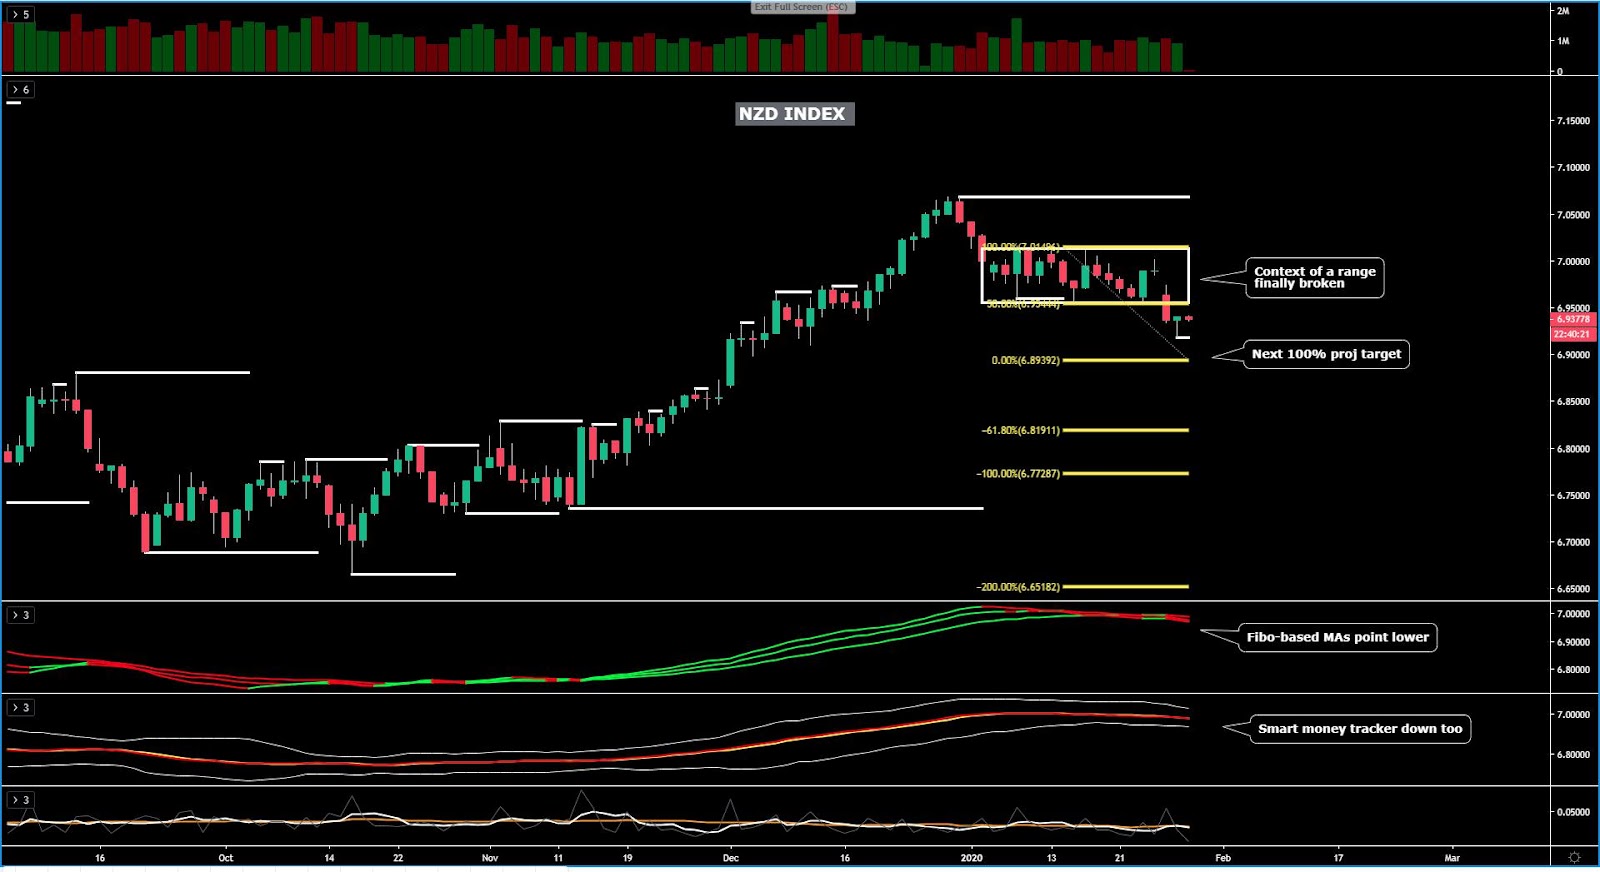
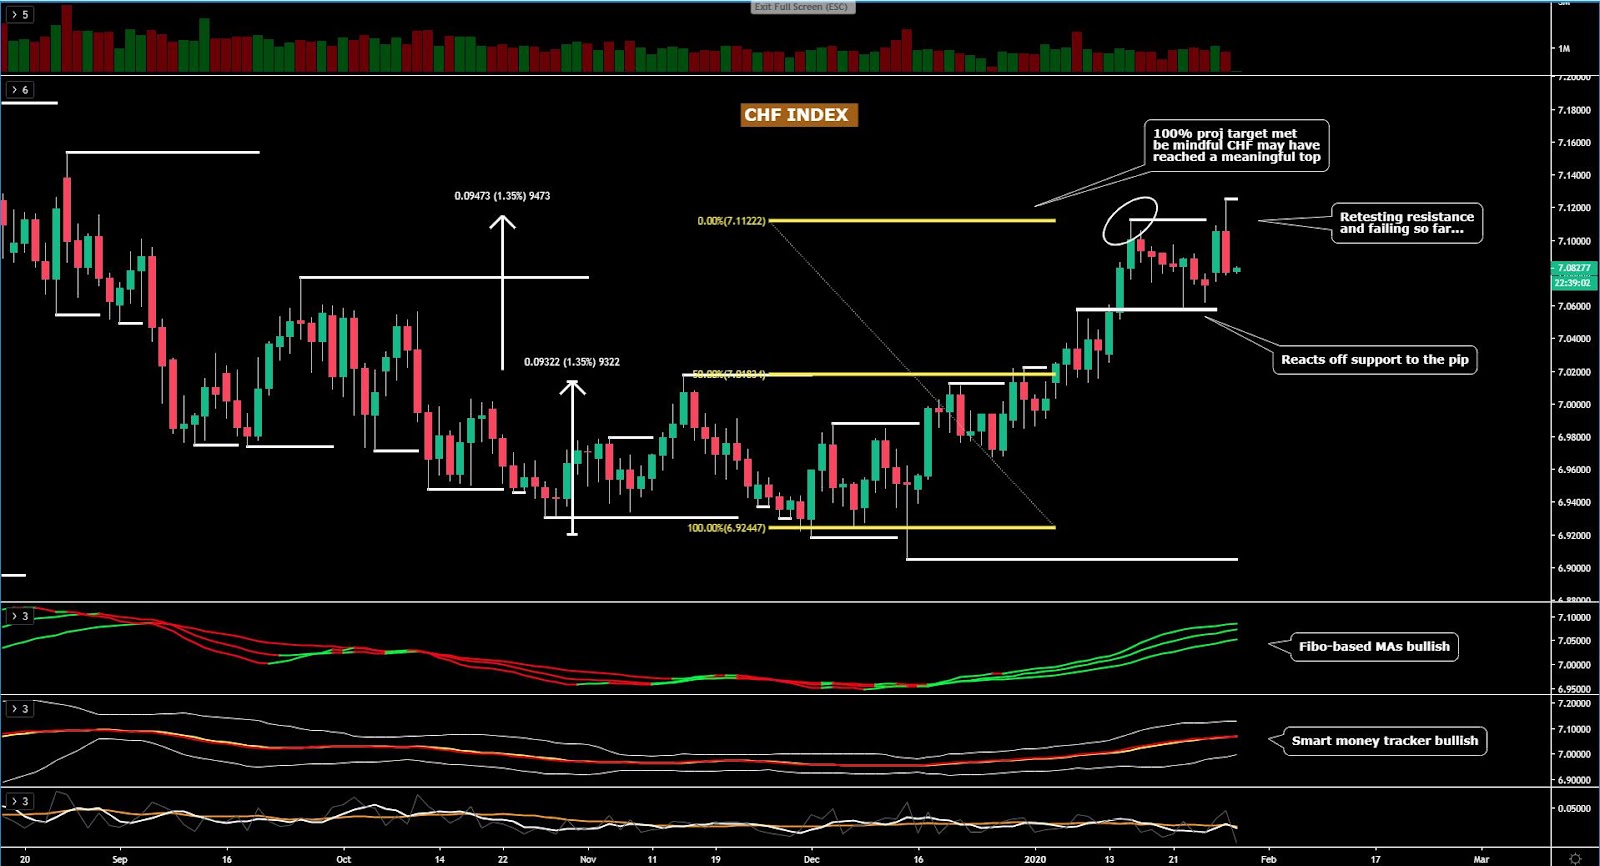
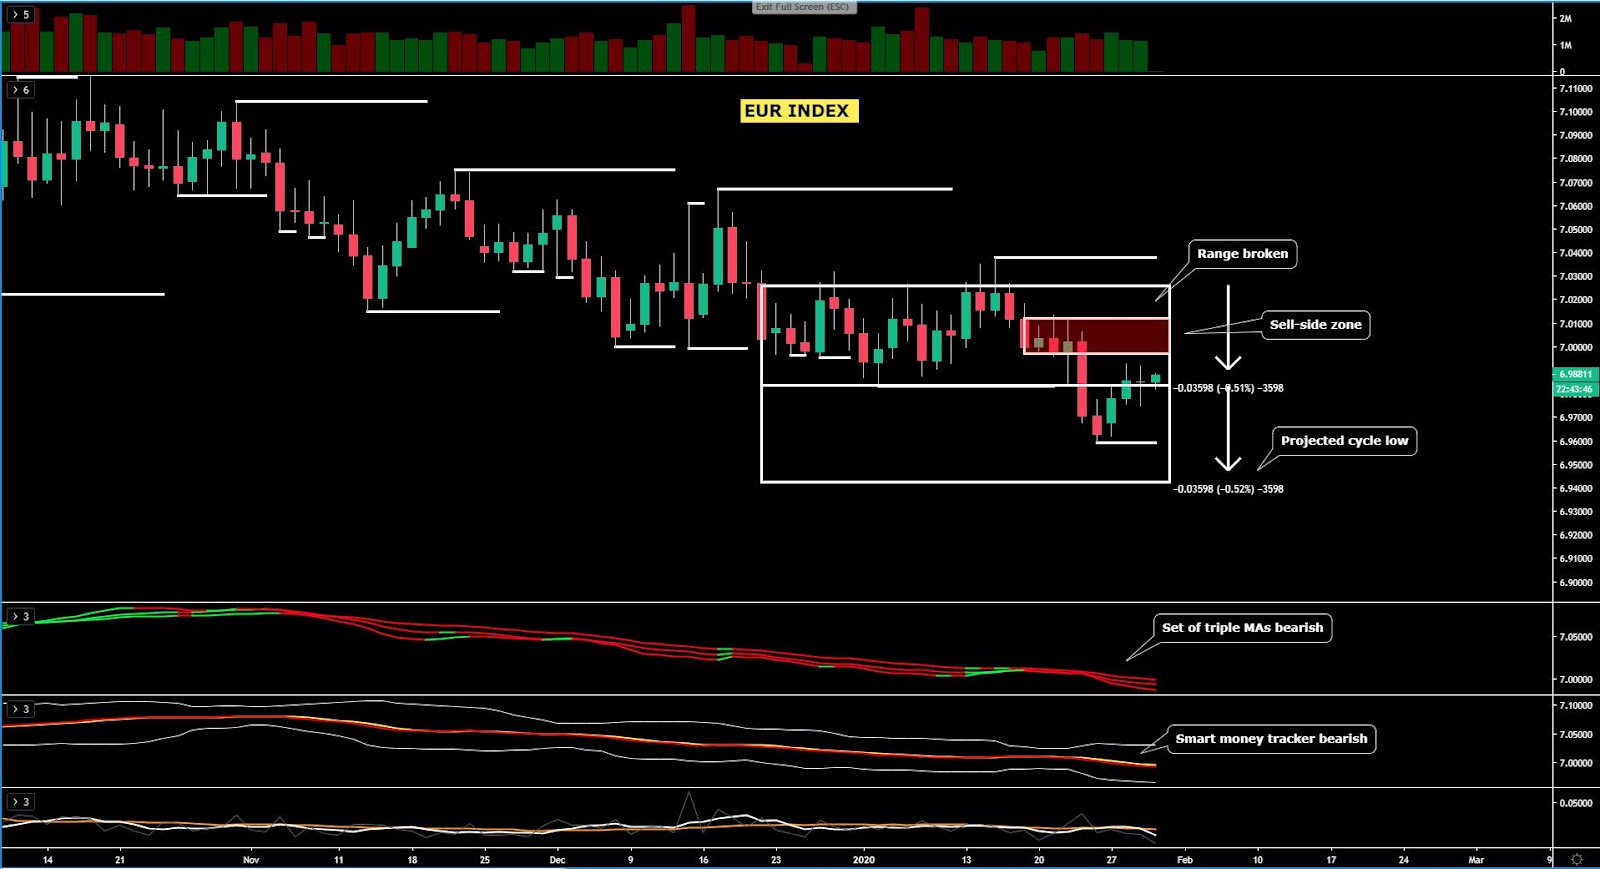
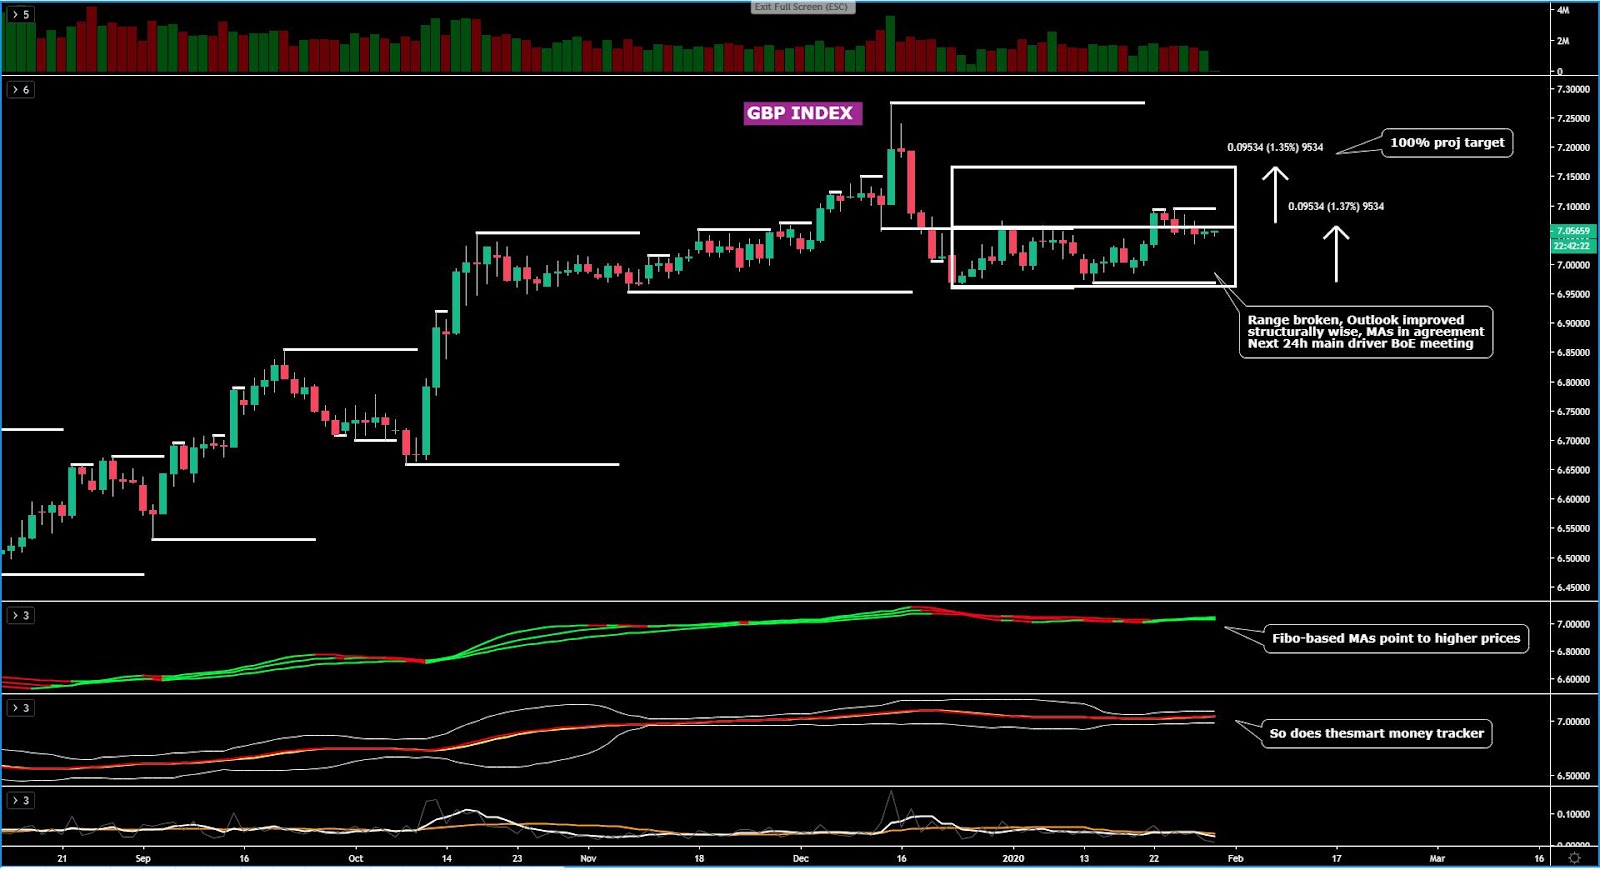
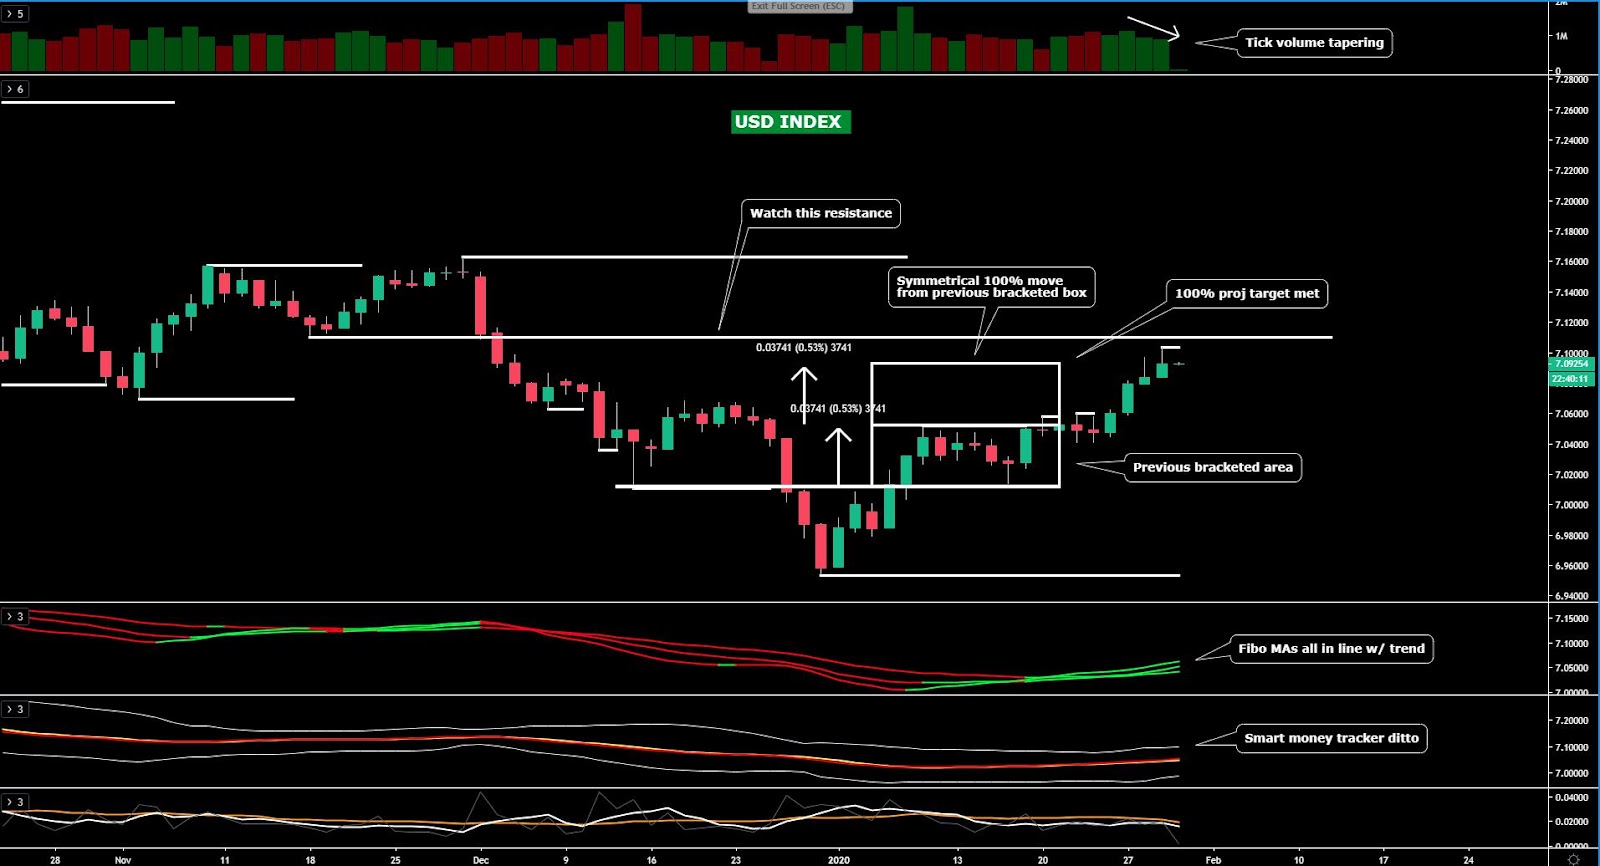
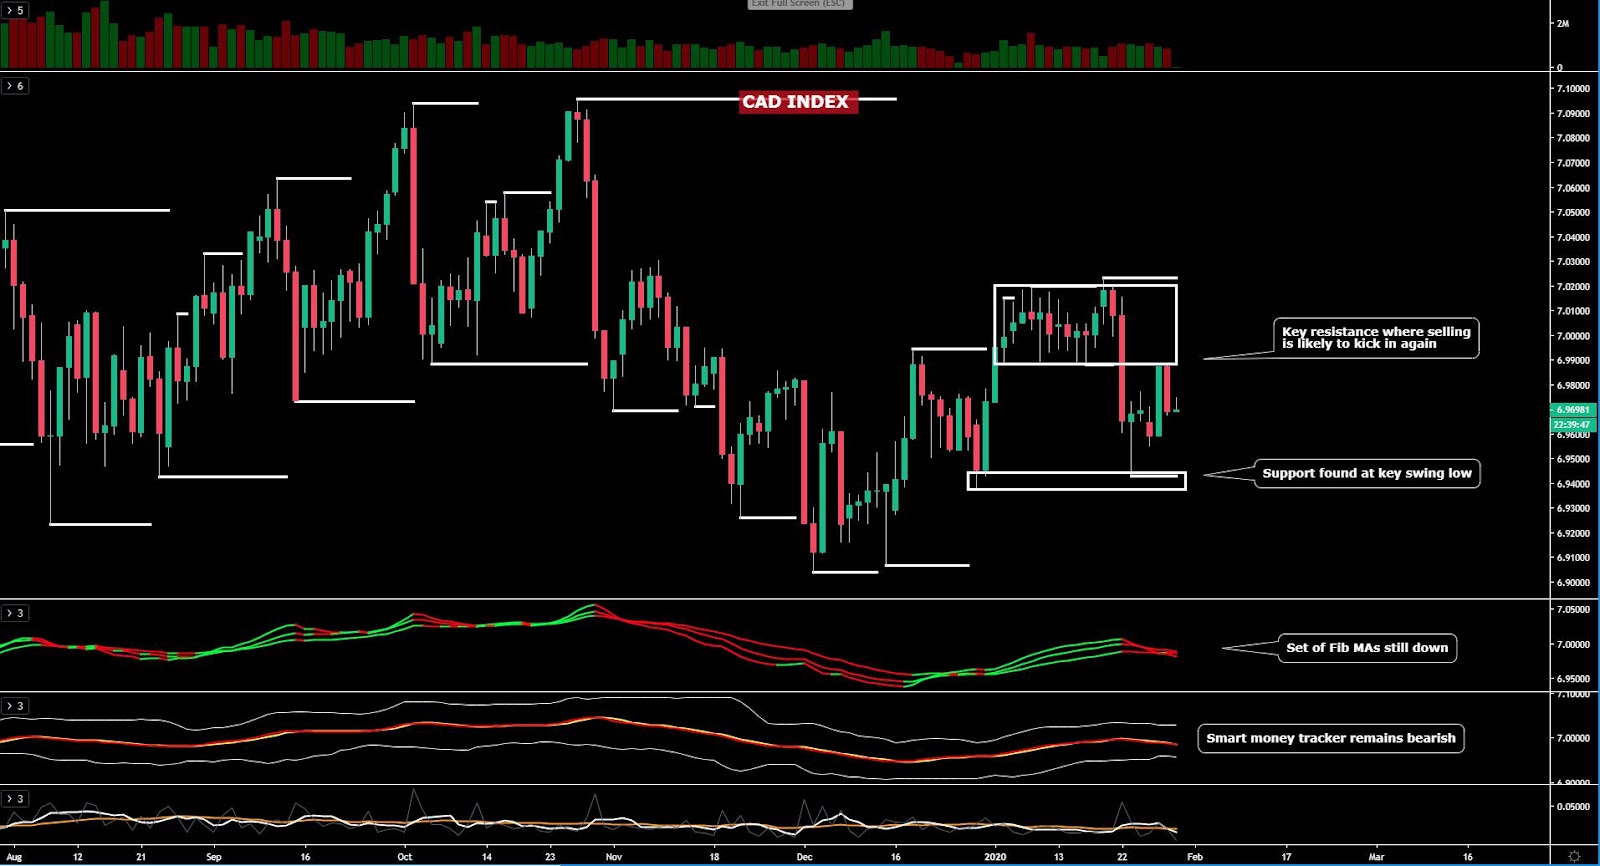
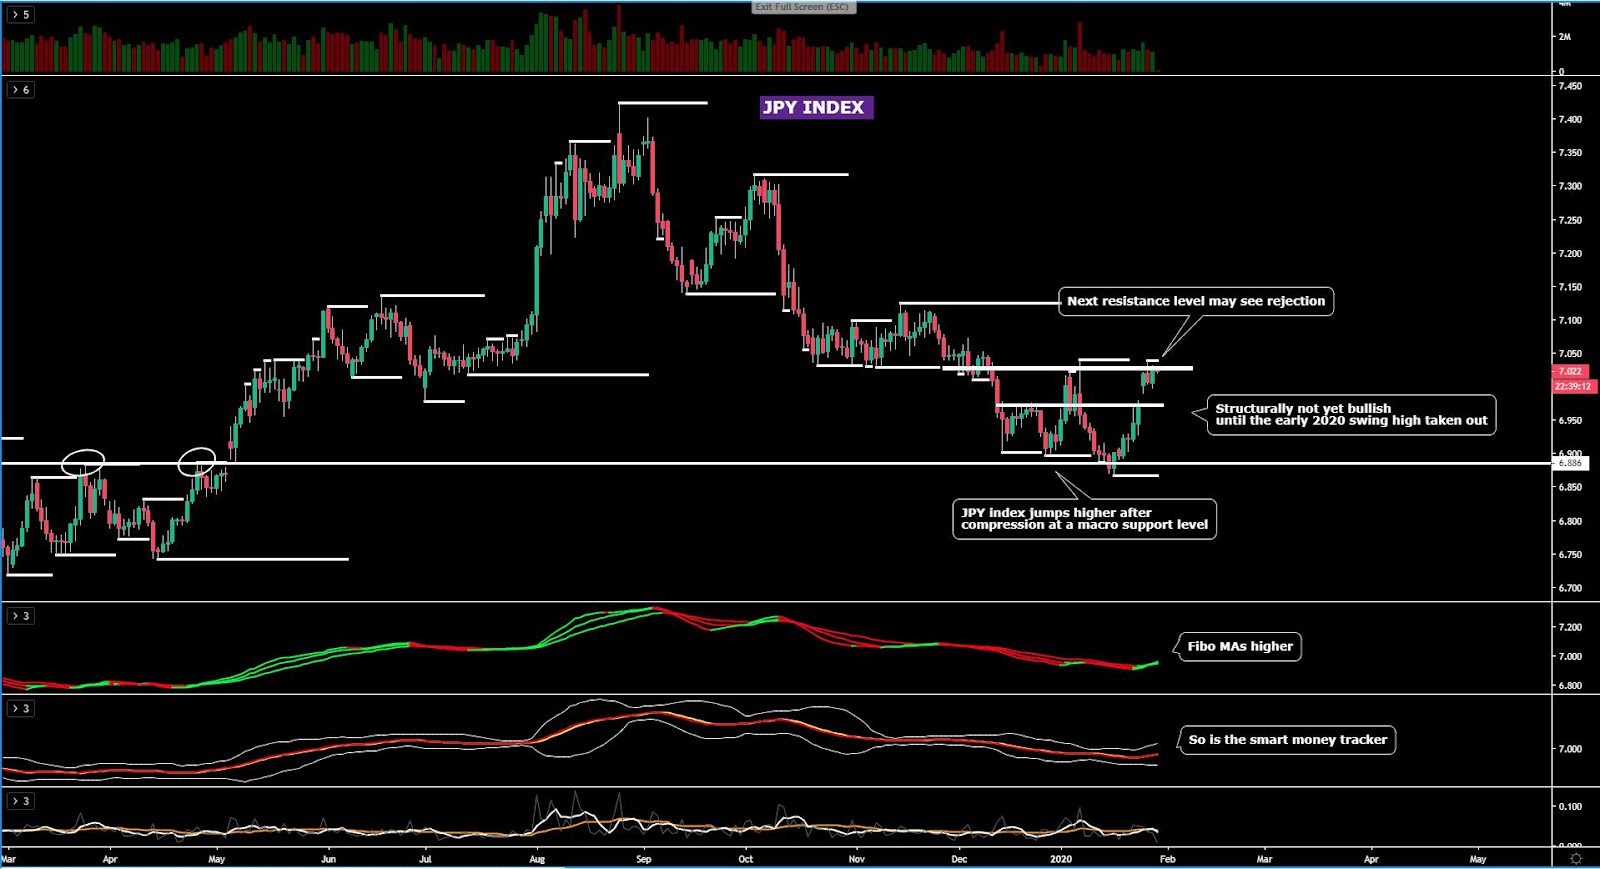
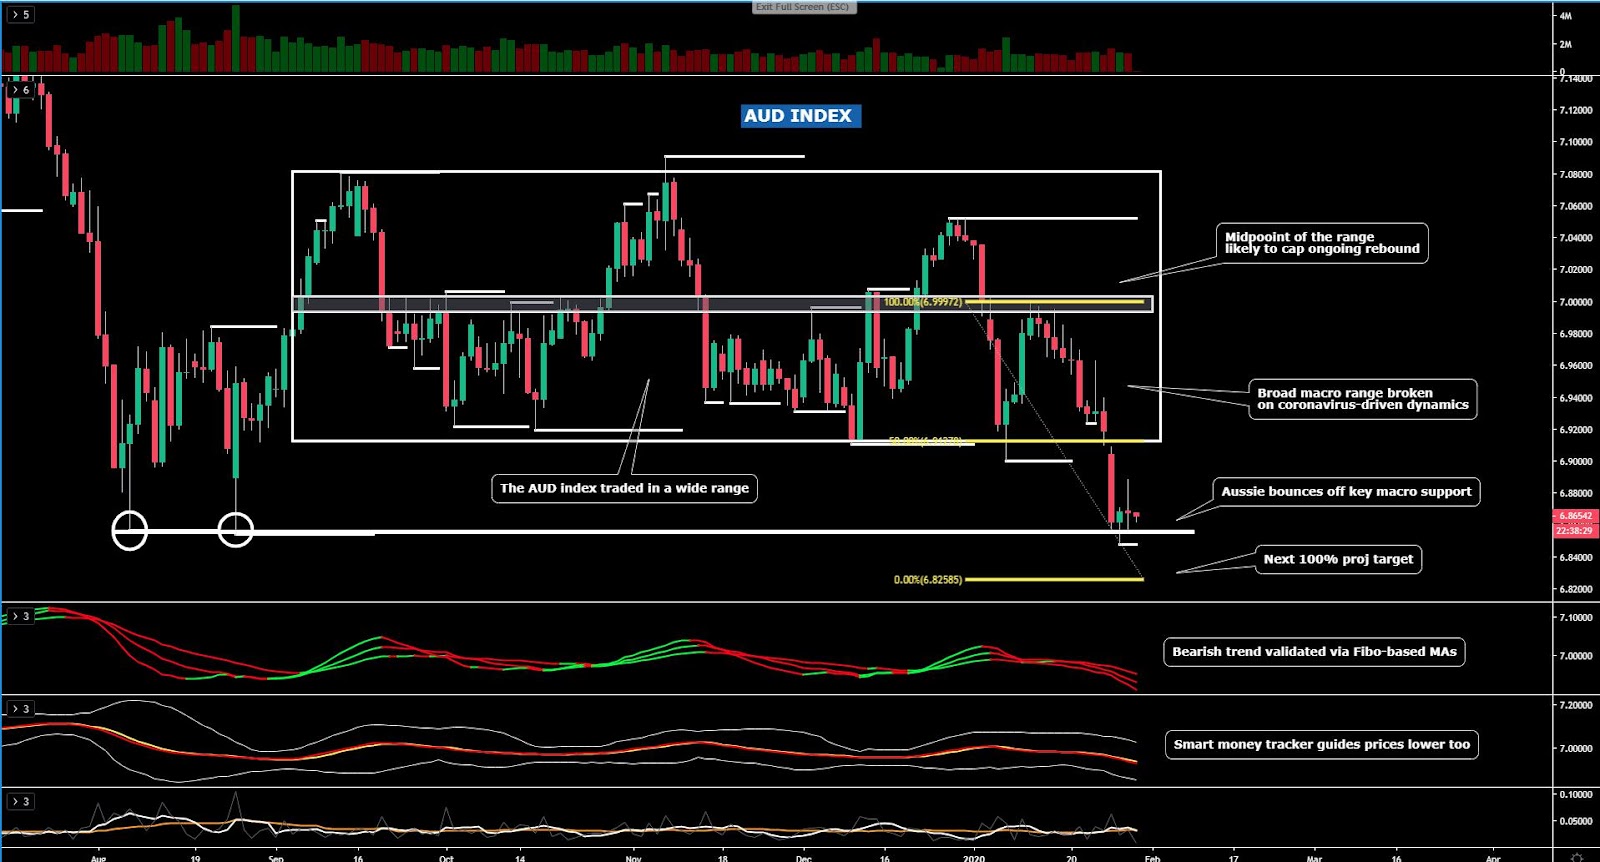
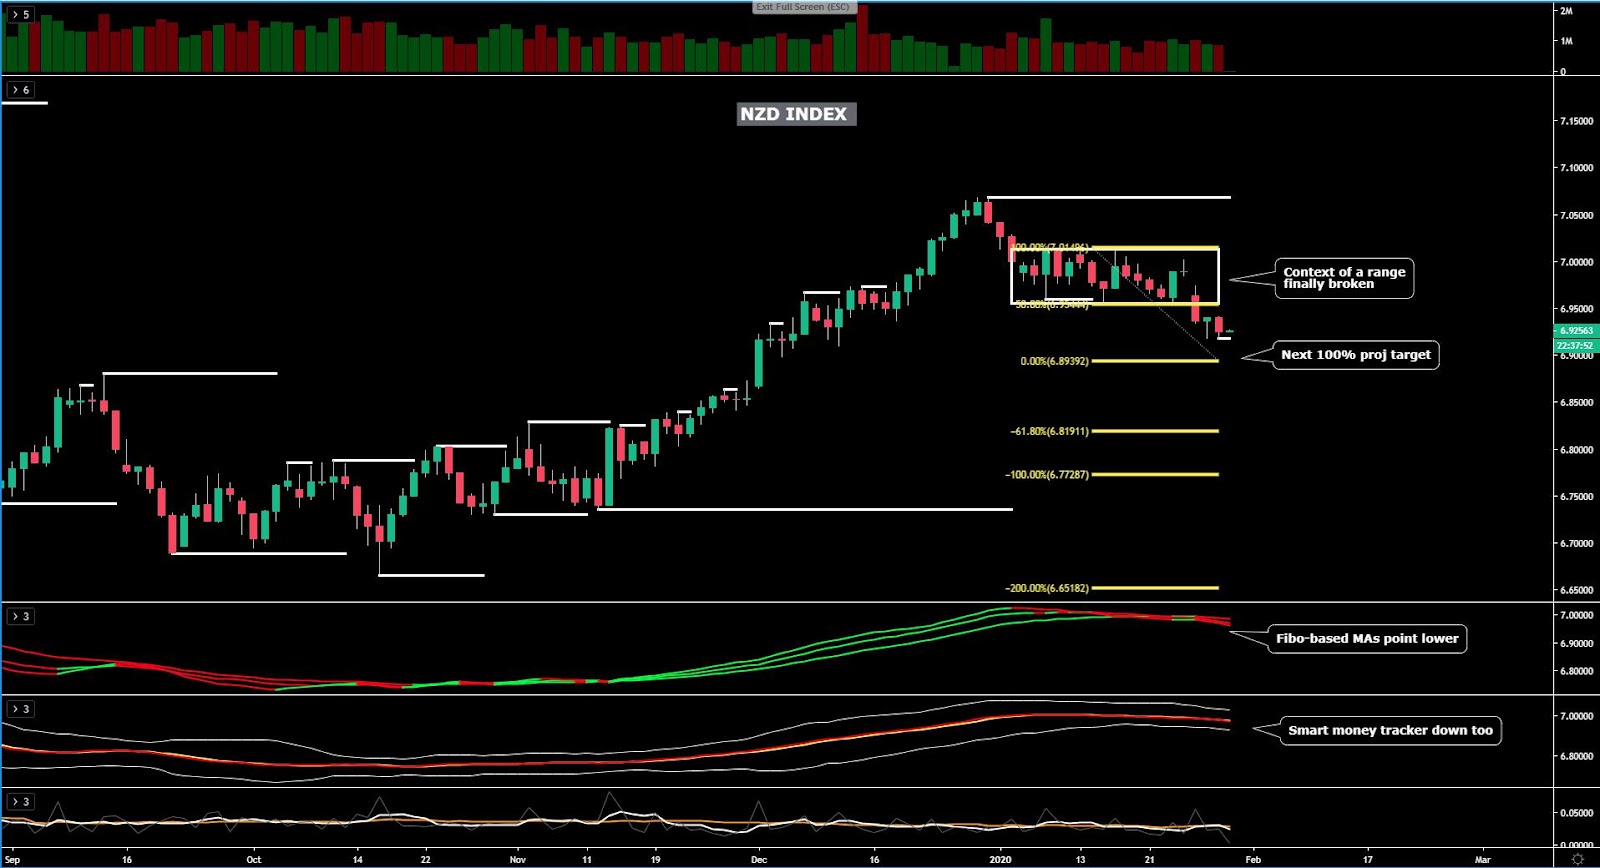
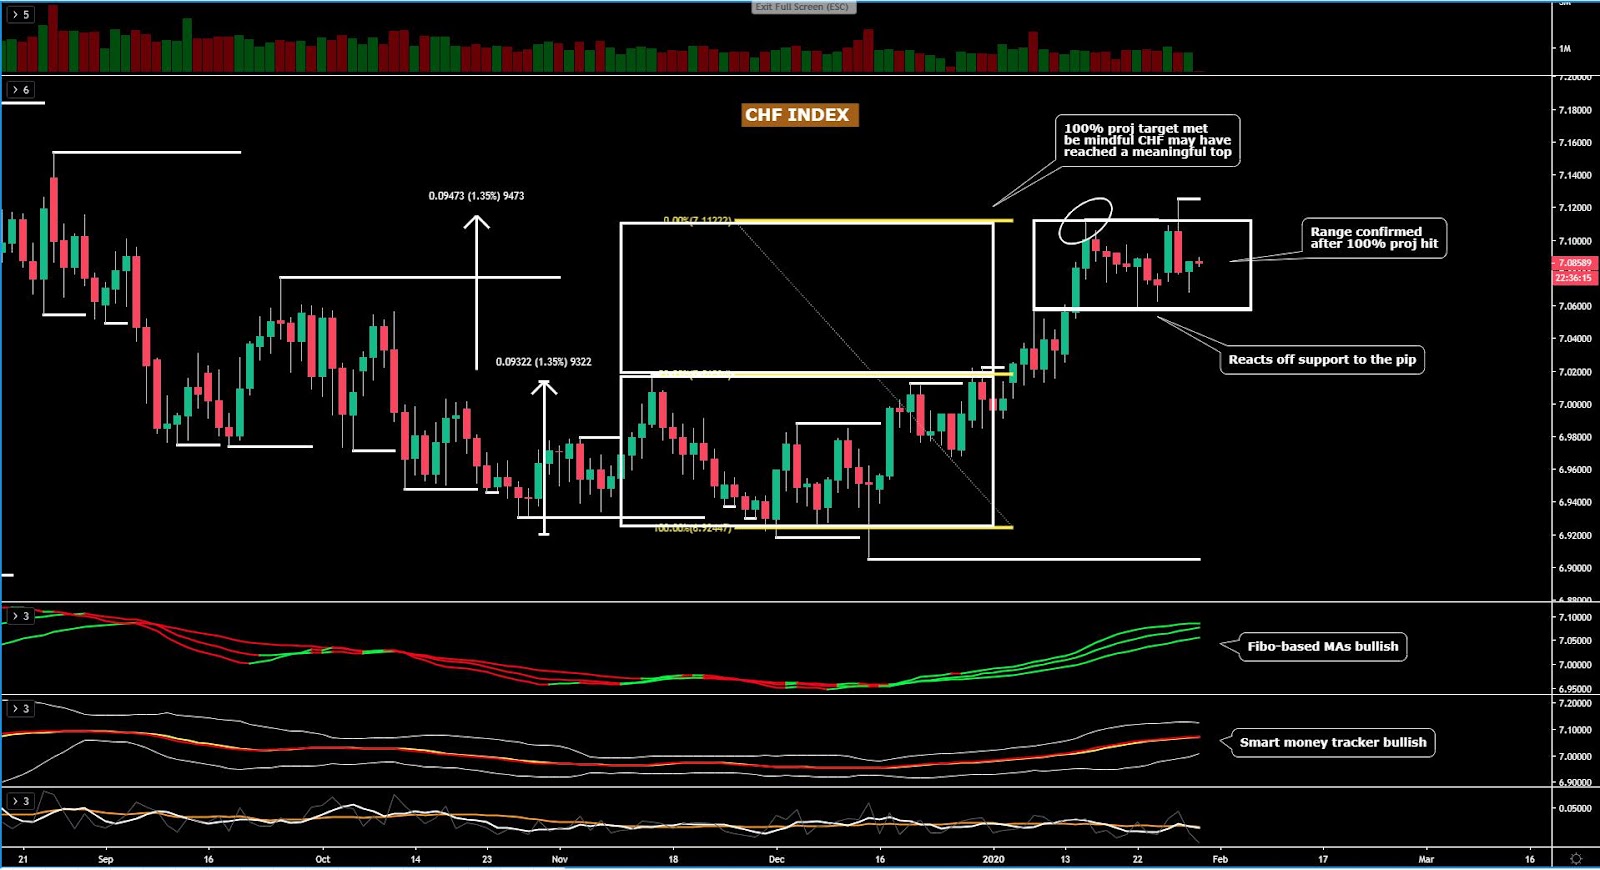
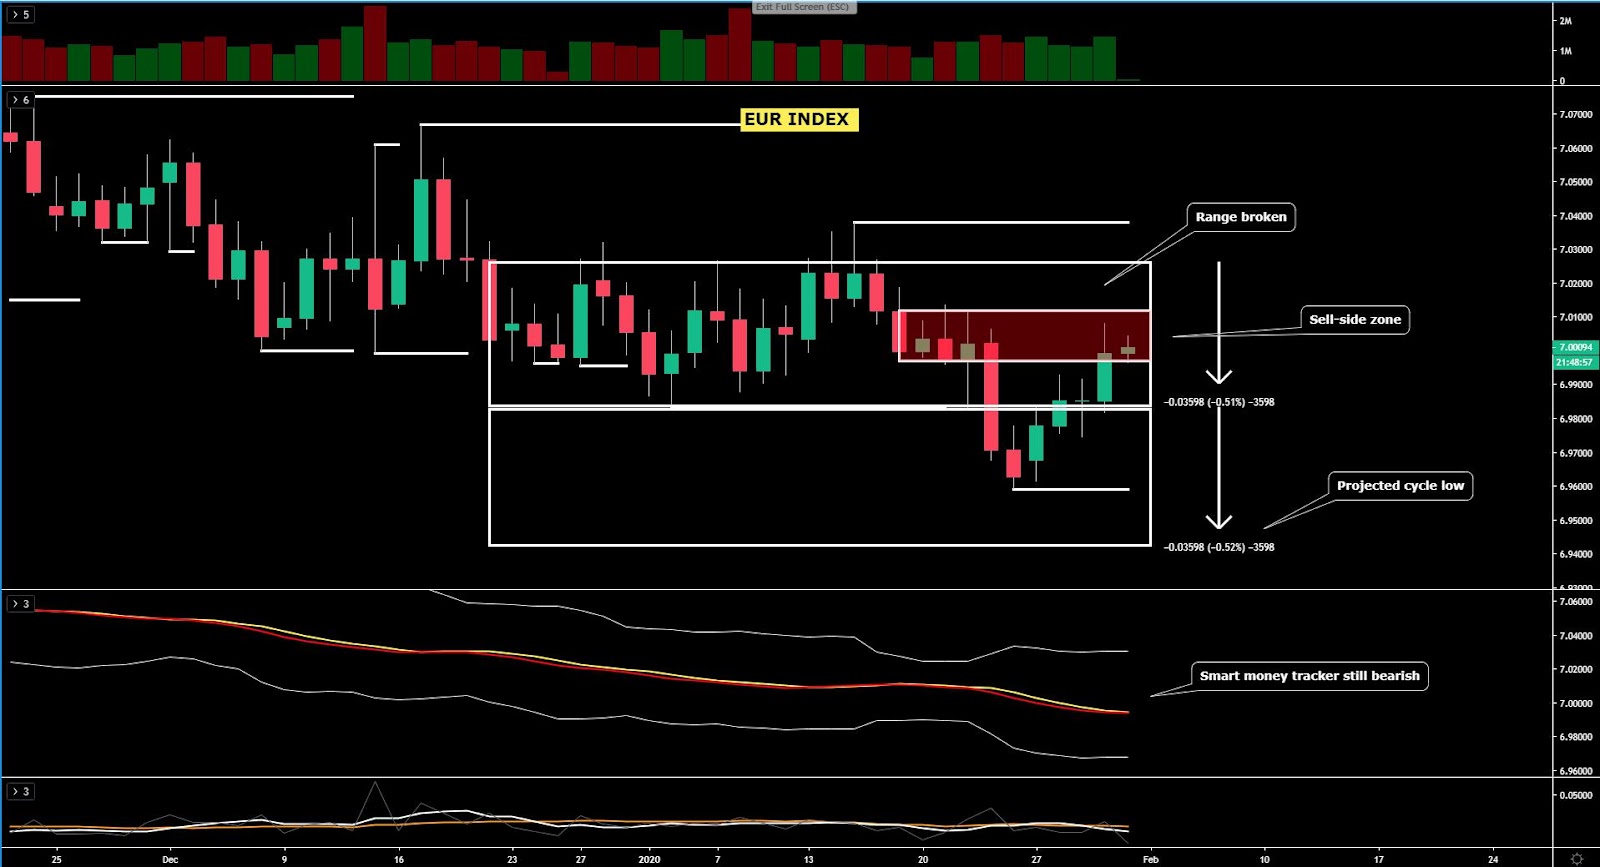
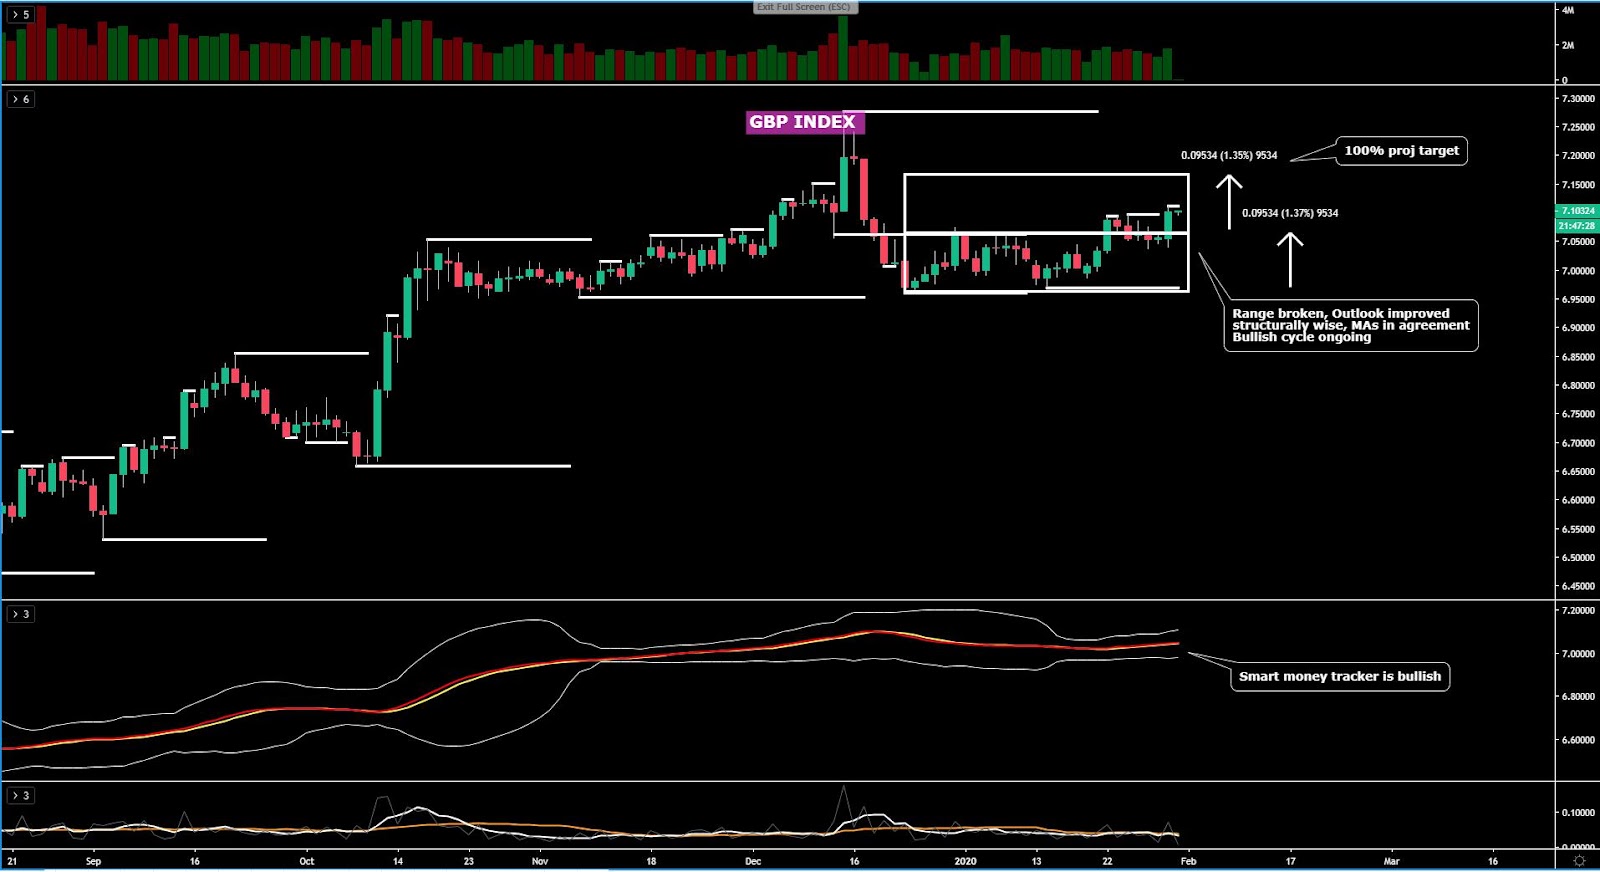
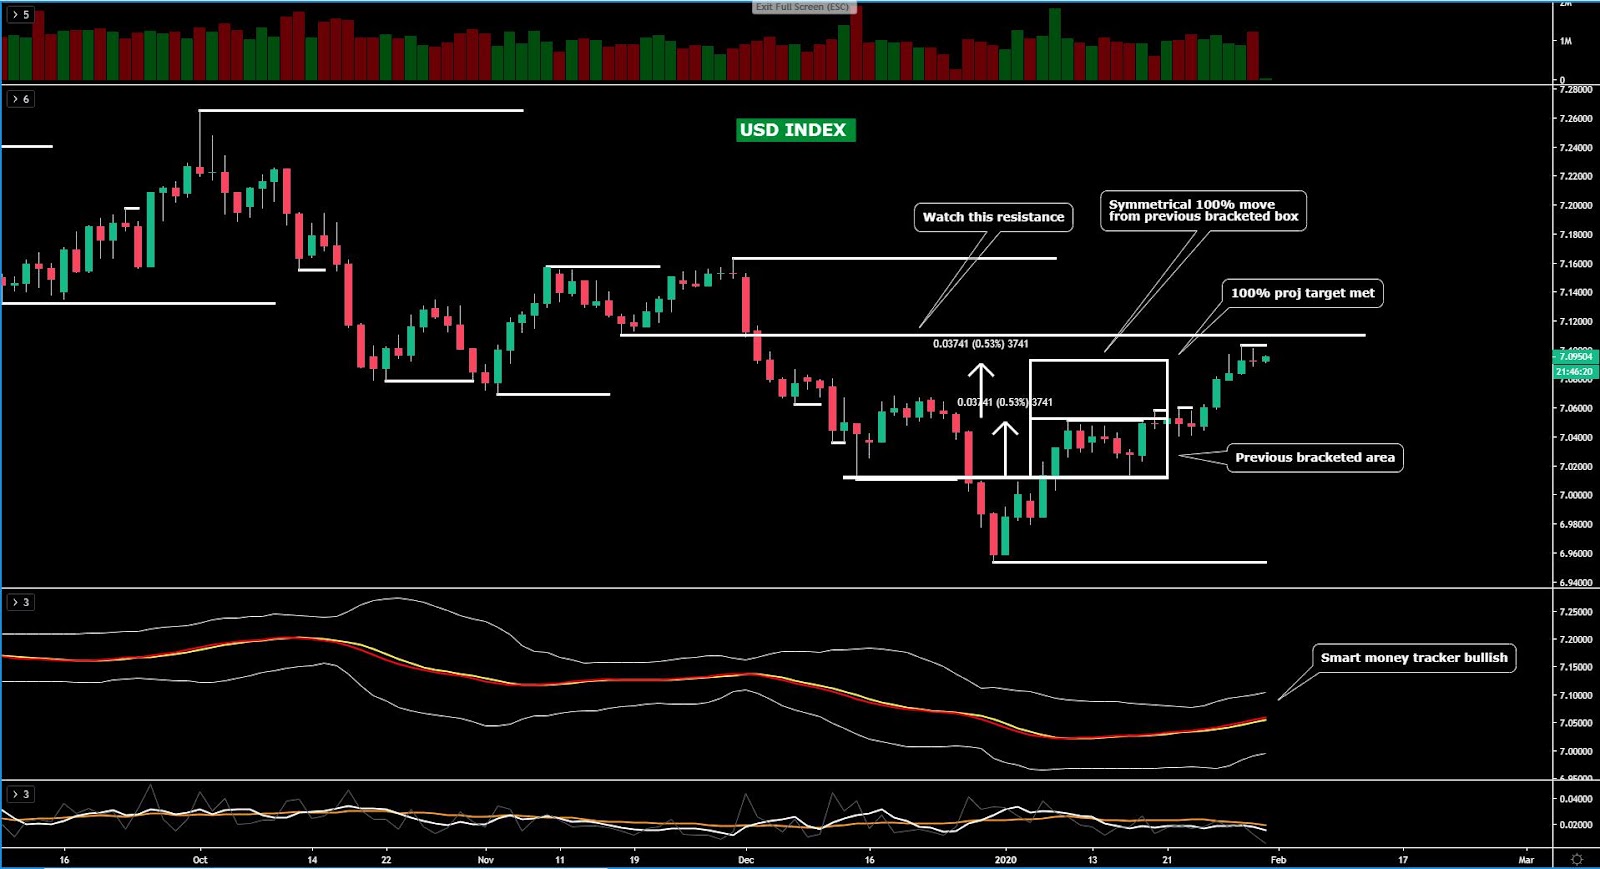
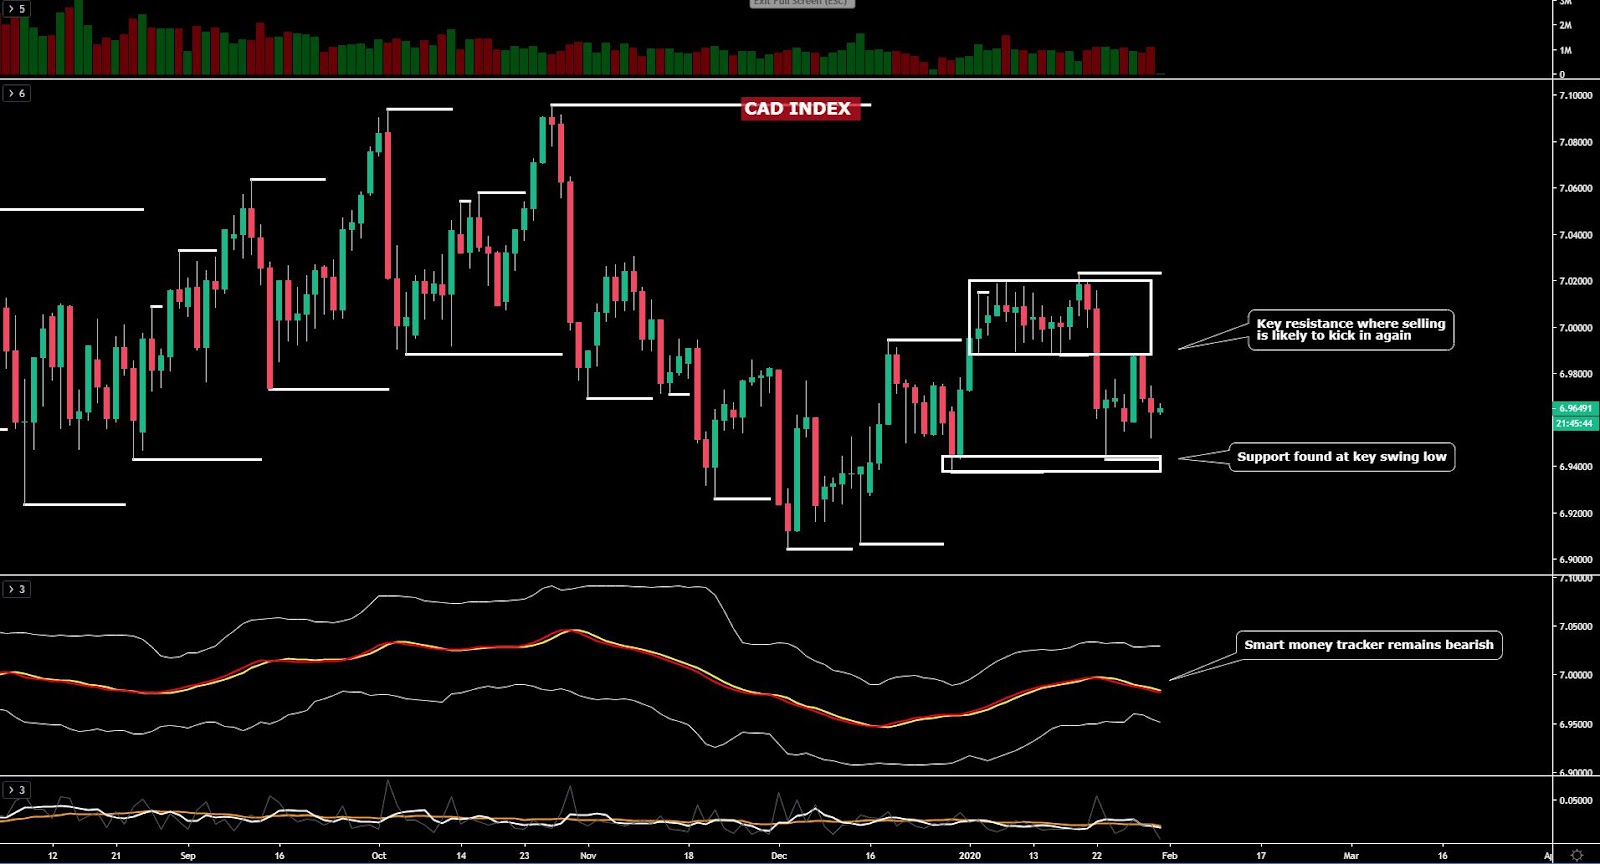
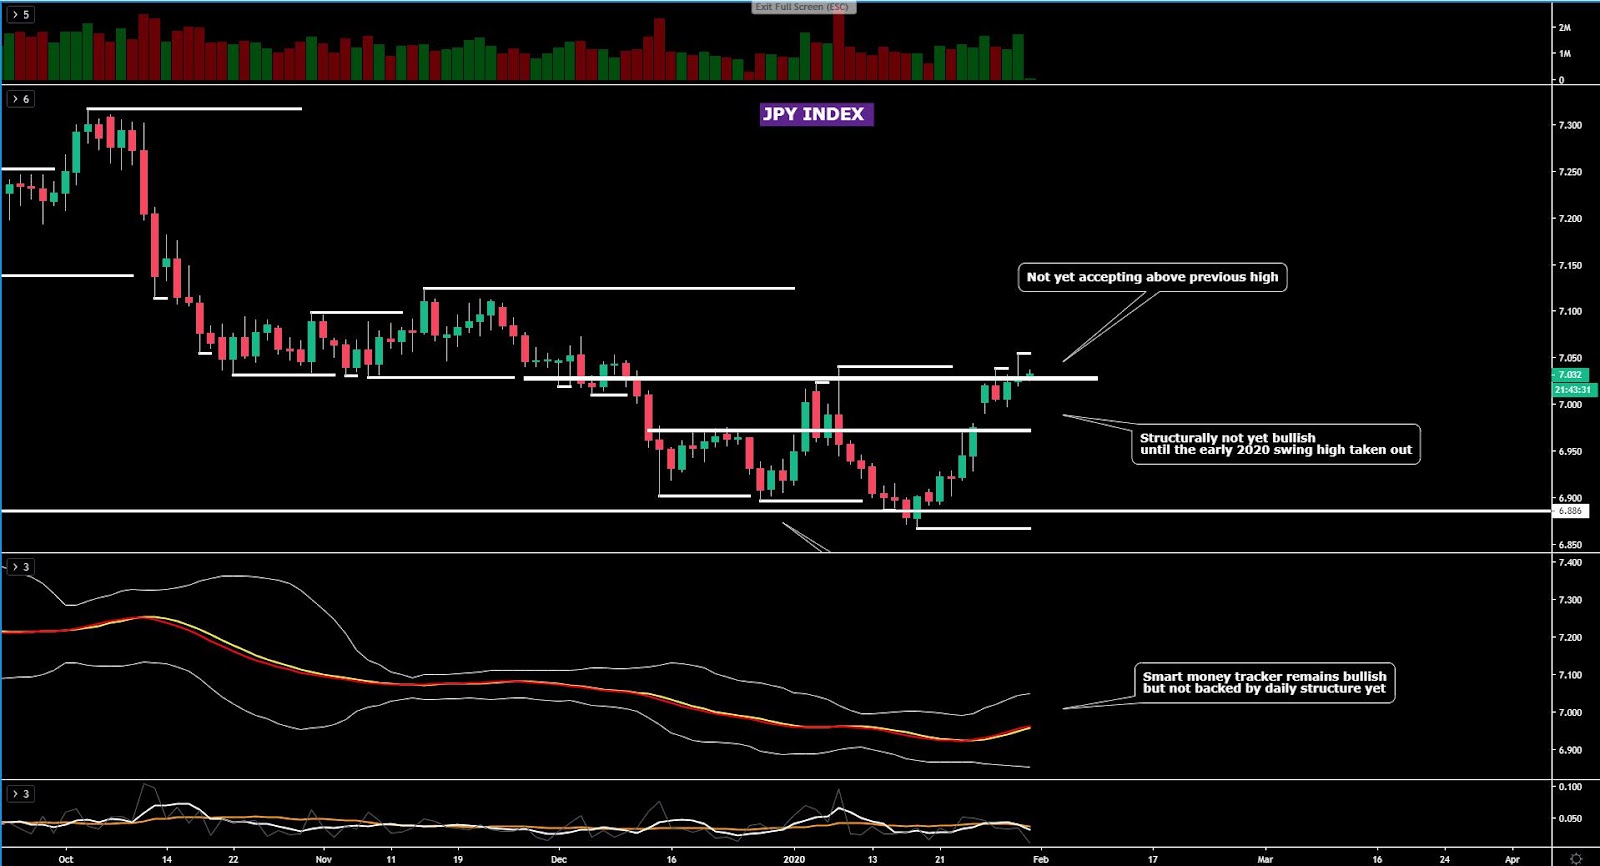
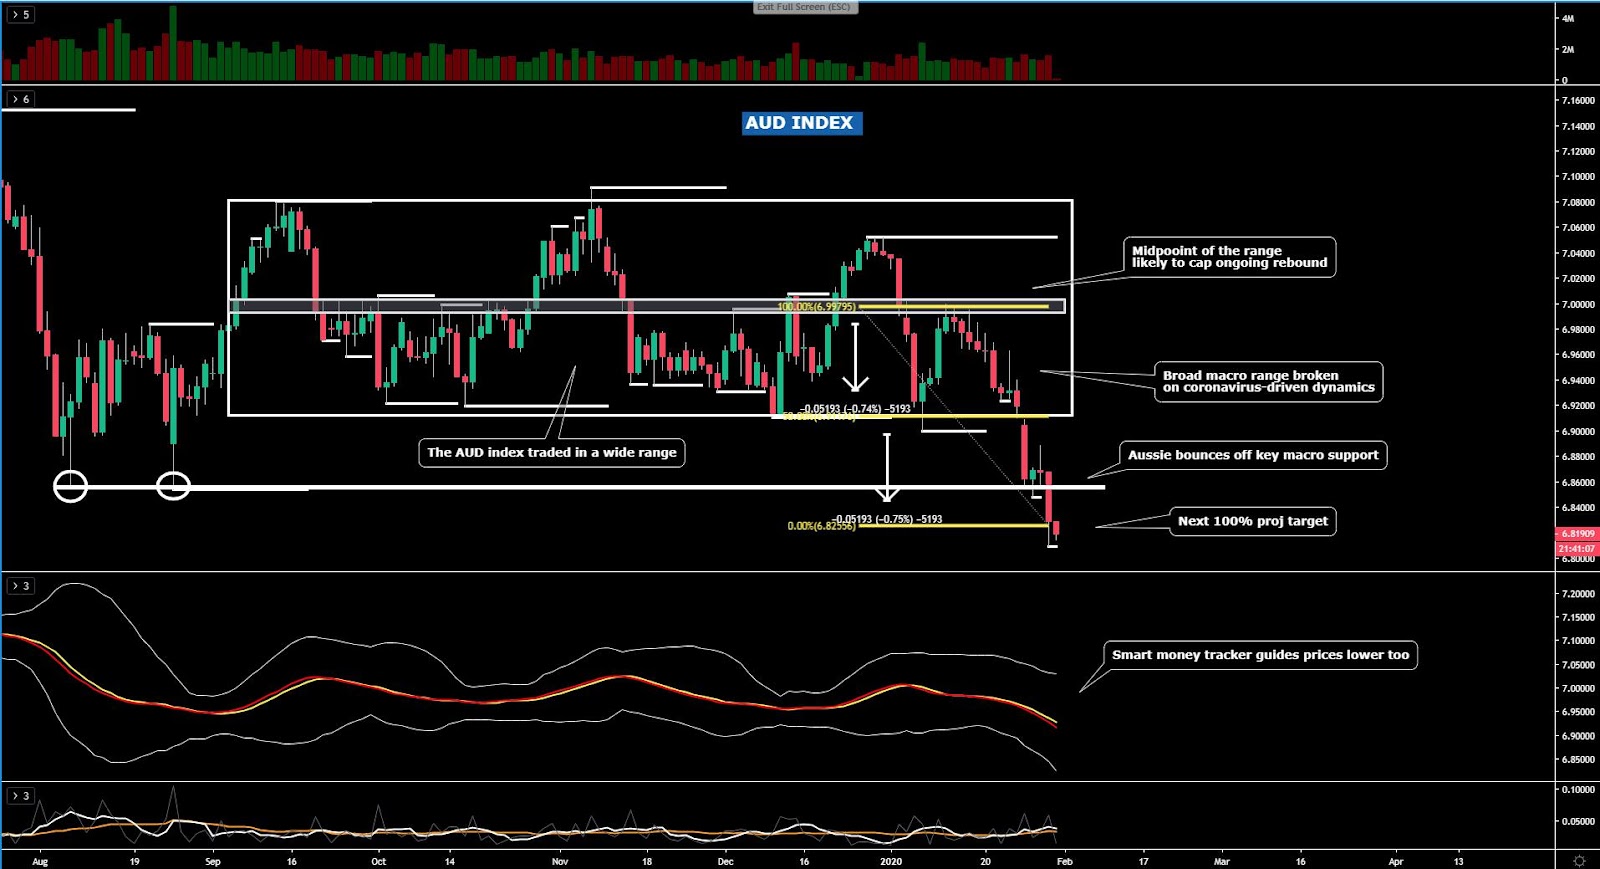
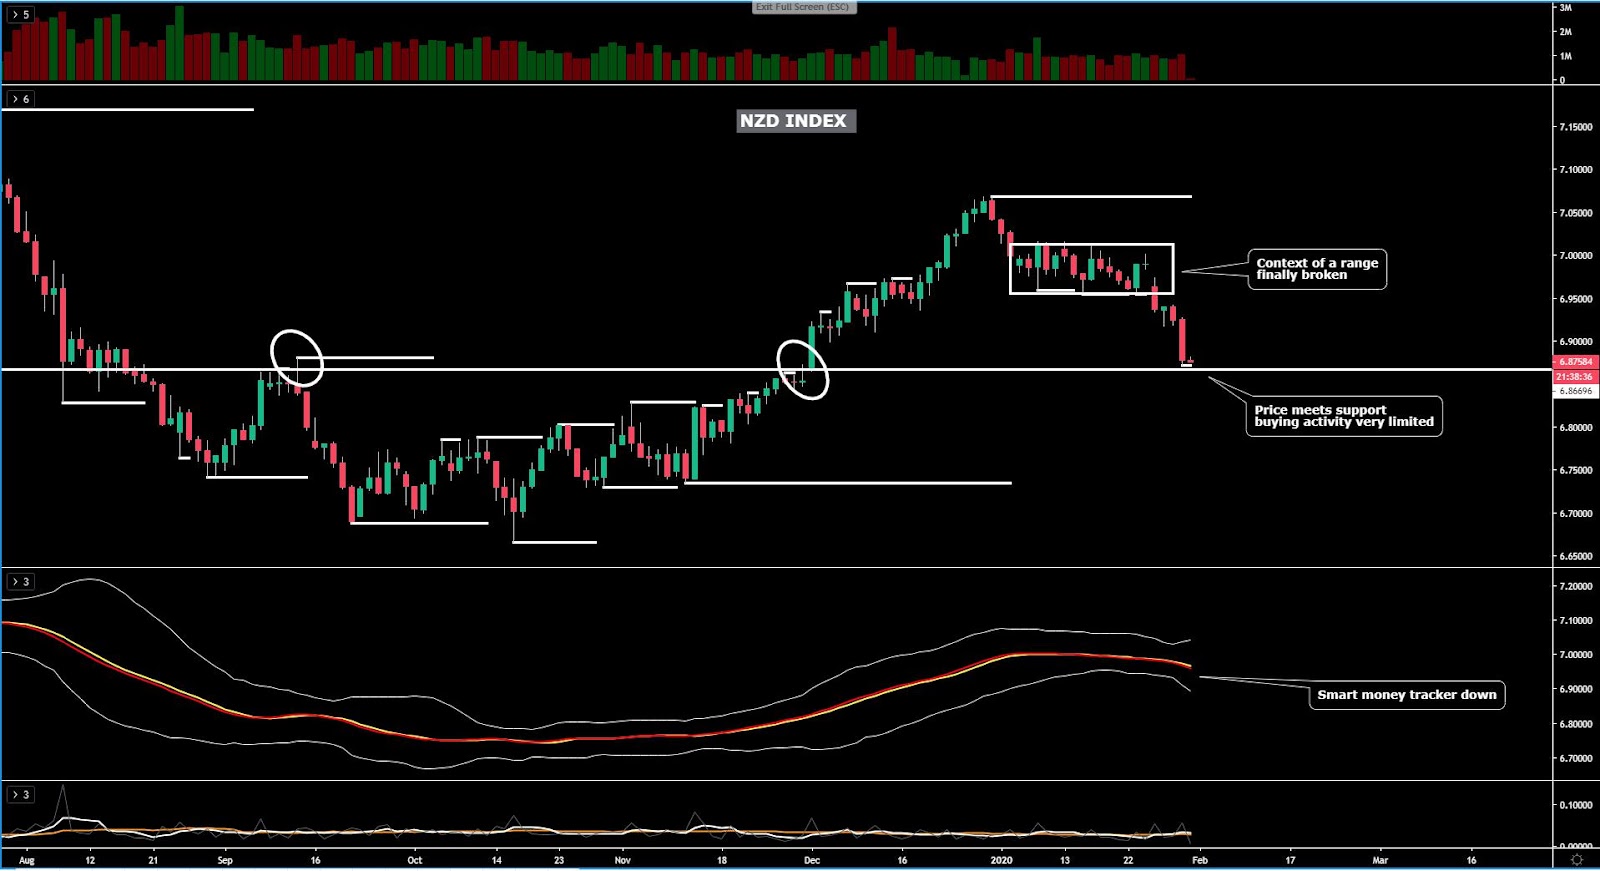
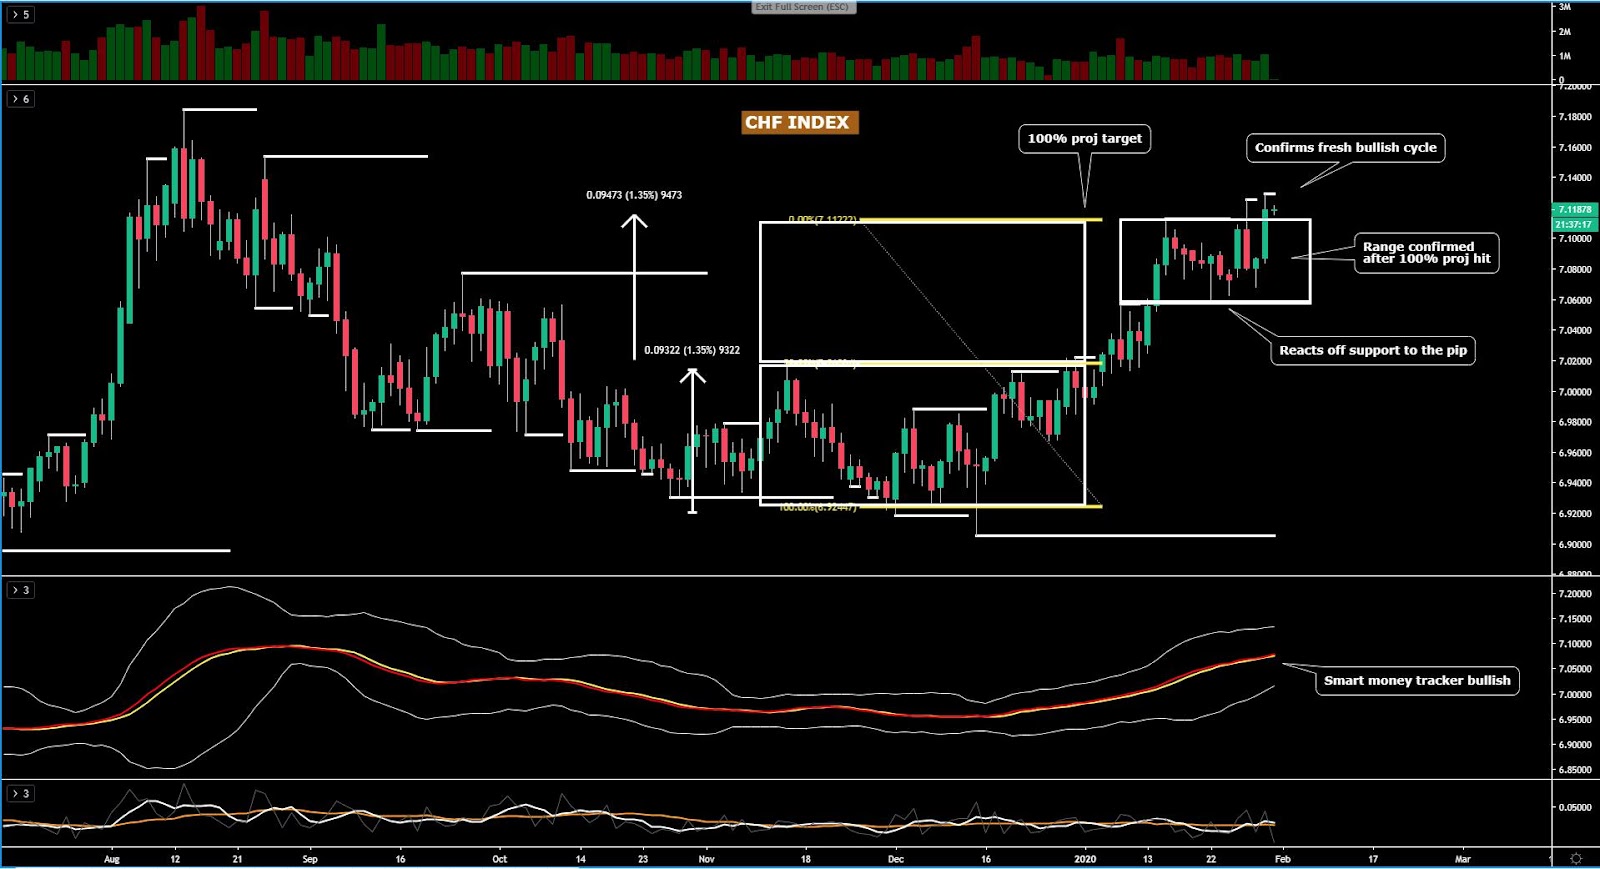
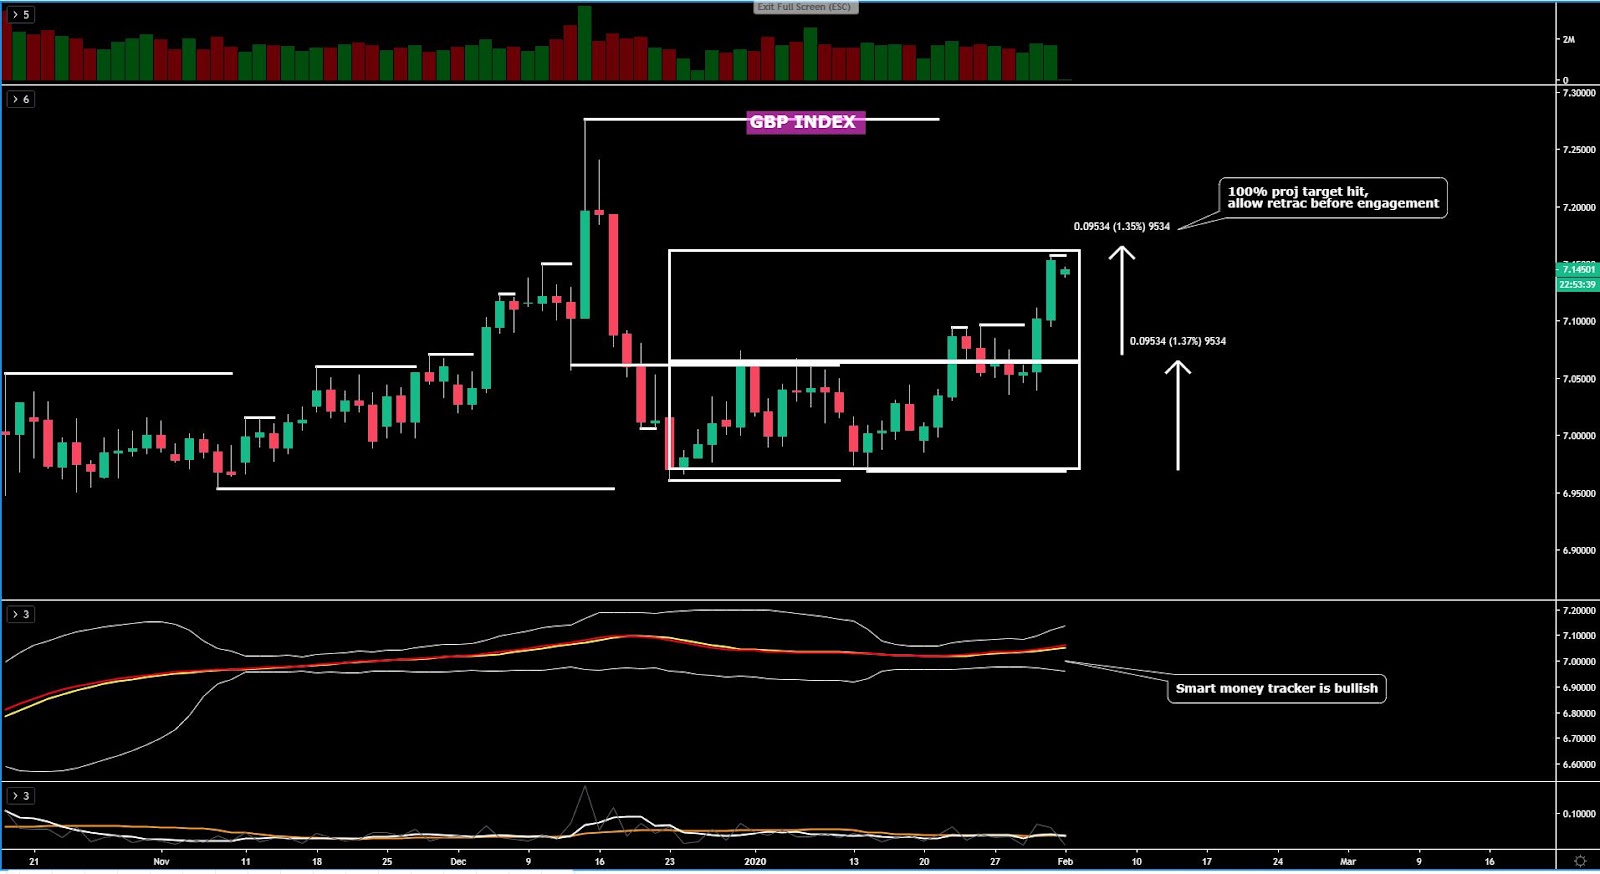
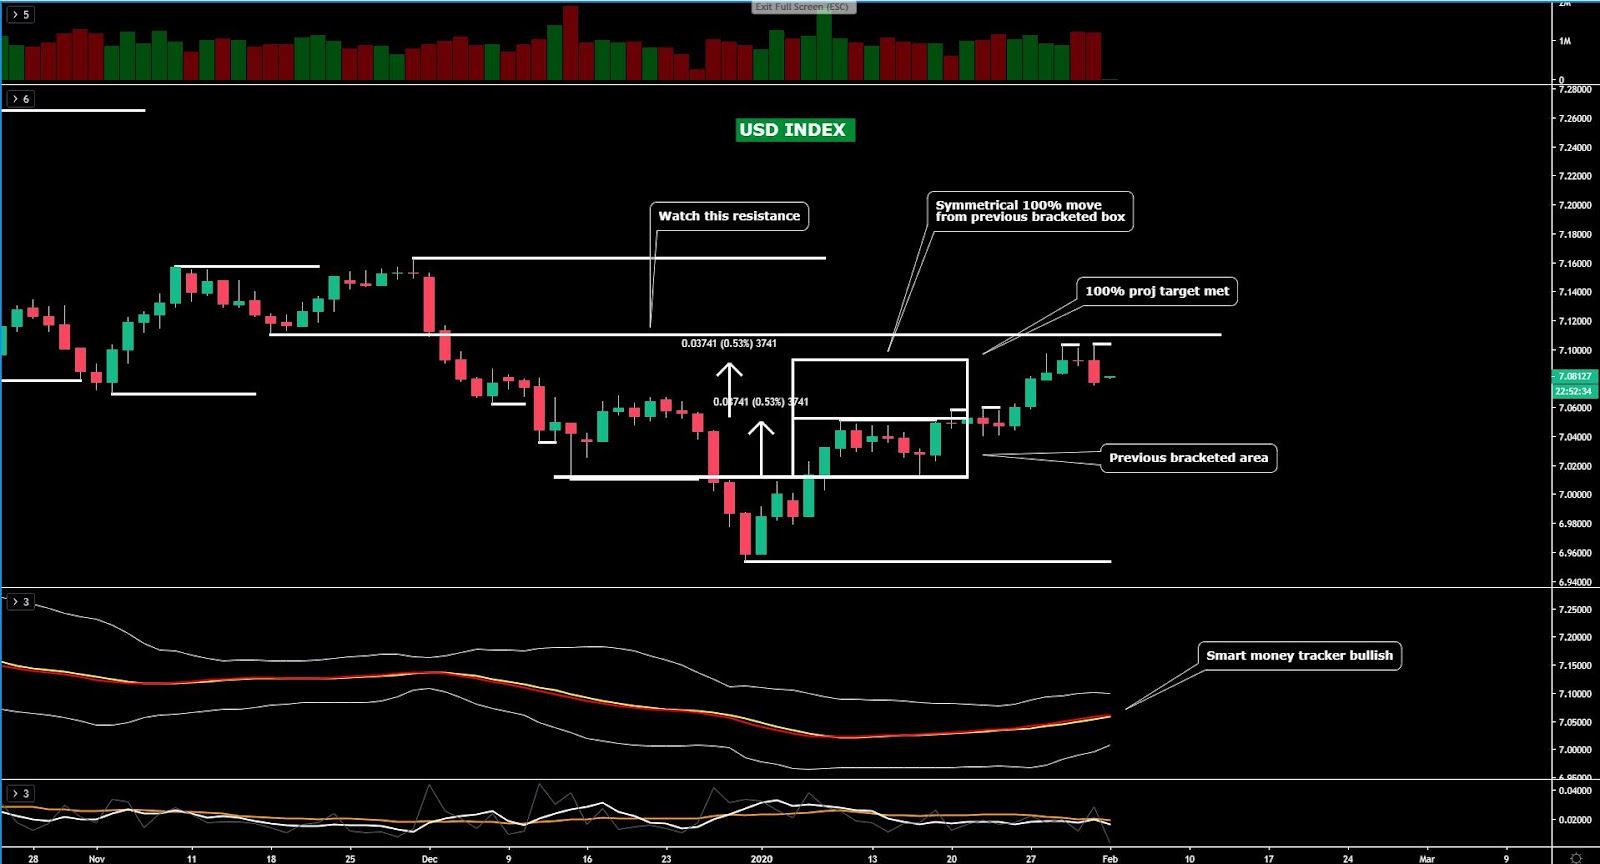
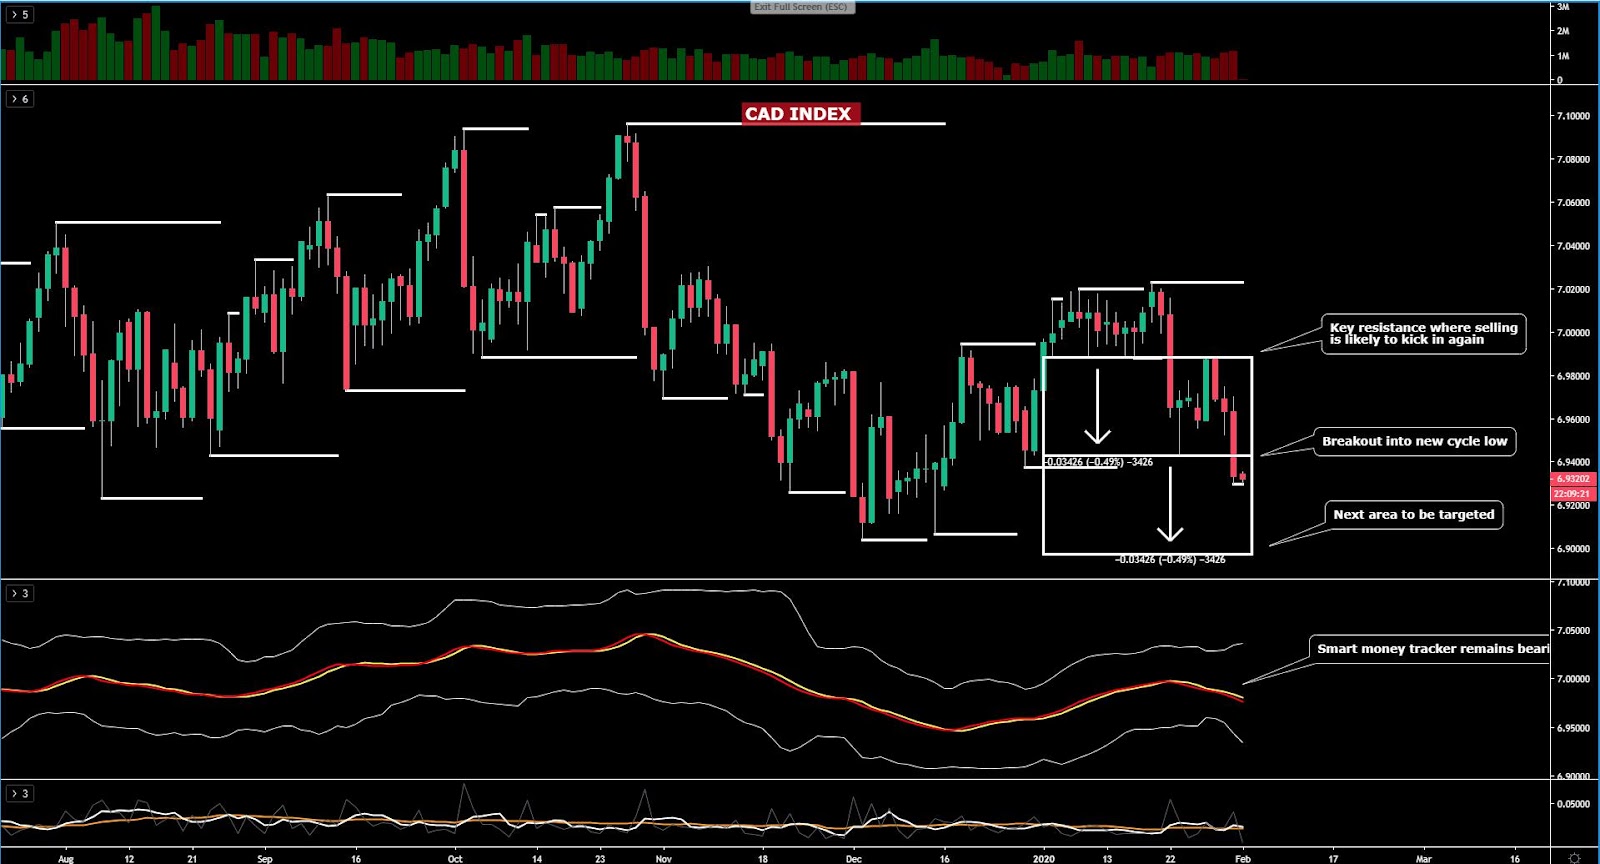
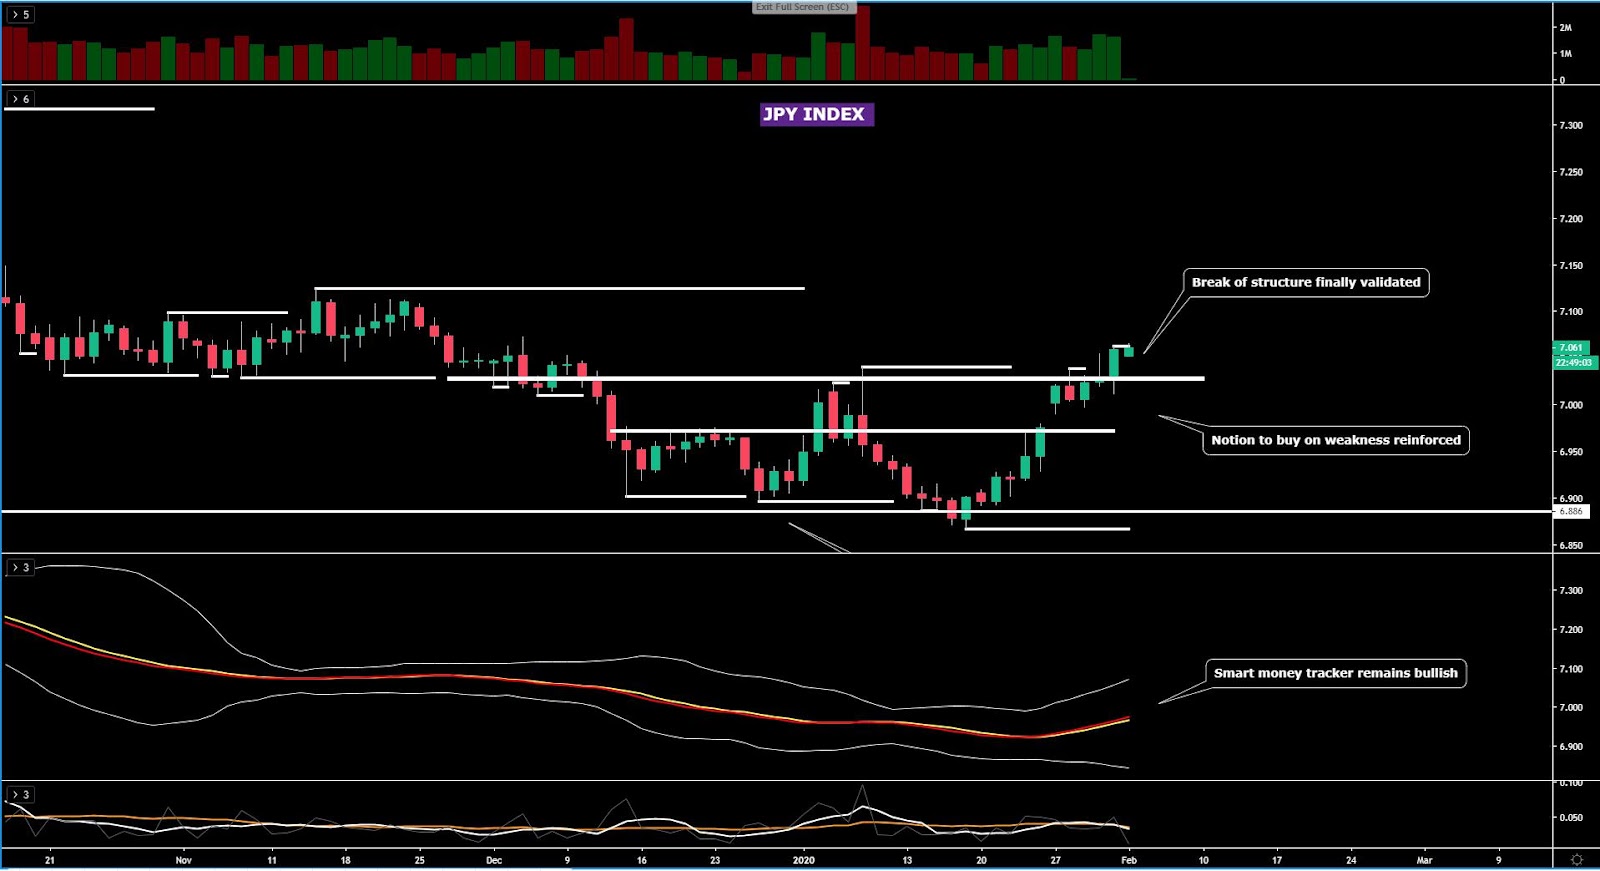
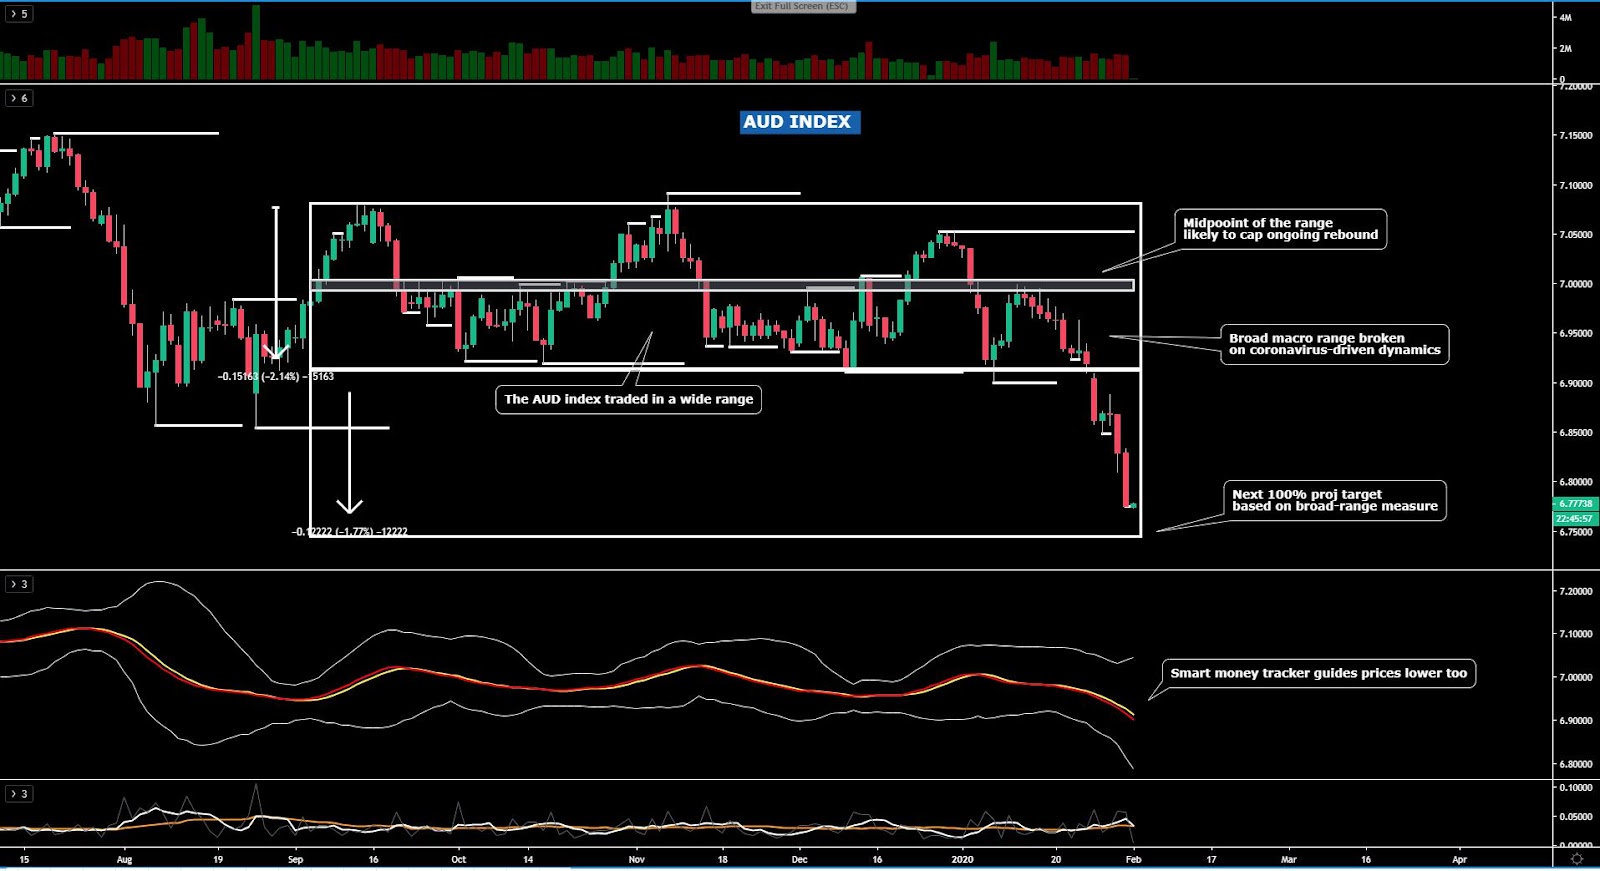
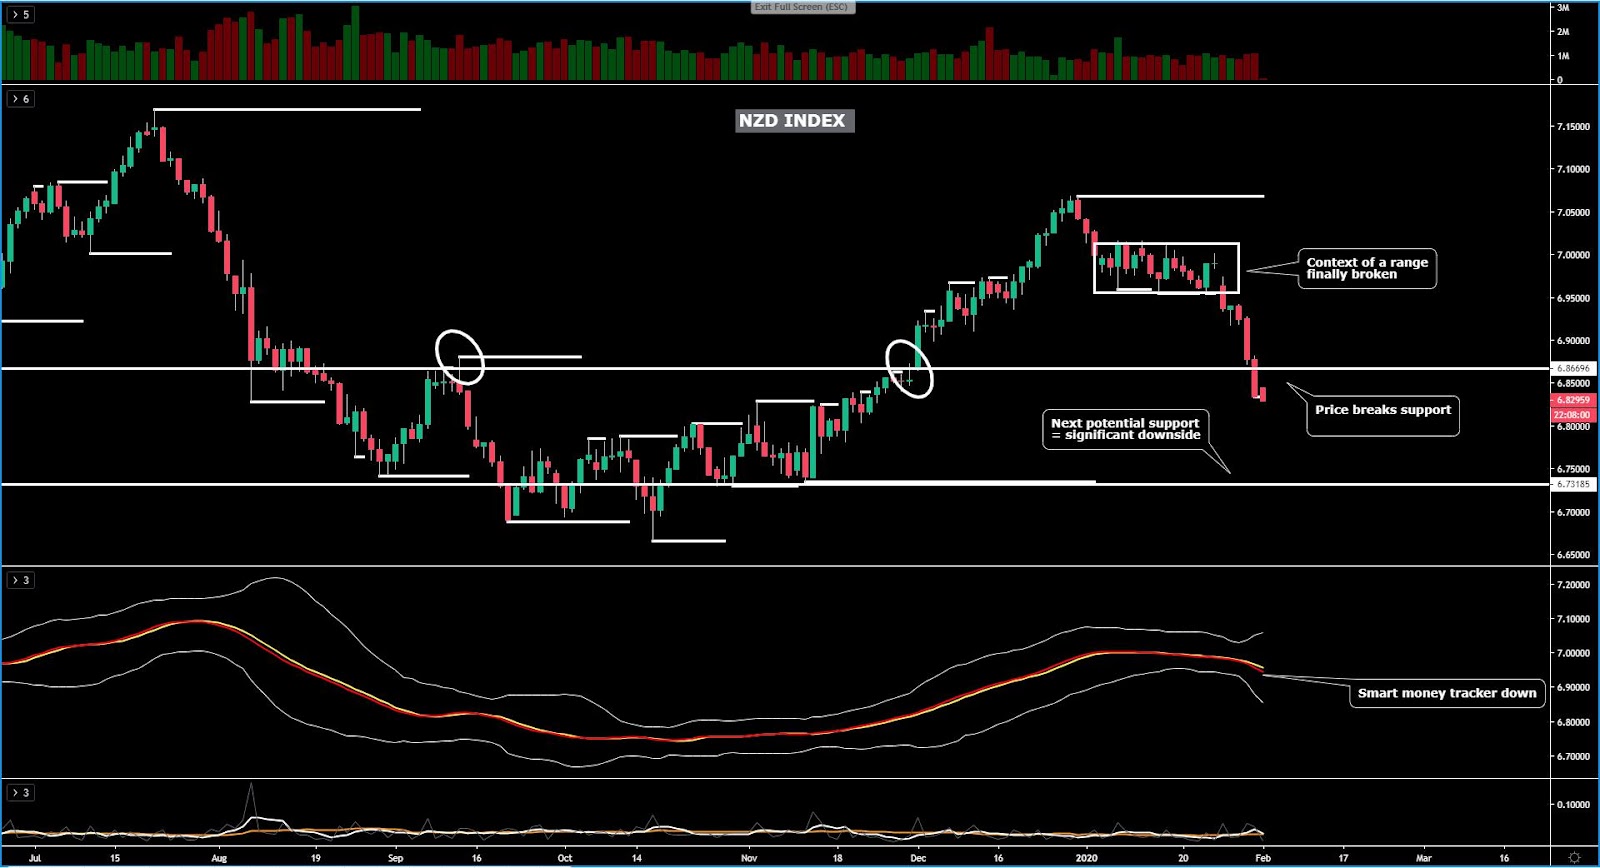
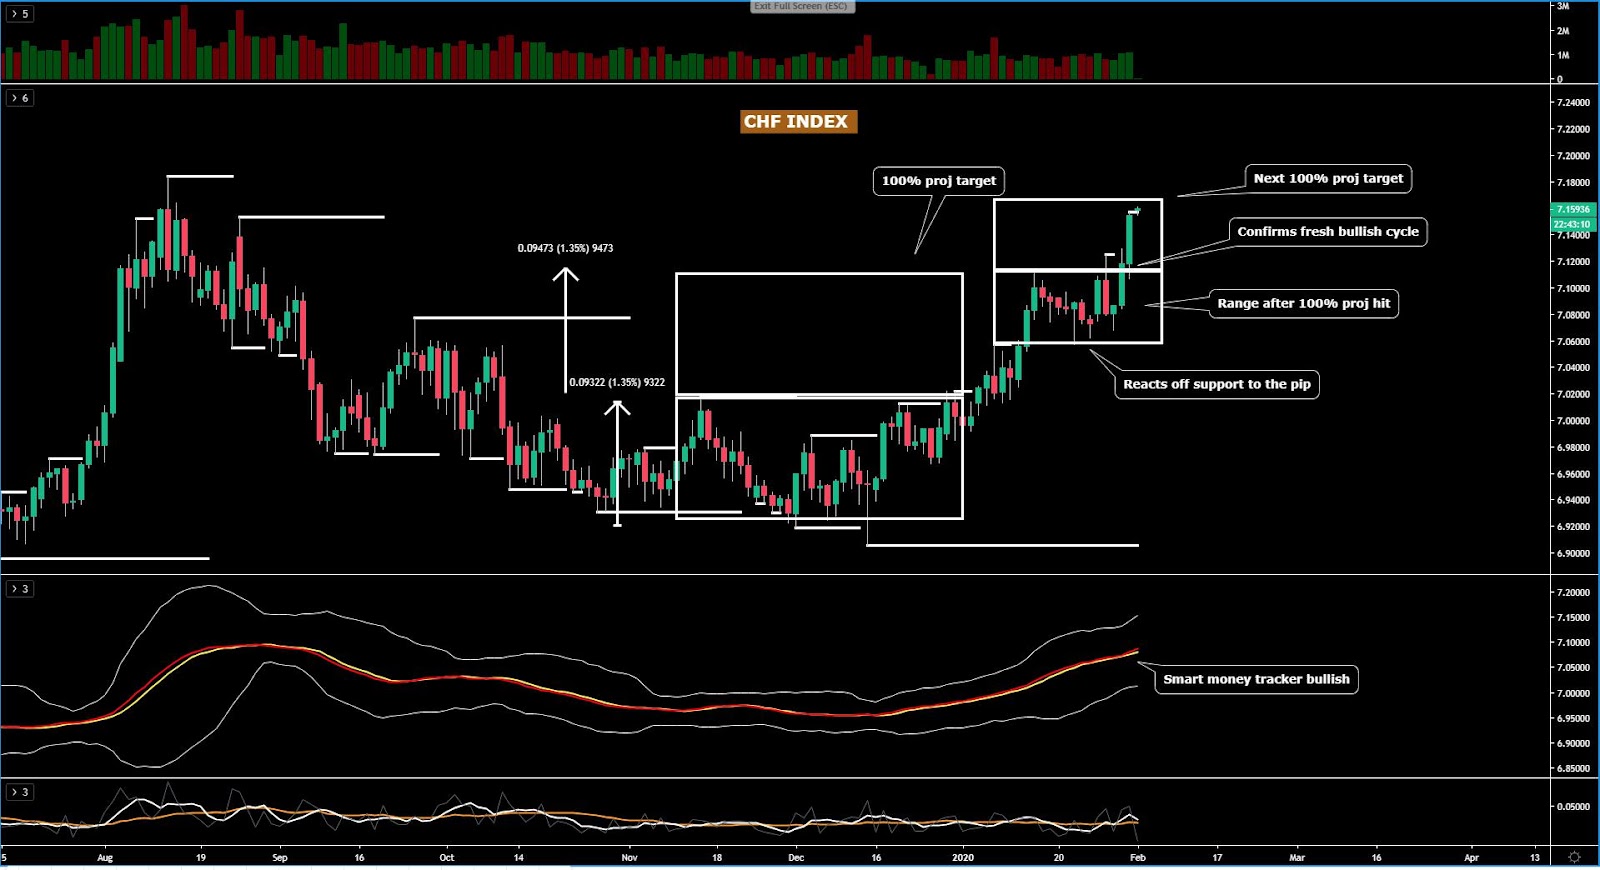
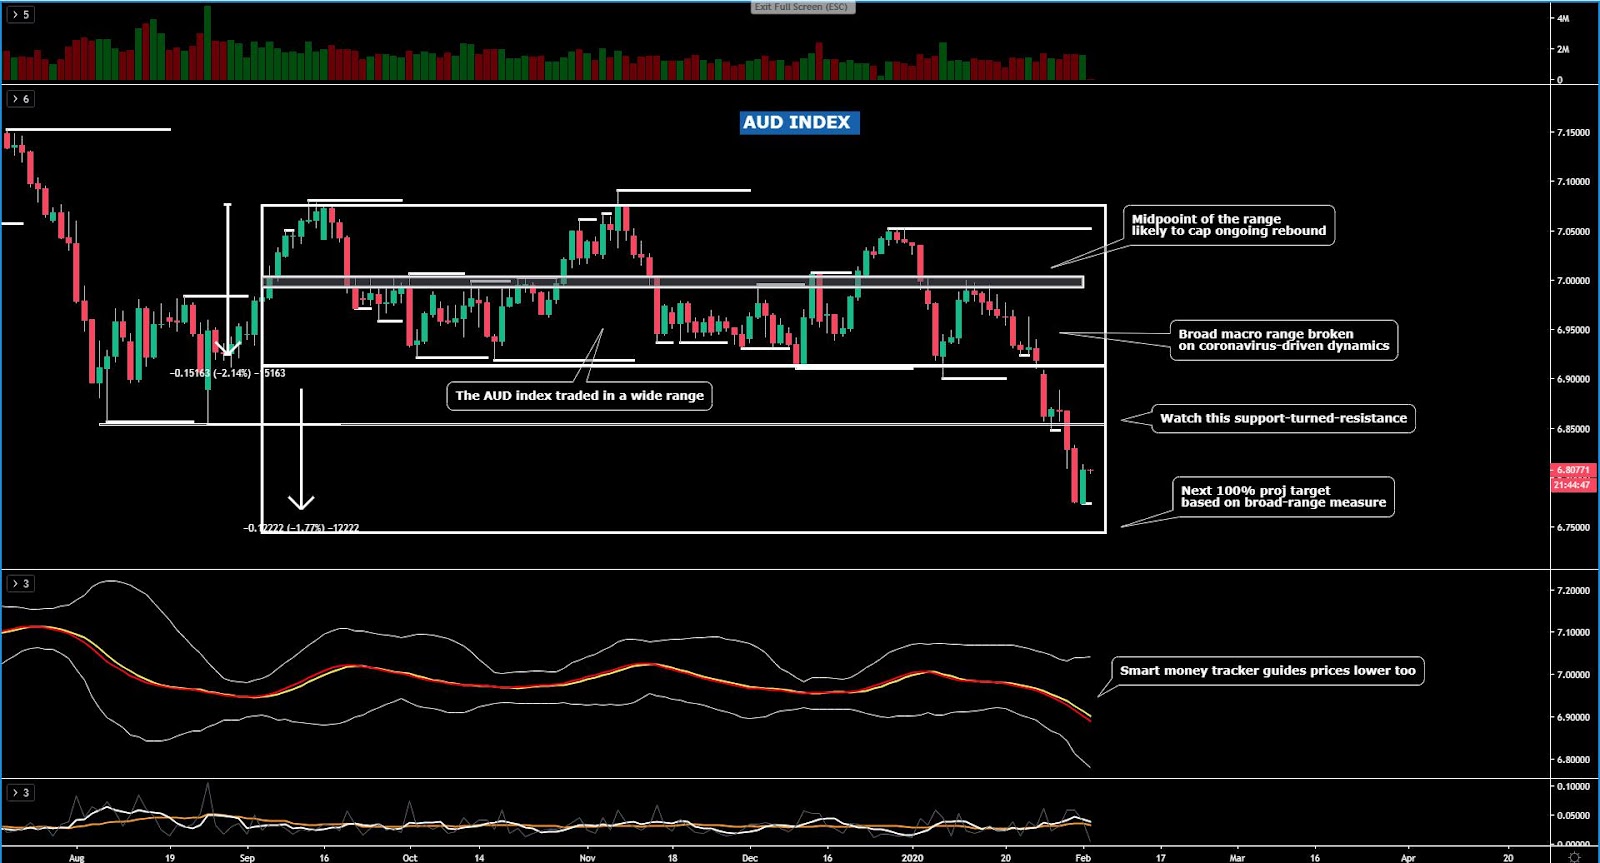
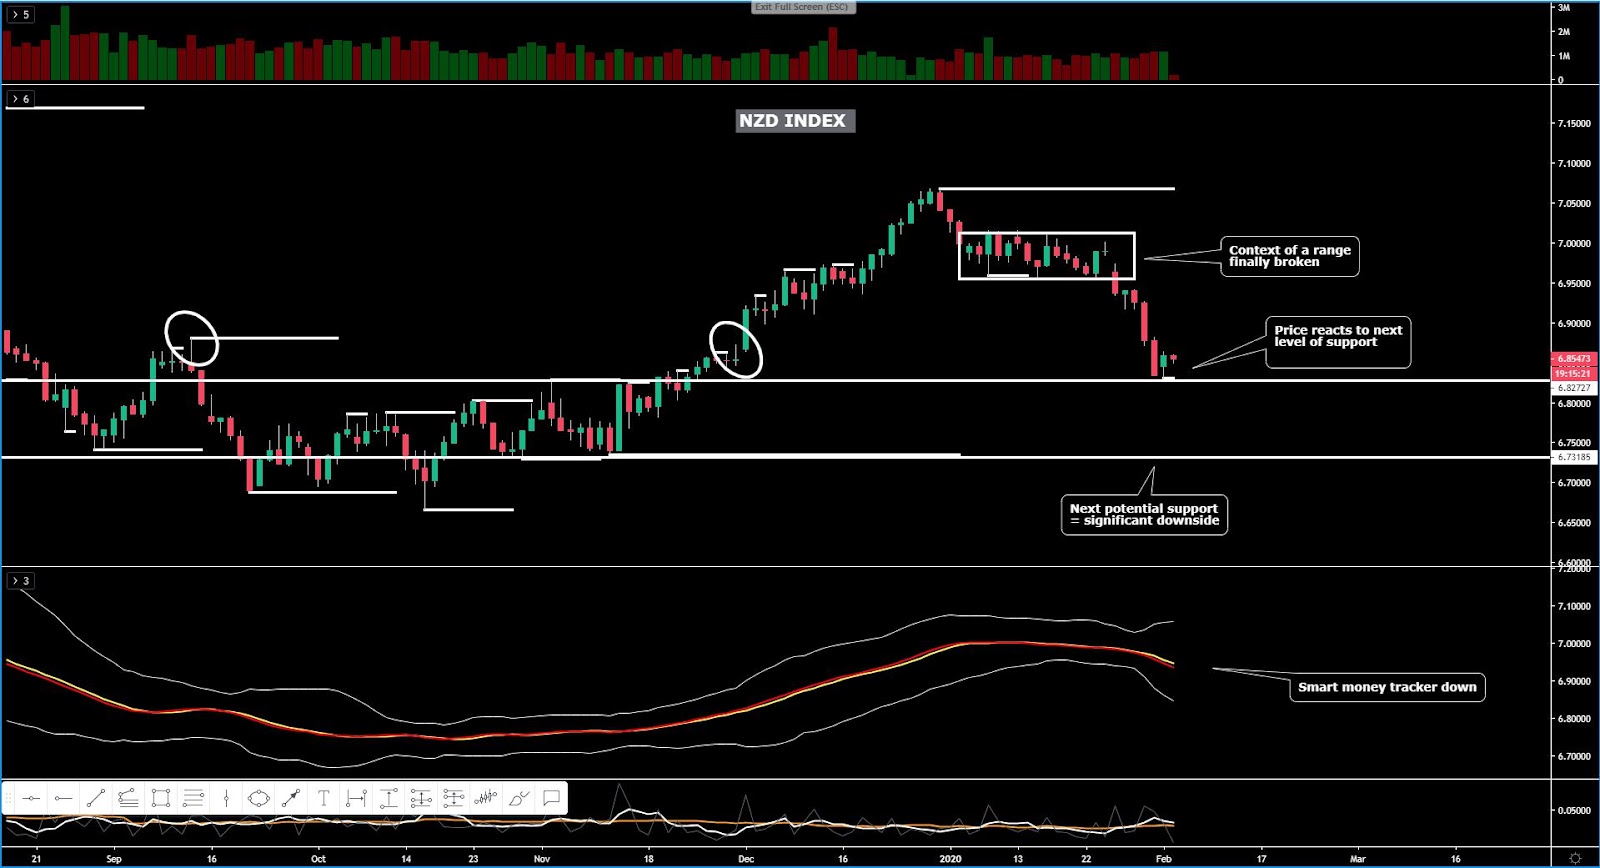
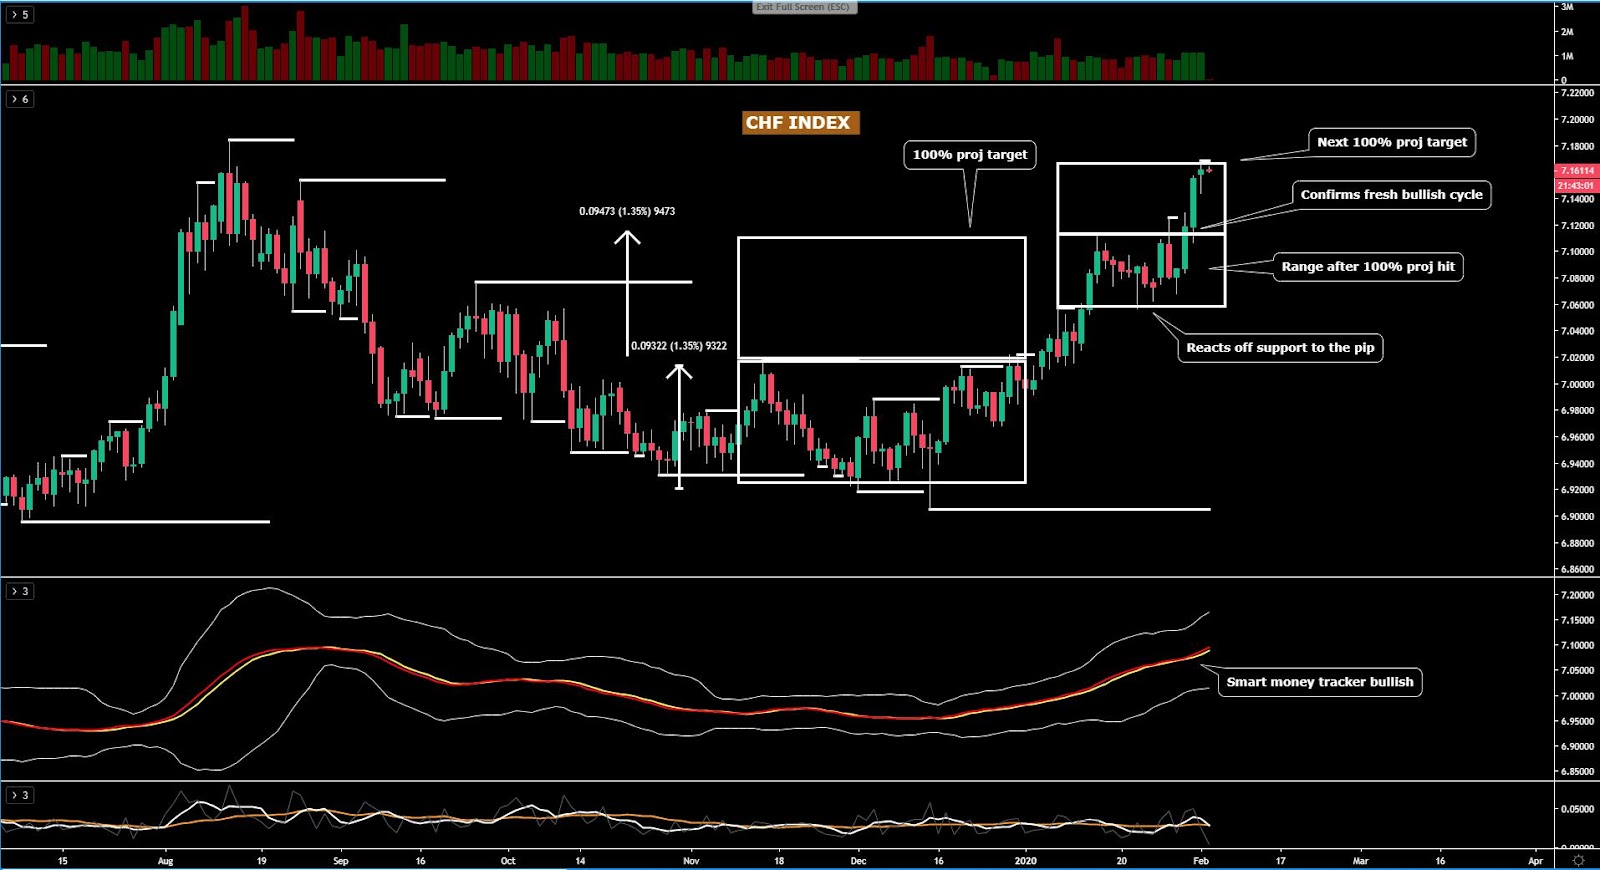
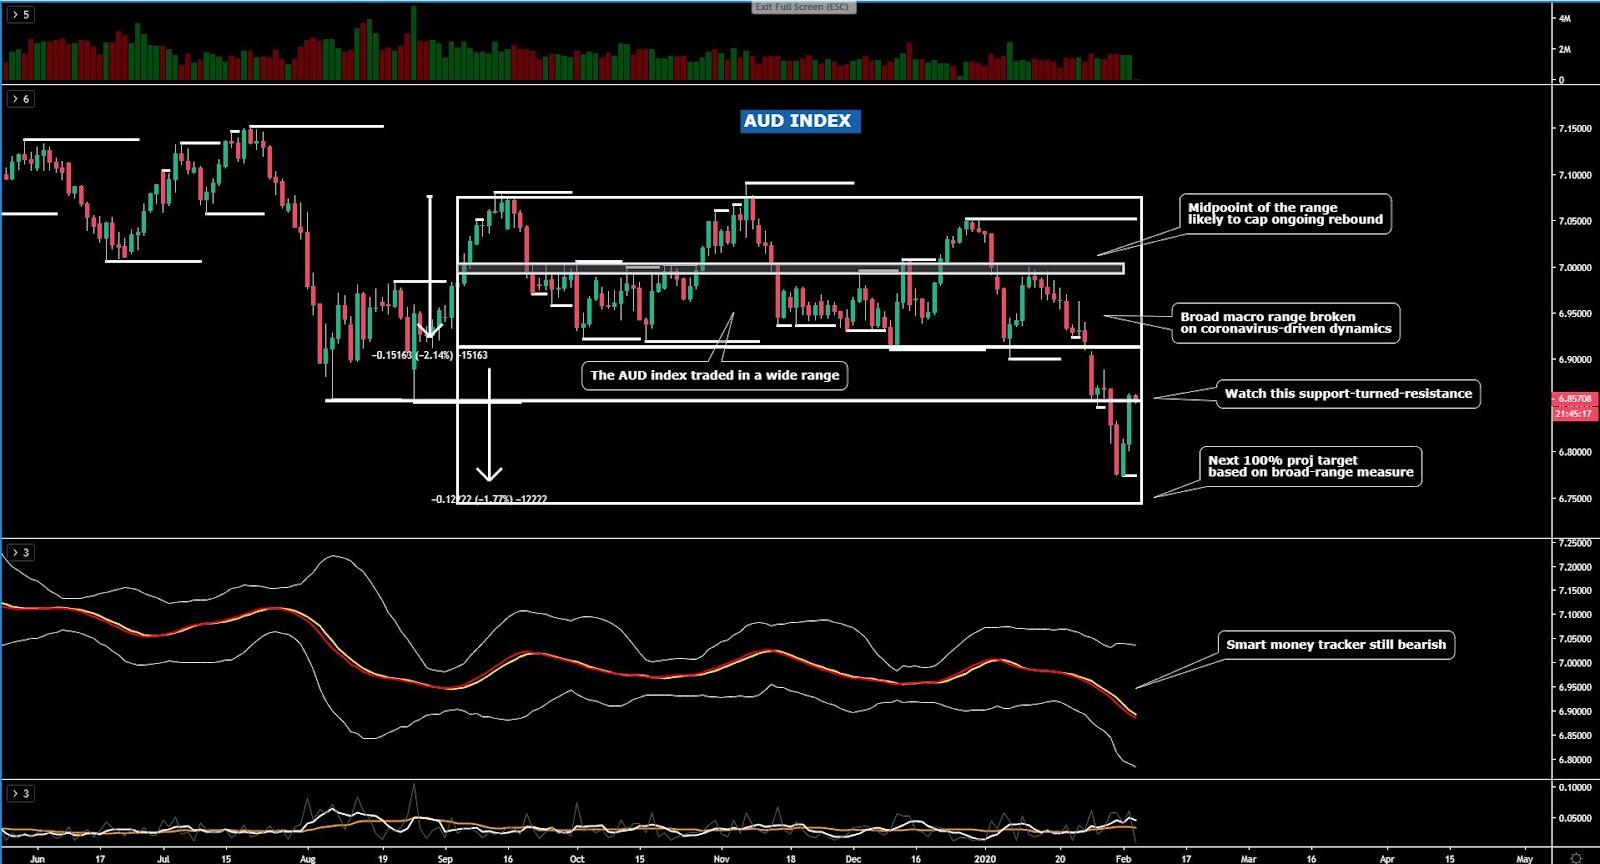
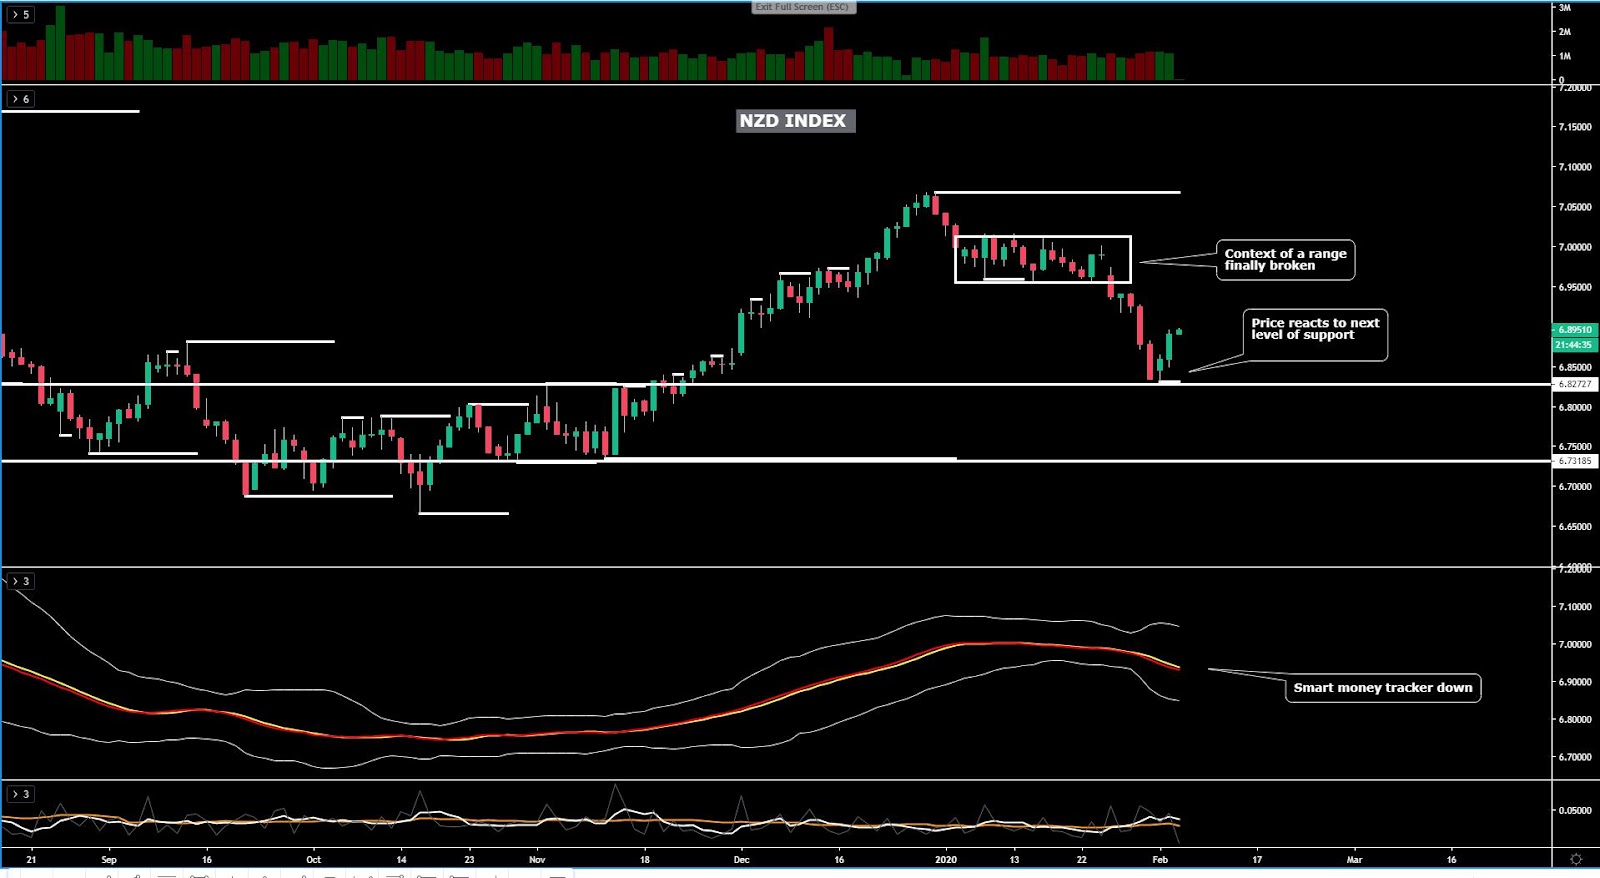
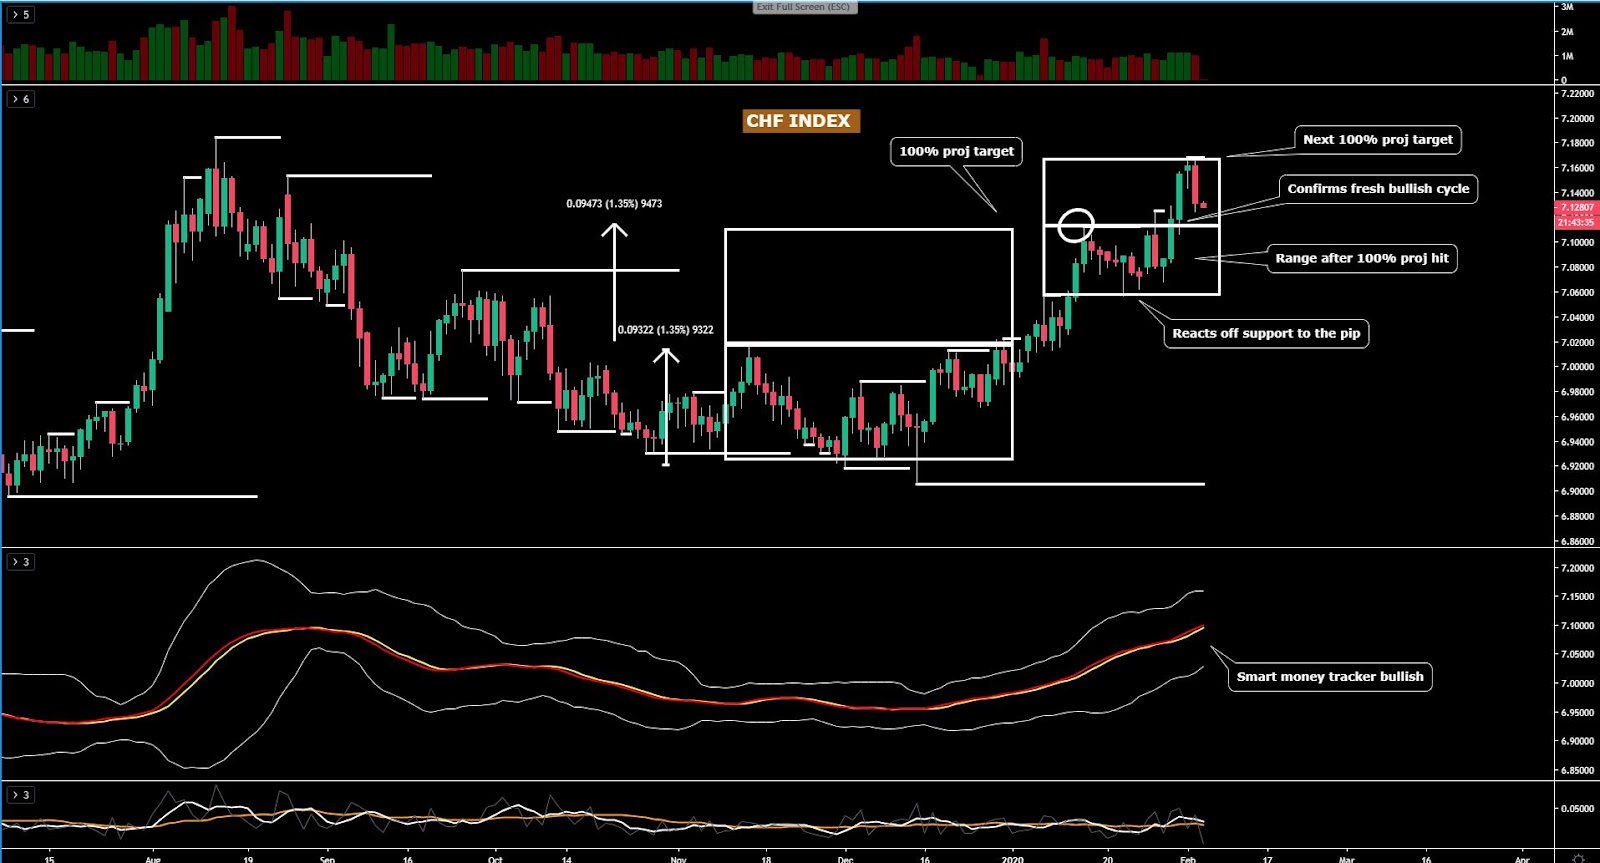
To start with, we can see the EUR index still dominated by the sell-side pressure exerted by the slow money even if the currency has found support where one would have expected ahead of the ECB. Please, read above my note on why the EUR may see a hawkish surprise, which would then make you understand why such support may have been perceived as an appealing pricing to gain EUR long exposure ahead of the ECB policy meeting. The GBP, meanwhile, is a market that has finally had a breakthrough by breaking a key resistance and along the process, realigning the set of triple fibo-derived moving averages. GBP is a buy on weakness heading into the BOE decision on Jan 30. While the Pound is a currency justifying long exposure on better price dealings, so is the USD, with the 3 moving averages aligning at a time when the price structure is bullish, after the break of highs earlier this week. The CAD, on the flip side, shows the most bearish tendencies, with the potential for further weakness a real possibility as this is a sudden and sharp fall driven by an aggressive shift in tone by the BOC to more dovish. The set of triple moving averages are all in line with the bearish trend, therefore, upon a release of the sell side pressure since the market is exceedingly overextended, aim to be a seller on strength. The JPY continues to recover from the bottom found even if the technicals, as the red slope in the triple moving averages depict, suggests sell on strength is the way to go for now. The AUD index has recovered very strongly from the lows after a stellar Aussie jobs report, even if selling on this appreciation may kick in at fairly regular intervals based on technicals. The NZD index has also turned dovish based on the triple moving averages for the first time mid Oct, however, the price structure is yet to validate the bear trend (we remain in a range for now). Lastly, the CHF index has printed a sizeable bullish pin bar (lower shadow) after the market got busy buying the sharp dip seen on Wednesday in reflection of the underlying bull trend in dominance.
Important Footnotes
Exodus Of CAD Longs, GBP Soars Ahead Of BOE
The Forex market has finally seen the light at the end of its obscure tunnel with volatility, even if it may prove to be an ephemeral anecdote, soaring amid an aggressive adjustment in the BOC policy expectations to a significantly more dovish stance. Want to find out the rest of drivers and what currencies look set to benefit from the latest lively ebbs and flows? Dive into the report to find out...
The Daily Edge is authored by Ivan Delgado, 10y Forex Trader veteran & Market Insights Commentator at Global Prime. Feel free to follow Ivan on Twitter & Youtube weekly show. You can also subscribe to the mailing list to receive Ivan’s Daily wrap. The purpose of this content is to provide an assessment of the conditions, taking an in-depth look of market dynamics - fundamentals and technicals - determine daily biases and assist one’s trading decisions.
Let’s get started…
- Quick Take
- Narratives in Financial Markets
- Recent Economic Indicators
- Dive Into FX Chart Insights
- Educational Material
Quick Take
The Pound has been, by a fair margin, the currency paying the most dividends for those with long-side exposure ahead of next week’s BoE policy meeting. Price action, which in the case of the Pound, has been rather constructive this week, goes a long way to decipher the true intentions of the market, diminishing the risk of marrying you to a bias just because the hype as of late it’s been that the BOE may lower rates next week. Well, it turns out, the market had clearly other intentions, aided by the highest quarterly business optimism among UK factories (UK CBI report) since April 2014. The Aussie is another currency flying high after a solid jobs report in Australia even if remains at the very tail of performing currencies in January. Again, such behavior, may have defied logic if one had been fixated in the US-China trade deal as the catalyst for higher prices as opposed to price action and the monitoring of the AUD index, which told us a different story. The Swissy, meanwhile, is a currency that just keeps on giving those those committed to buy the dips in what’s, together with the USD, the top performing currency this month. In stark contrast, the Canadian Dollar was completely annihilated by market forces as the BOC did a 180-degree turnaround on its monetary policy stance, openly recognizing that lower rates are back on the table for the next few months. In response, the CAD saw one-way transit flows. The Euro is the currency to shift the focus towards in the next 24h, as the ECB is up next. As I argue in today’s report, watch out for some type of hawkish surprise by the CB, even if just at the margin. The Yen, amid a mixed-bag of risk dynamics, with US equities and global bonds in stand-by, also portrays choppy price action amid a short-term correction of its bear tendencies. China’s efforts to contain the coronavirus has also contributed to appease market fears even if the situation is still fluid, with the WHO to decide today if the crisis is declared an international emergency. Lastly, the Kiwi is going nowhere fast, with an absence of fundamental drivers as of late.
The indices show the performance of a particular currency vs G8 FX. An educational video on how to interpret these indices can be found in the Global Prime's Research section.
Narratives In Financial Markets
* The Information is gathered after scanning top publications including the FT, WSJ, Reuters, Bloomberg, ForexLive, Institutional Bank Research reports.
The Pound soars as BoE rate cut bets unwound: The Pound continues to roar ahead as the top performing currency aided by the latest rise in the UK CBI report, which saw quarterly business optimism among UK factories jumped sharply, highest since April 2014. The strengthening of the Pound also comes as a by-product of the market going through second-thoughts on the BOE rate cut pricing for next week. The odds of a 25 bps rate cut on 30 January when the BOE meets fell under 50% from over 70% on Friday.
Johnson's Brexit to go into law: In other Pound news, even if that’s water under the bridge for Mr. Market, Boris Johnson's Brexit deal passed through UK parliament and the law goes to the Queen for royal assent. Remember, this was fully priced in on election day when Johnson secured a majority in parliament. Right now, as a driver for the Pound, we must focus on the UK economy, the BOE rate cut pricing and the ongoing negotiations of the future trade relationship with the EU.
The CAD was taken to the woodshed: This was in response to the BOC policy statement, which came more dovish-than-expected. Even if the BOC left rates unchanged at 1.75% as expected, there were a number of factors that worsened the outlook for rates to remain neutral. The chance of a Bank of Canada rate cut for the March 4 meeting has gone up to about 30% in the OIS market from 6%, while in April 15, odds of a cut rose to 51% from 22% yesterday.
Plenty of dovish remarks by the BOC: The BOC removed the description of the key rate being 'appropriate', which is a hint that they see downside risks to maintaining it where it is. The BOC added dovish remarks such as they will watch closely "to see if the recent slowdown in growth is more persistent than forecast." They also pointed to the resilience of the Canadian economy but outlined indicators since Oct MPR as mixed (the surprise index is at the lowest since 2009). The Bank also argued that the Canadian economy is no longer operating close to capacity, while noting that indicators of consumer confidence and spending have been unexpectedly soft.
Polox reaffirms dovish turnaround: If CAD traders did not have sufficient reasons to justify the short exposure, BOC's Poloz presser clearly hinted that a rate cut was considered by noting that the lowering of the interest rate wasn't warranted 'at this time', with financial vulnerability concerns weighing against cut. Poloz said that “the overall excess capacity in the Canadian economy has increased, which will bring a degree of downward pressure on inflation,'' while adding that “we received a string of disappointing consumer readings”, with much of BOC deliberations today, as Poloz notes, “ focused on persistence of slowdown.” All around, some dovish stuff to digest for CAD traders.
Canadian CPI inflicts further pain to the CAD: The Canadian December CPI came slightly softer at +2.2% vs +2.3% y/y expected, leading to a further deterioration in the CAD outlook. The details on the core measures were not very encouraging either as both the median and trim also failed to post as steady results as expected. Ironically, while the expectations could not be met, all three BOC core measures have found a base above the 2% BOC mandate.
WHO holds decision on coronavirus for Thursday: In terms of the ongoing concerns about the spread of the coronavirus, the World Health Organization decided to delay its decision on whether to declare coronavirus an int'l emergency. They will meet again on Thursday to make a decision. The WHO director General Tedros said that “the decision on whether to declare coronavirus outbreak and international emergency until Thursday,'' adding “Coronavirus is an evolving and complex situation.” Tedros went on to say “our team is on the ground in China to investigate the outbreak and get more information.”
China seeks to contain virus: The markets seems to have calmed on the coronavirus concerns as according to China's CCTV, the Chinese city of Wuhan where the virus originated from, did suspend outbound flights and rail services. Hu Xijin, a mouth-piece for the Chinese government working for the Global Times, tweeted: “Shutting down outbound transportation of a provincial capital city is unprecedented in China since 1949. Didn't do so even during SARS in 2003. This is a forced step since virus is expanding fiercely. It will greatly increase the chance of epidemic being contained.” It’s worth noting, however, that the report death tolls has doubled in the last 24h with 10 people so far dead and hundreds infected.
Aussie jobs remove the risk of a rate cut by the RBA in Feb: The Australian December employment report came in much better than expected with the unemployment rate dropping to 5.1% (expected 5.2%), while the headline employment change was +28.9K, almost triple the expected 10.0K. In terms of the breakdown of full vs part time jobs created, the full time employment chang was barely changed at -0.3K, with the part time at +29.2K. The participation rate came at 66.0% as expected. The report should remove the risk of a rate cut by the RBA next week despite the concerns on the economic impact of the bushfires, which is seen as a double-edged sword as it will also create more jobs during the recovery.
ECB a EUR long risk event? The ECB policy meeting is due today and is likely a non-event despite the balance of risk, if the latest minutes is anything to go by, could be a hawkish surprise. In the last minutes, the ECB did outline a mild increase in inflation and growth outlook. The ECB, sooner or later, may have to recognize the improving data we are seeing even if that’s occurring from the context of depressed conditions. Similarly, another admission that may aid the EUR is the fact that fewer headwinds exists as US-China trade deal and Brexit have relaxed. Watch for the discussion about the risk balance shifting to "neutral" in coming meetings.
Trump warns on EU tariffs: Something for EUR traders to keep an eye is the latest warning on EU tariffs by Trump. Trump said “I have a date in my mind for EU tariffs, it is a fairly quick date”. For now, the statement should only be read as a warning if he can't get a deal with the EU, even if he still admitted that his base case is a deal to be struck with the EU before the US election.
As does Mnuchin... US Treasury Secretary Steven Mnuchin also flexed his muscle on Europe, saying that the US could use tariffs on automobile imports against countries that decide to apply their own taxes on technology companies. “If people want to just arbitrarily put taxes on our digital companies, we will consider arbitrarily putting taxes on car companies,” Mnuchin said. “We think the digital tax is discriminatory in nature.”
SNB committed to intervention if CHF keeps appreciating: The SNB member Maechler said the Swiss Central Bank remains committed and ready to intervene in FX markets if needed, with FX reserves a result of monetary policy. The headlines come after the US treasury put Switzerland on the watchlist as a currency manipulator, even if that has done little to tame down the interventionist commentaries by the SNB.
If you found this fundamental summary helpful, just click here to share it!
Recent Economic Indicators & Events Ahead
Source: Forexfactory
Insights Into FX Index Charts
The indices show the performance of a particular currency vs G8 FX. An educational video on how to interpret these indices can be found in the Global Prime's Research section. The idea of this analysis is to complement one’s daily bias by accounting for this holistic analysis.
If you found the content in this section valuable, give us a share by just clicking here!
As the charts below illustrate, we have a number of currencies, that when matched, are starting to trend quite nicely. Today, as part of my analysis, I use a set of fibonacci-derived weighted moving averages (13, 21, 34), which is going to provide great insights on what currencies are currently showing the strongest versus the weakest ebbs and flows.
To start with, we can see the EUR index still dominated by the sell-side pressure exerted by the slow money even if the currency has found support where one would have expected ahead of the ECB. Please, read above my note on why the EUR may see a hawkish surprise, which would then make you understand why such support may have been perceived as an appealing pricing to gain EUR long exposure ahead of the ECB policy meeting. The GBP, meanwhile, is a market that has finally had a breakthrough by breaking a key resistance and along the process, realigning the set of triple fibo-derived moving averages. GBP is a buy on weakness heading into the BOE decision on Jan 30. While the Pound is a currency justifying long exposure on better price dealings, so is the USD, with the 3 moving averages aligning at a time when the price structure is bullish, after the break of highs earlier this week. The CAD, on the flip side, shows the most bearish tendencies, with the potential for further weakness a real possibility as this is a sudden and sharp fall driven by an aggressive shift in tone by the BOC to more dovish. The set of triple moving averages are all in line with the bearish trend, therefore, upon a release of the sell side pressure since the market is exceedingly overextended, aim to be a seller on strength. The JPY continues to recover from the bottom found even if the technicals, as the red slope in the triple moving averages depict, suggests sell on strength is the way to go for now. The AUD index has recovered very strongly from the lows after a stellar Aussie jobs report, even if selling on this appreciation may kick in at fairly regular intervals based on technicals. The NZD index has also turned dovish based on the triple moving averages for the first time mid Oct, however, the price structure is yet to validate the bear trend (we remain in a range for now). Lastly, the CHF index has printed a sizeable bullish pin bar (lower shadow) after the market got busy buying the sharp dip seen on Wednesday in reflection of the underlying bull trend in dominance.
Important Footnotes
- Cycles: Markets evolve in cycles followed by a period of distribution and/or accumulation. To understand the principles applied in the assessment of cycles, refer to the tutorial How To Read Market Structures In Forex
- Horizontal Support/Resistance: Unlike levels of dynamic support or resistance or more subjective measurements such as fibonacci retracements, pivot points, trendlines, or other forms of reactive areas, the horizontal lines of support and resistance are universal concepts used by the majority of market participants. It, therefore, makes the areas the most widely followed and relevant to monitor. The Ultimate Guide To Identify Areas Of High Interest In Any Market
- Trendlines: Besides the horizontal lines, trendlines are helpful as a visual representation of the trend. The trendlines are drawn respecting a series of rules that determine the validation of a new cycle being created. Therefore, these trendline drawn in the chart hinge to a certain interpretation of market structures.
- Fundamentals: It’s important to highlight that the daily market outlook provided in this report is subject to the impact of the fundamental news. Any unexpected news may cause the price to behave erratically in the short term.
- Projection Targets: The usefulness of the 100% projection resides in the symmetry and harmonic relationships of market cycles. By drawing a 100% projection, you can anticipate the area in the chart where some type of pause and potential reversals in price is likely to occur, due to 1. The side in control of the cycle takes profits 2. Counter-trend positions are added by contrarian players 3. These are price points where limit orders are set by market-makers. You can find out more by reading the tutorial on The Magical 100% Fibonacci Projection