IvanGlobalPrime
Company Representative
- Messages
- 36
Find my latest market thoughts
Epic Risk-Off Unwinding, Blink And You Missed It
If, as a trader, you are yet to do the hard yards in financial markets, the last 24h provides a great opportunity to understand in all its splendor the dynamic and efficient nature of the markets. One hour it may look like all hell breaks loose, while in the next, the psyche can change in a dime. Find out in today's report the chronicles of what's happened and where do we stand in the FX outlook?
The Daily Edge is authored by Ivan Delgado, 10y Forex Trader veteran & Market Insights Commentator at Global Prime. Feel free to follow Ivan on Twitter & Youtube weekly show. You can also subscribe to the mailing list to receive Ivan’s Daily wrap. The purpose of this content is to provide an assessment of the conditions, taking an in-depth look of market dynamics - fundamentals and technicals - determine daily biases and assist one’s trading decisions.
Let’s get started…
Quick Take
Most of the volatility on Wednesday was concentrated along the Asian hours. Initial panic selling triggered by the prospects the US declaring war to Iran were relatively quickly met with the realization that such idea was unjustified judging by the delay for Trump to make any formal statement. What set out to be a very cloudy outlook for risk-sensitive assets shifted into an epic short-squeeze that lasted until the final hours of New York. If, as a trader, you are yet to do the hard yards in financial markets, the last 24h provides a great opportunity to understand in all its splendor the dynamic and efficient nature of the markets. One hour it may look like all hell breaks loose, while in the next, the psyche can change in a dime. After the headlines broke out of an attack to US personnel in Iraq by Iran, it became a binary outcome to figure out. Without much fact-checking available, the immediate premise was that Trump would need to strike back (war?), leading to a sudden fall in equities, bond yields, buying of Yens, Swissies, Gold. However, as Trump delayed its appearance with an official response until the next day, it acted as a revealing clue that an escalation of the conflict was probably not on the table. As Europe and American markets came online, the U-turn day kept playing out, only to get a final boost as Trump downplayed the attack with market friendly headlines.
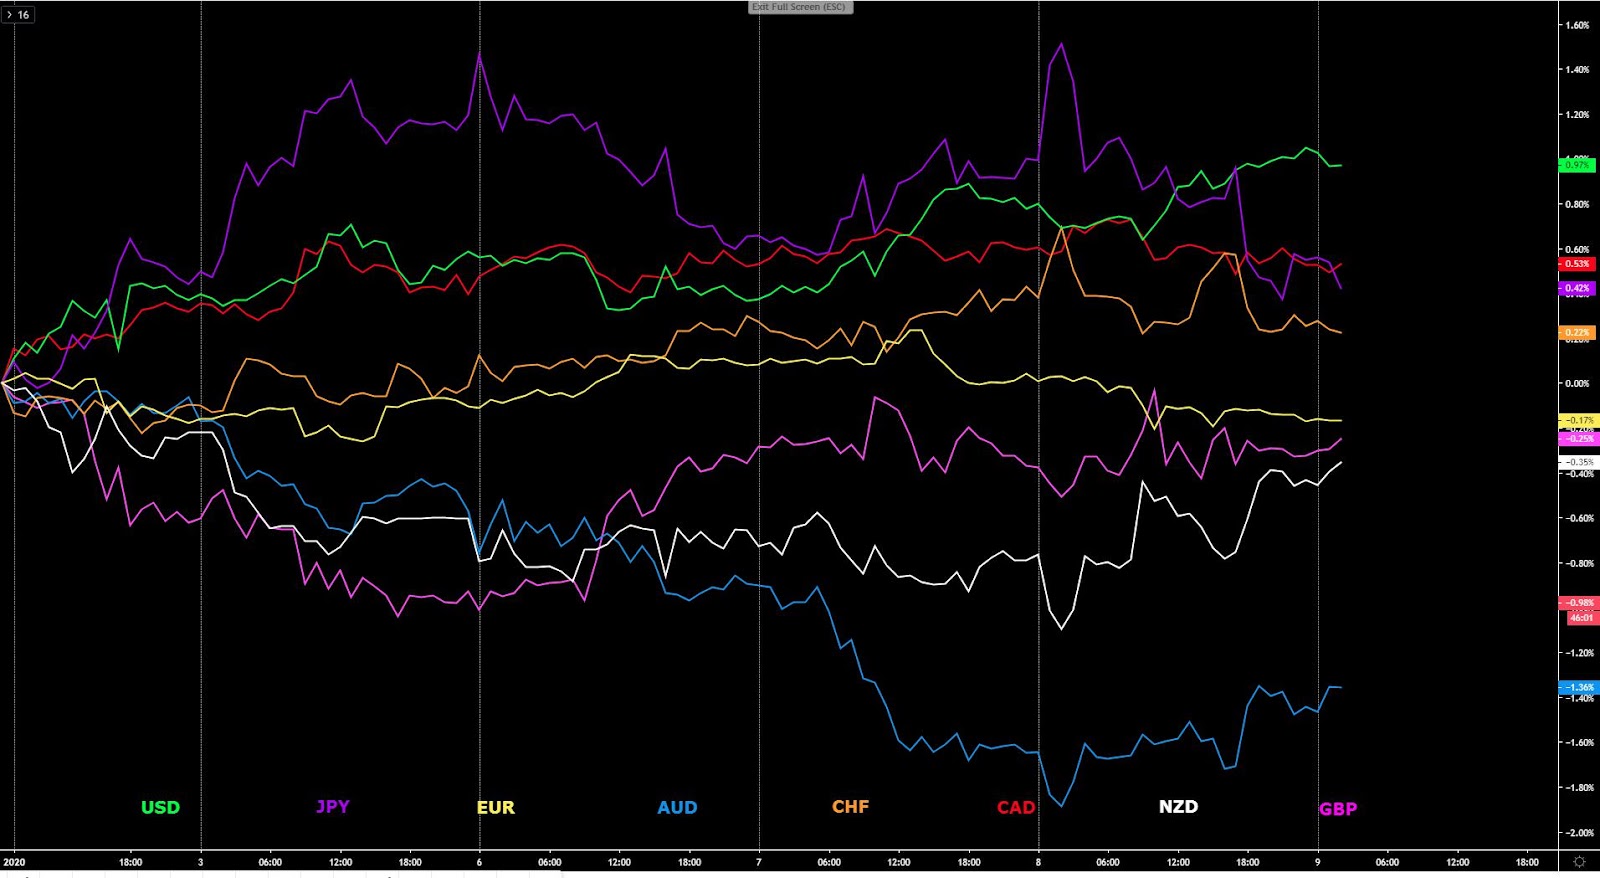
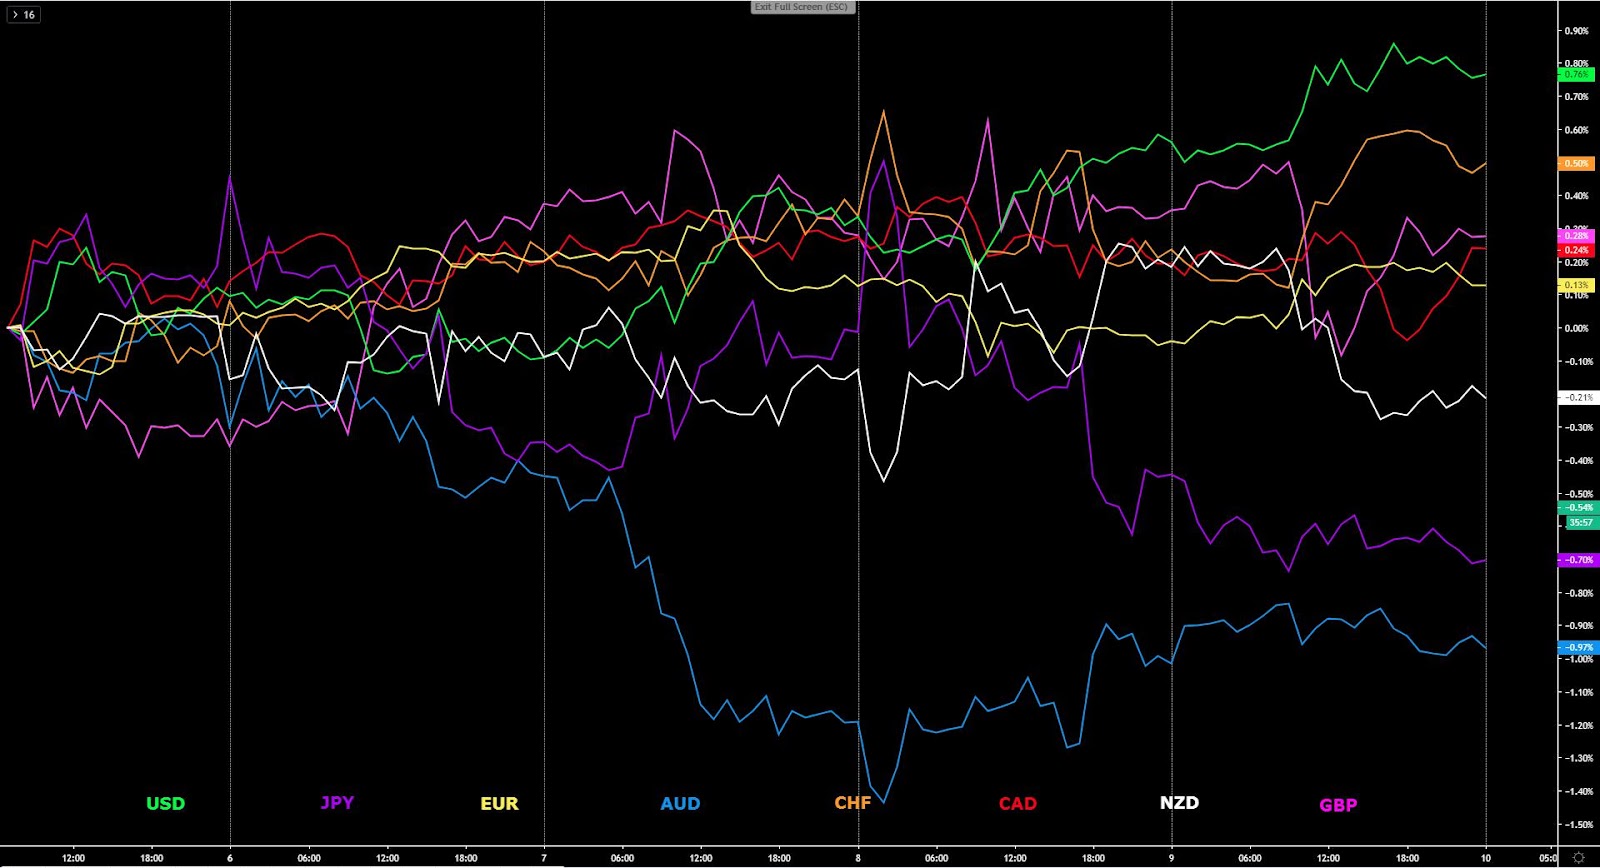
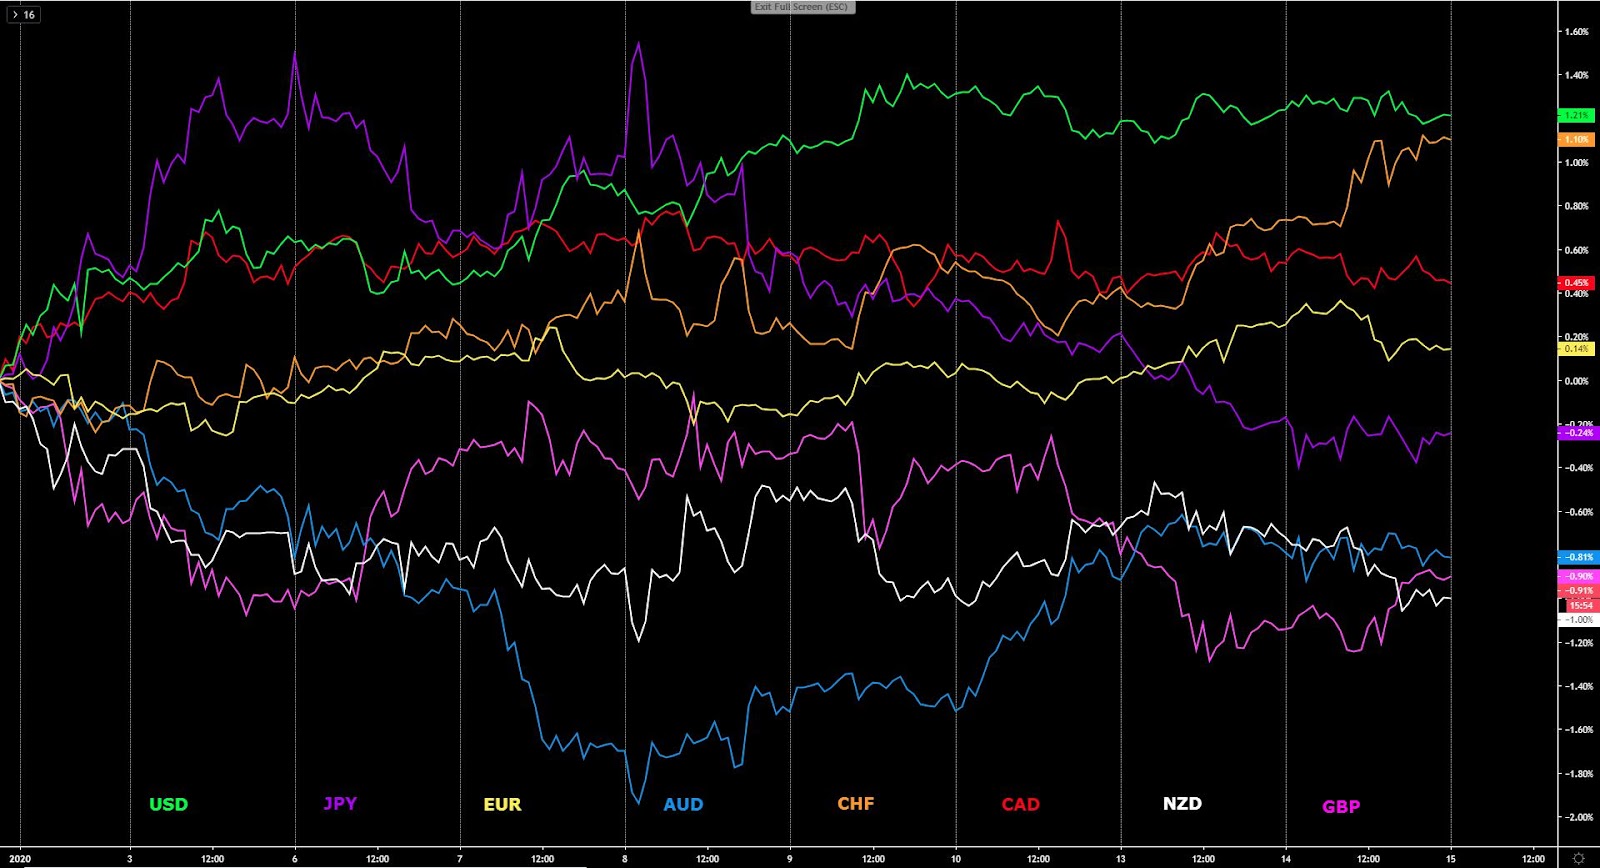
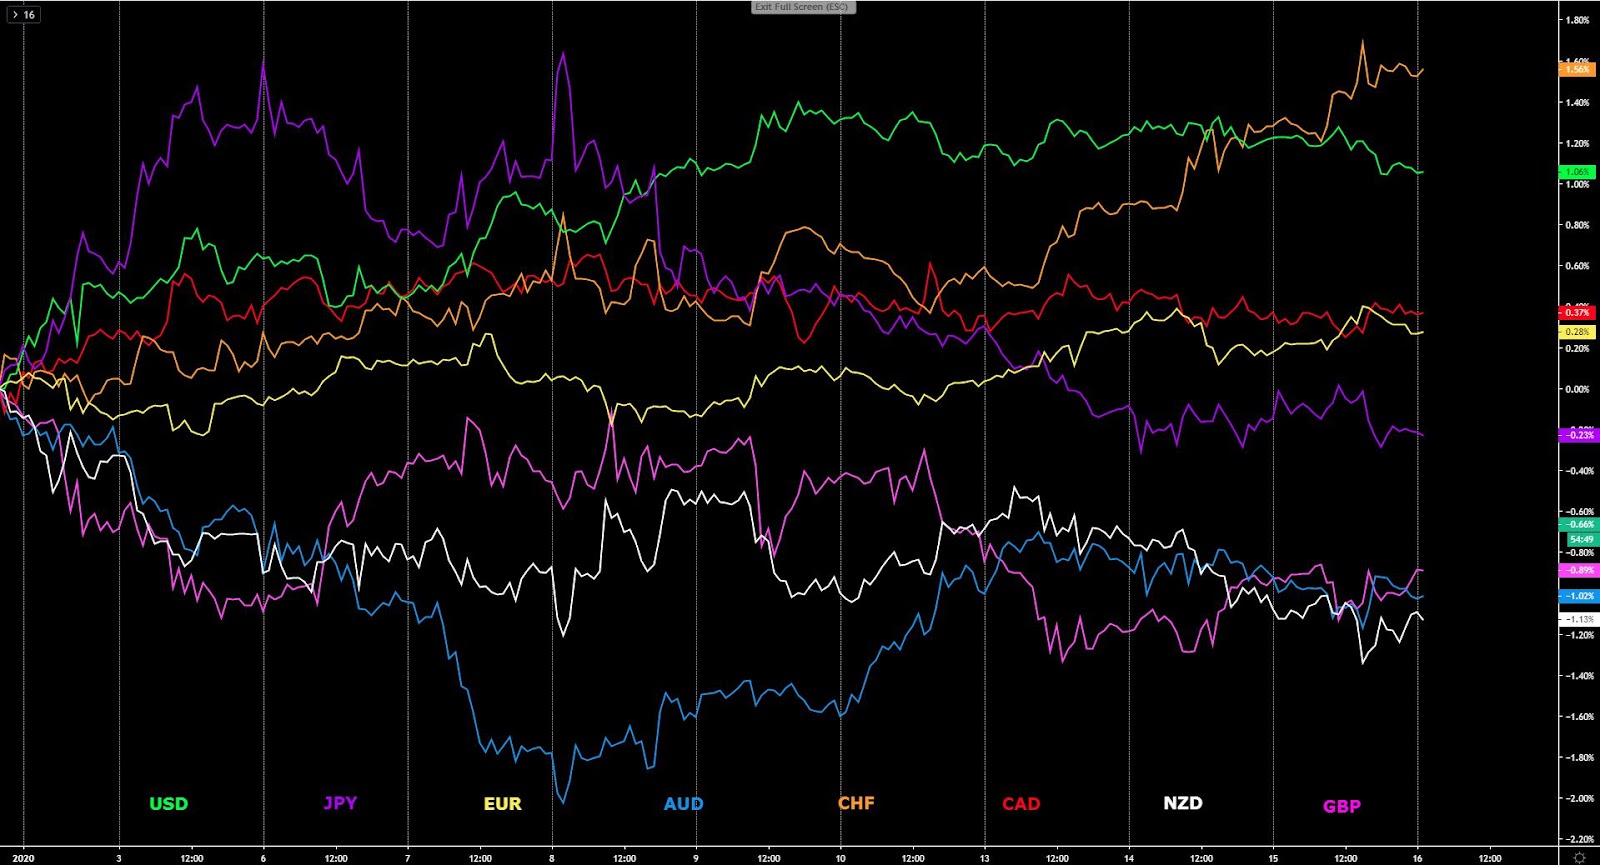
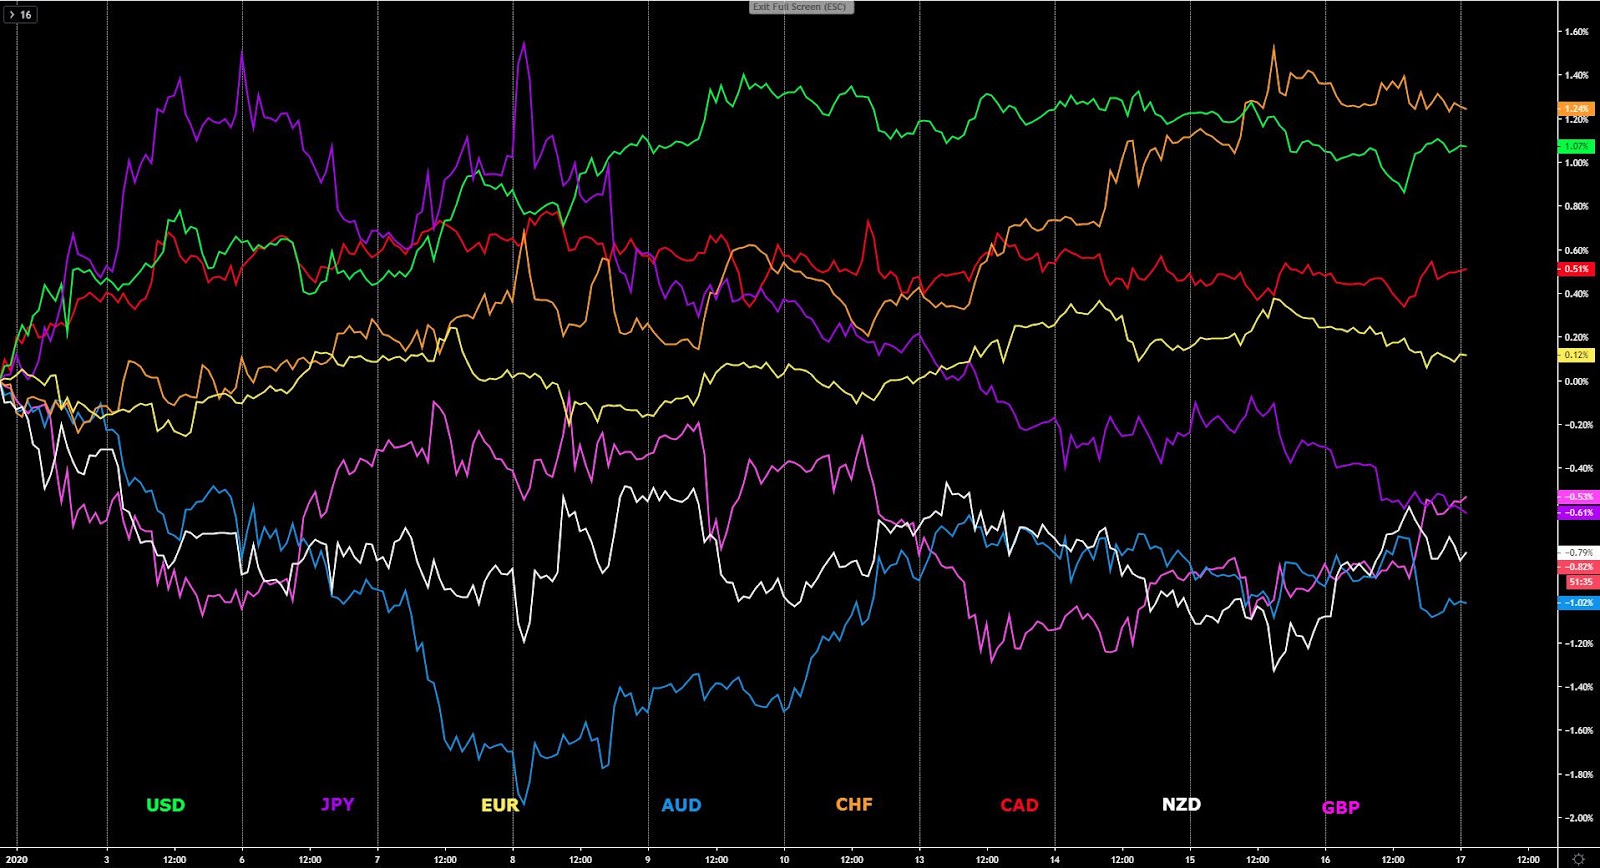
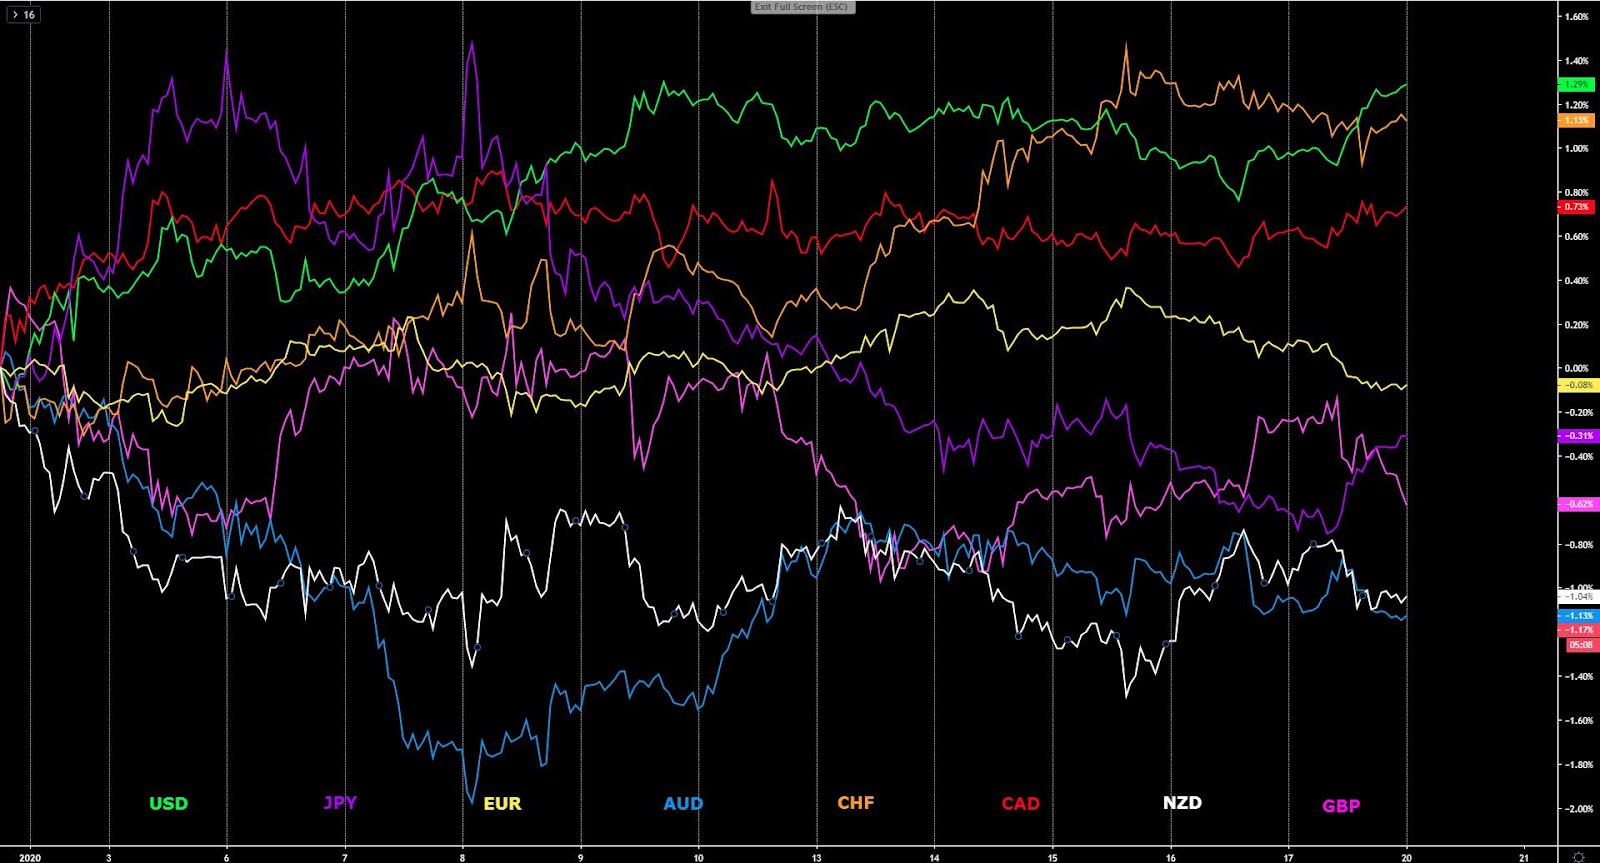
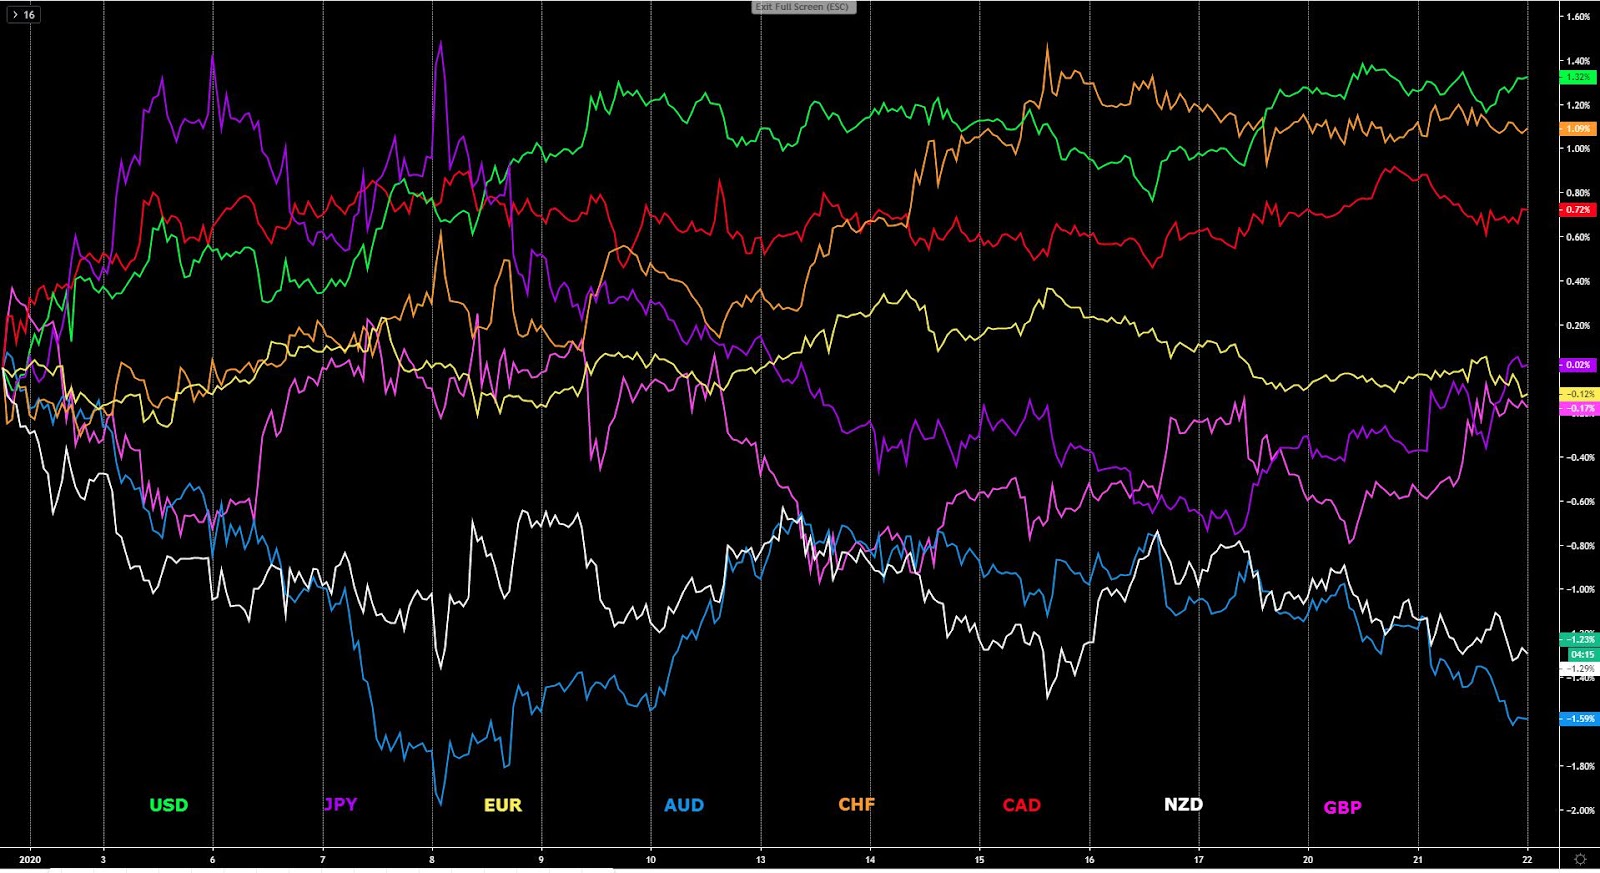
The indices show the performance of a particular currency vs G8 FX. An educational video on how to interpret these indices can be found in the Global Prime's Research section.
Narratives In Financial Markets
* The Information is gathered after scanning top publications including the FT, WSJ, Reuters, Bloomberg, ForexLive, Institutional Bank Research reports.
A short-lived scare after all... What looked like terrifying prospects of a war breaking out between the US and Iran had the Iranian-led missile attacks against air bases housing US troops in Iraq claimed any casualties, turned out to be, at the end, the precursor setting the stage for an epic short squeeze in risk. As a consequence, assets most sensitive to risk dynamics, the likes of the Japanese Yen, the Swiss Franc, Gold, Oil, equities, bond yields, displayed major V-shaped rotations.
Delay for Trump to respond main driver to unwind positions: Initially, the fear and uncertainty of the unknown (what the US response to the Iranian attack would be), led to an immediate panic selling in markets during Asia. However, evidence that no US lives were accounted for in the attack, alongside the delay by Trump to respond (main driver in the risk recovery), led to a quick re-assessment that the panic selling was unfounded. The short-squeeze was well and alive and the recovery in risk never looked back.
Trump backs off from direct confrontation: During the early hours of Wednesday in the US, it was confirmed via a speech by the man himself, that Trump won’t be seeking further confrontation with Iran for now, set out the perfect storm for leveraged trading (risk seeking) to make a huge comeback.
Trump applies pragmatism given the circumstances: In the much-awaited Trump speech, the US President addressed some of the most pressing questions. But the bottom line, and the binary outcome to trade markets in a volatile day, was the admission that the US and Iran tit-for-tat retaliation may be over. This became obvious when Trump stated “Iran appears to be standing down, which is a good thing.” If one wishes to get deeper insights into the key highlights of the speech, I recommend this BBC report.
Iran's action an act of saving face: After the dust settled, a Reuters report surfaced that it was Iran’s strategy from the get go to deliberately sought to avoid US military casualties in strikes, citing US and European sources. The strike, therefore, was more symbolic than anything else, acting as a “warning shot”. This looks, therefore, to have been a tactic to save face by Iran without going to war, and as long as they believe it has served its purpose, that’s what matters to gain certainty that Iran is now done messing around with the US military capabilities. Besides, Iran stated that they'll stop attacking if there is no response from the US, according to US media in Tehran.
US VP Pence postpones speech on Iran: Further evidence that the US intends to de-escalate the tensions in Iran for the time being, is the fact that a scheduled speech by US Vice President Pence on Iran, was postponed. Vice President Pence was scheduled to speak on Monday 13 January at the Foundation for Defense of Democracies' National Security Summit in Washington.
Market ready to re-calibrate its focus? After this final and somehow bizarre ‘showdown’ orchestrated by Iran, financial markets might be on the cusp of moving on to re-calibrate the focus where it matters. This means the attention may finally move away from the inconvenience of having the constant headline-drips of US-Iran conflict to instead re-focus on the global outlook and trade with China and the US set to sign the trade deal on Jan 15.
Comprehensive trade deal with the EU virtually impossible: The series of Brexit-related news put pressure on the GBP on Wed. UK PM Johnson met with the EC President von der Leyen. While the British politician remains stubborn in that a deal must get done by the end of 2020, the EU stands by its firm believe that such a scenario is near impossible. The EU and UK will have to prioritize what they want agreed by the end of 2020, assuming there is no extension to the transition period. In looks likely that the UK will be seeking a Canada-style FTA by the end of the year.
If you found this fundamental summary helpful, just click here to share it!
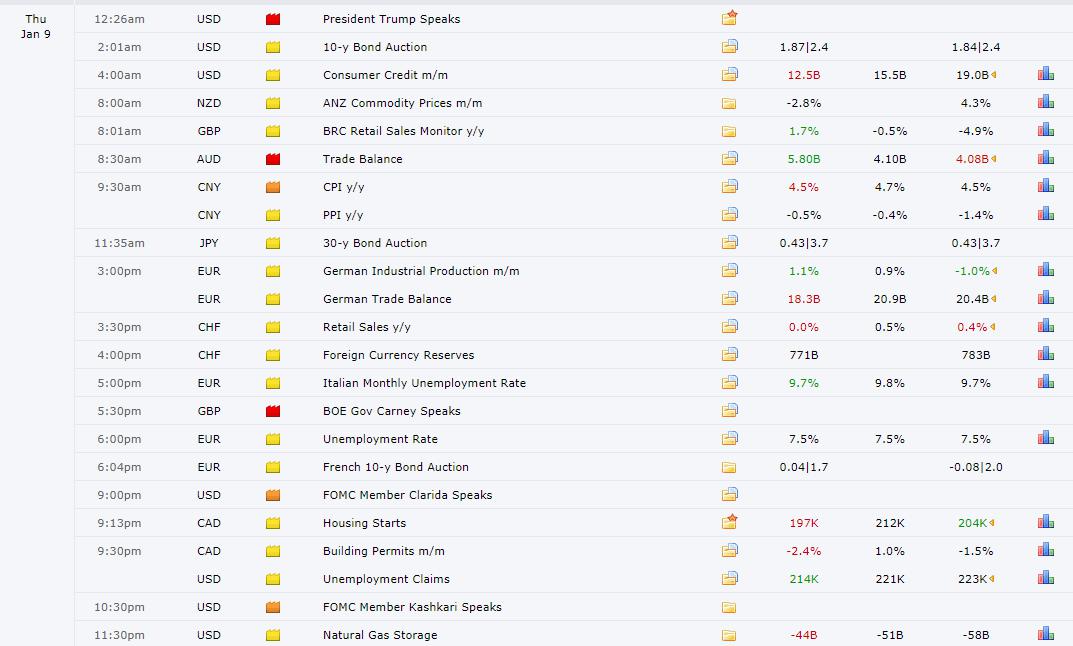
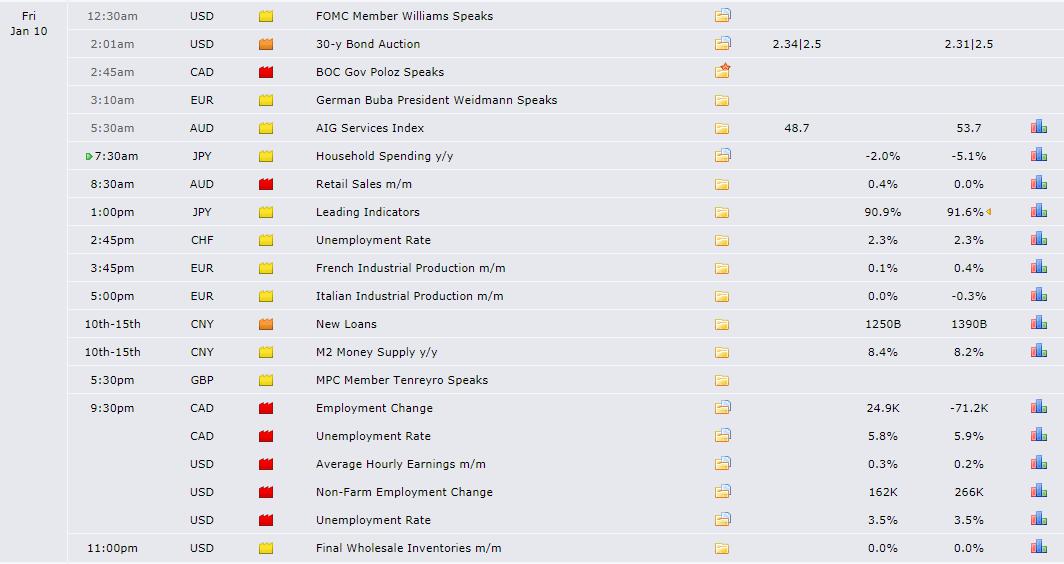
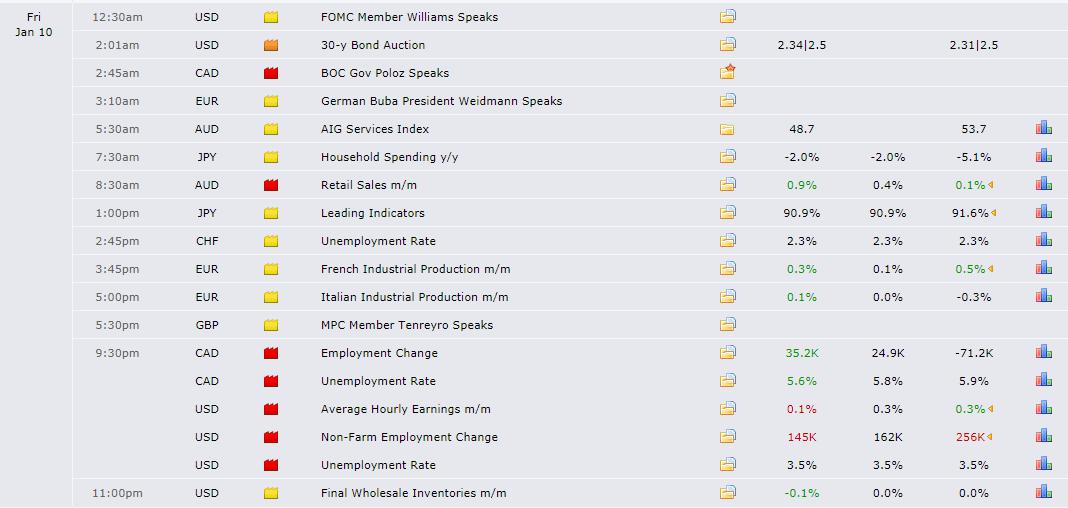
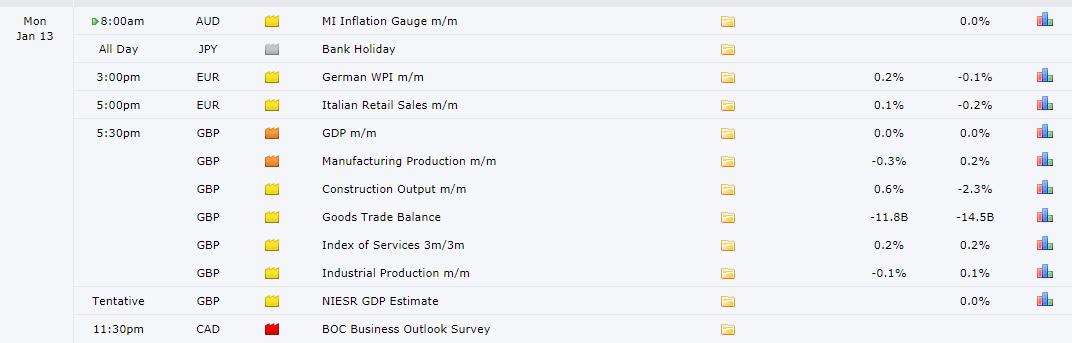
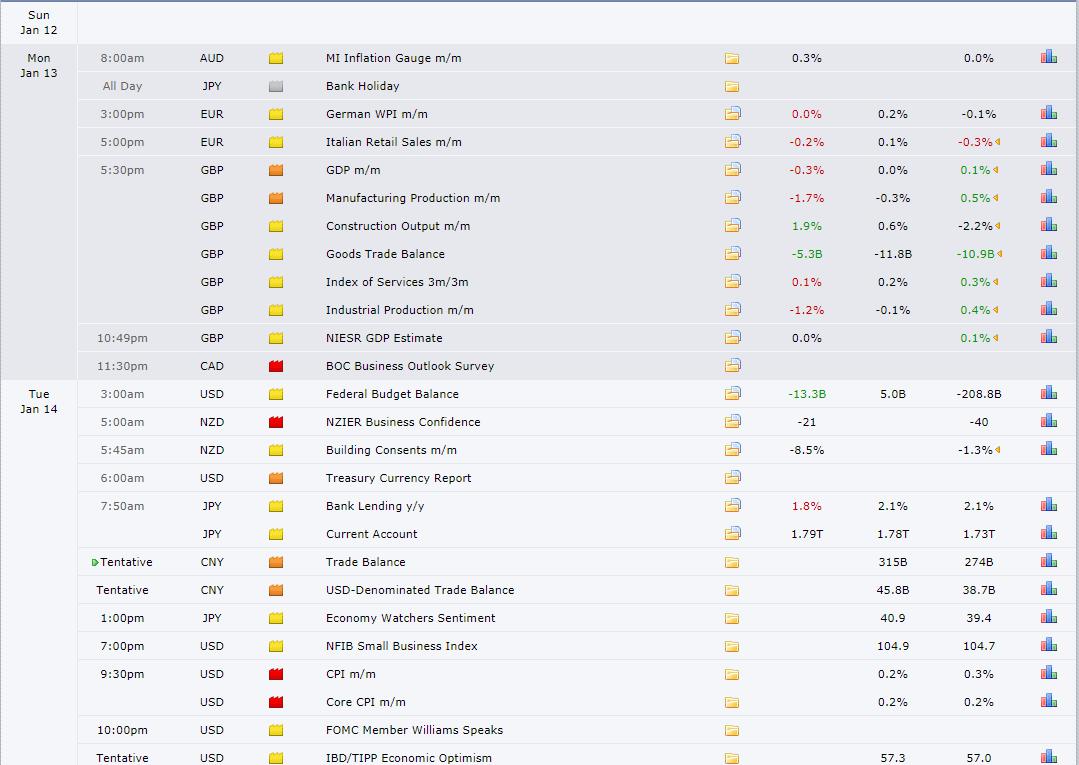
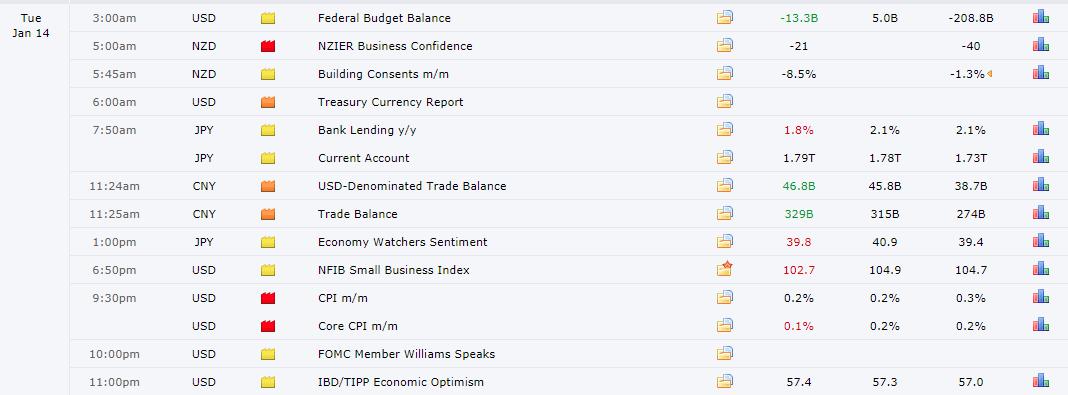
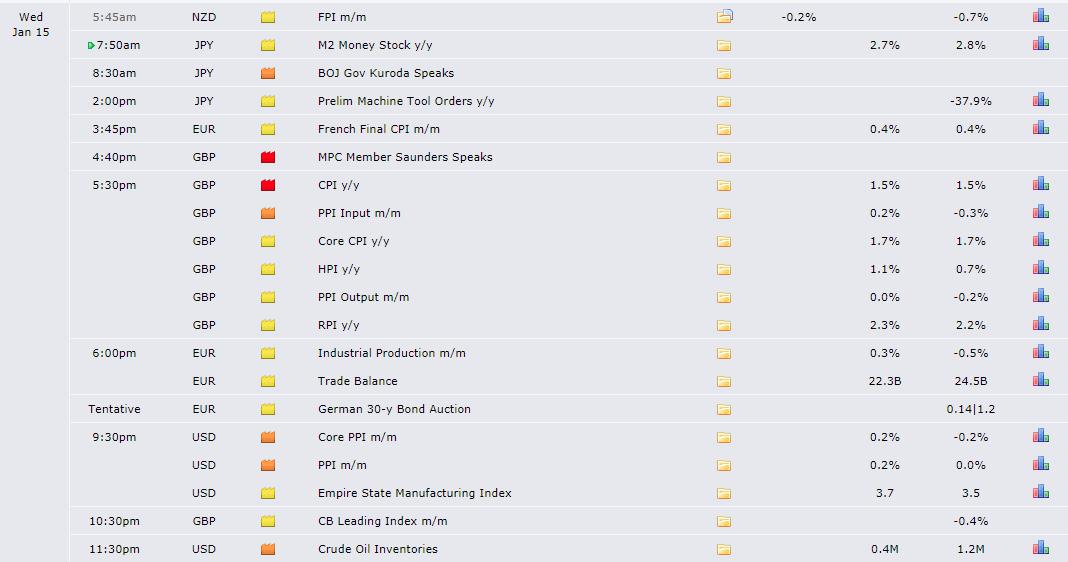
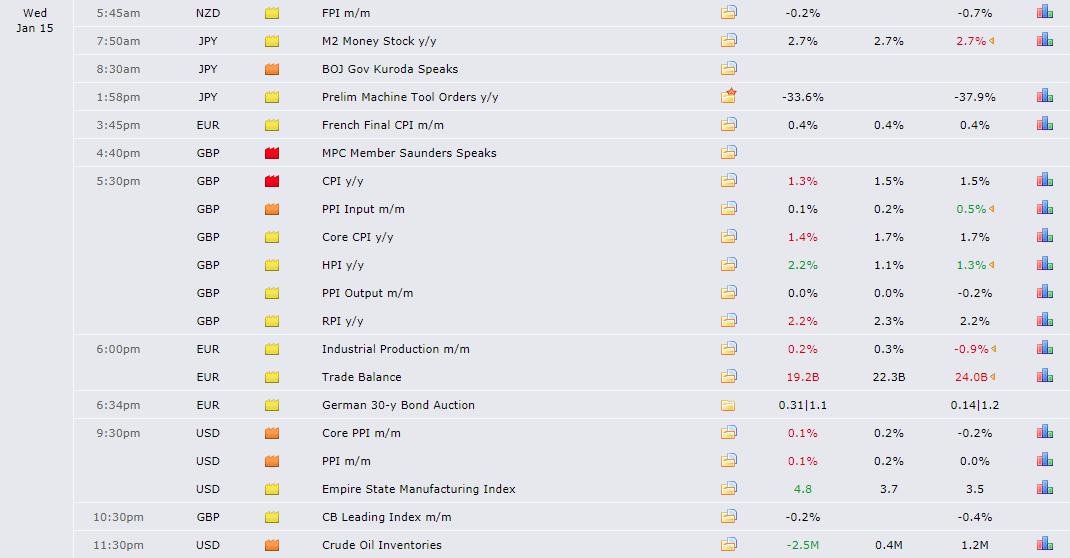
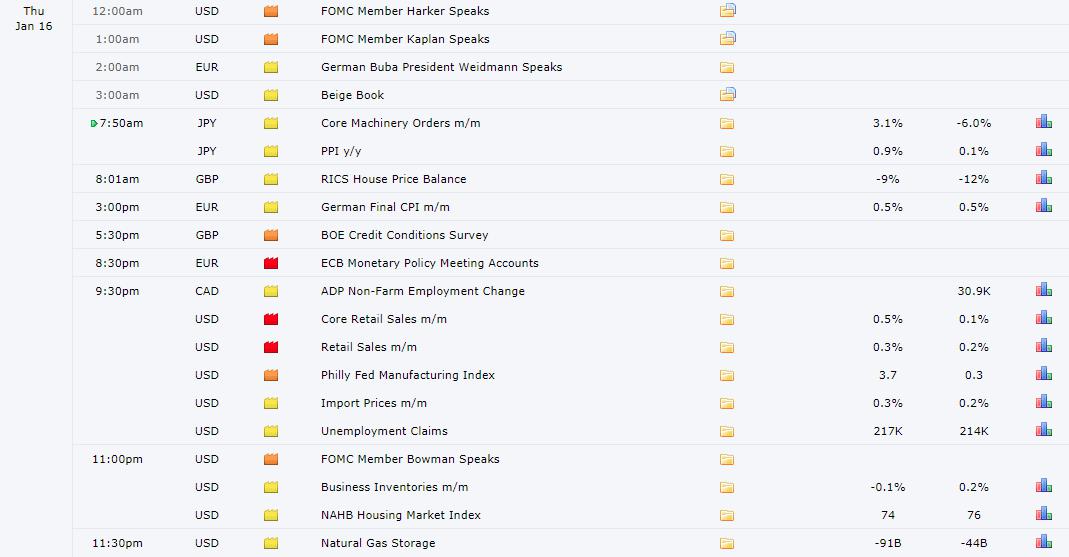
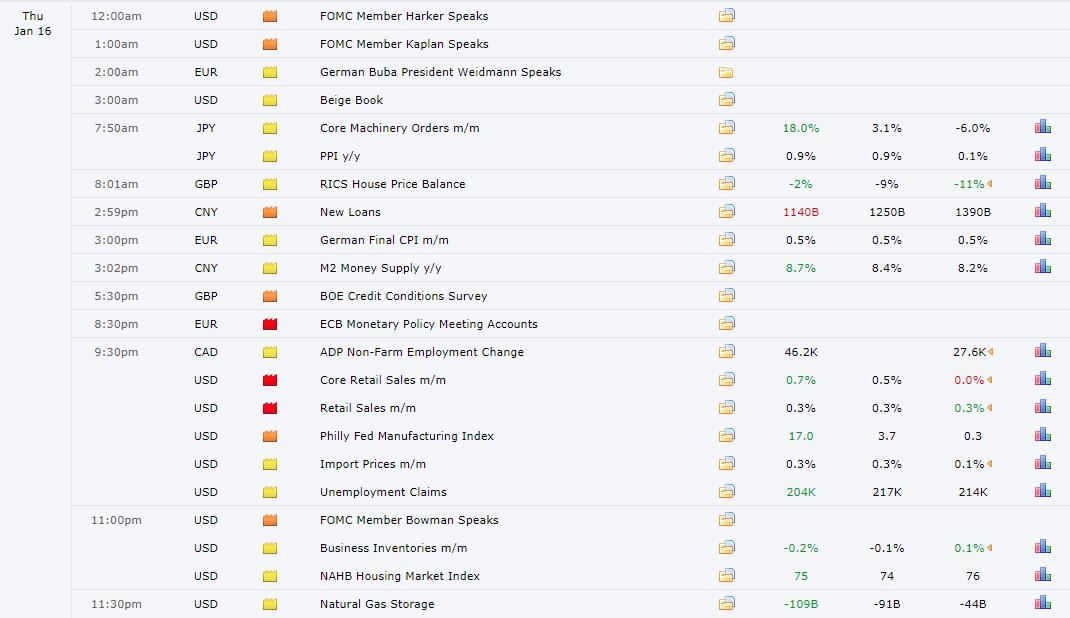
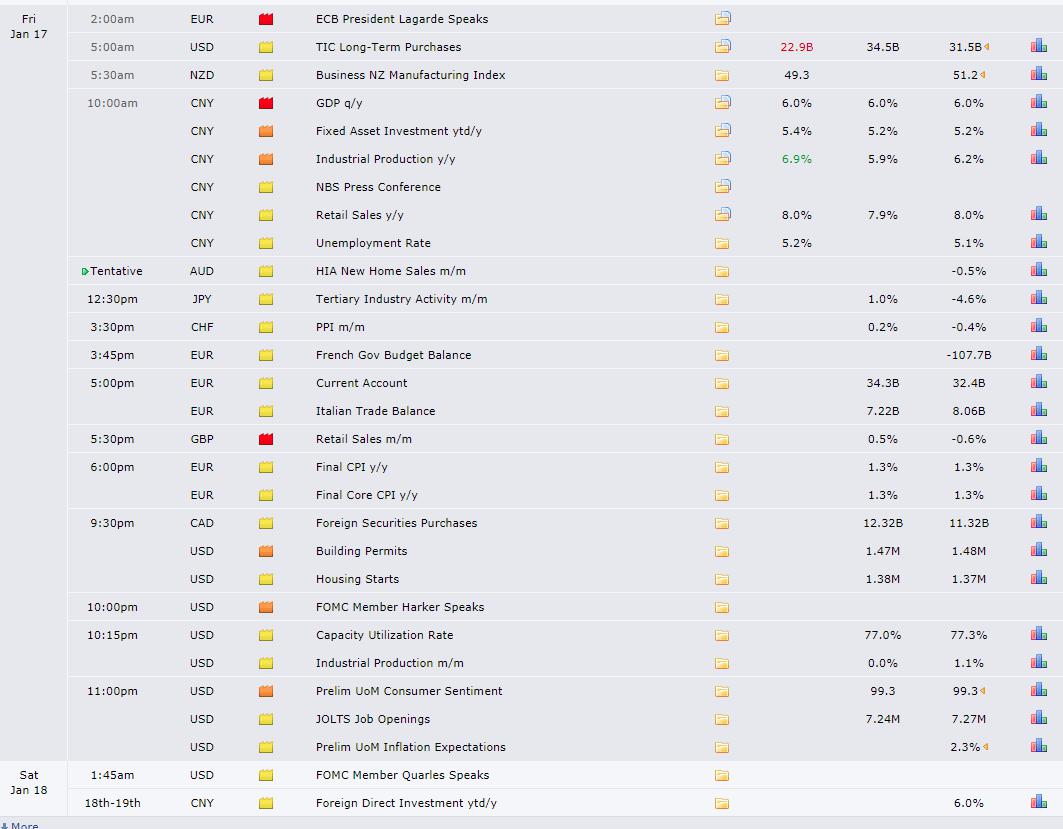
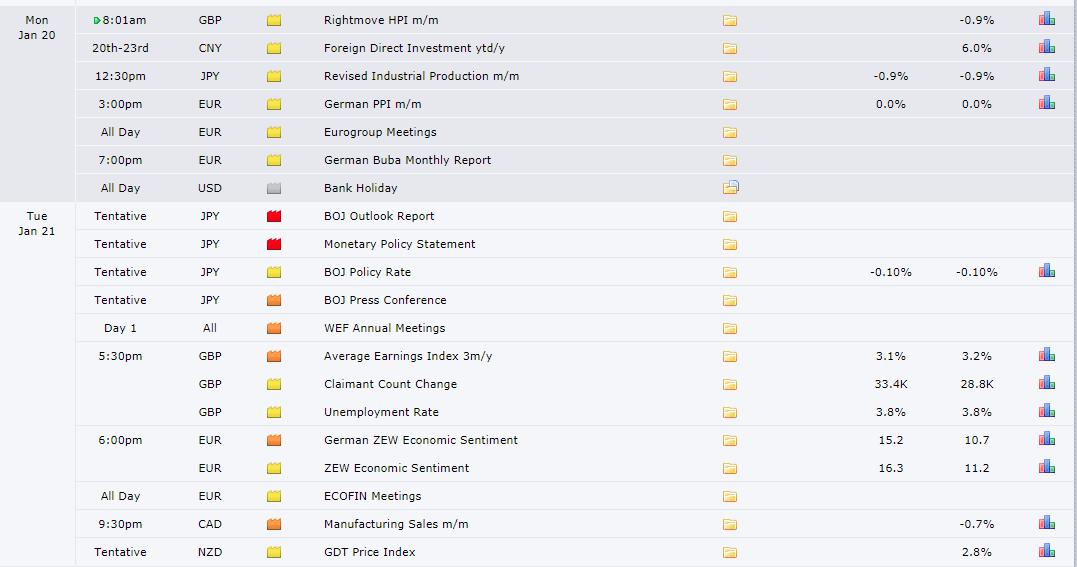
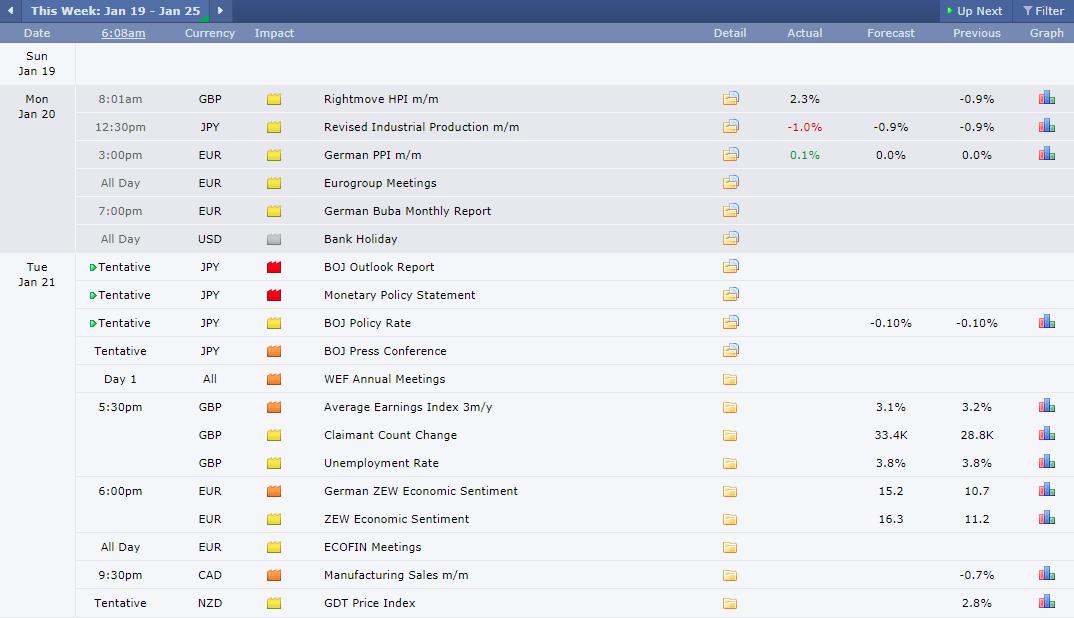
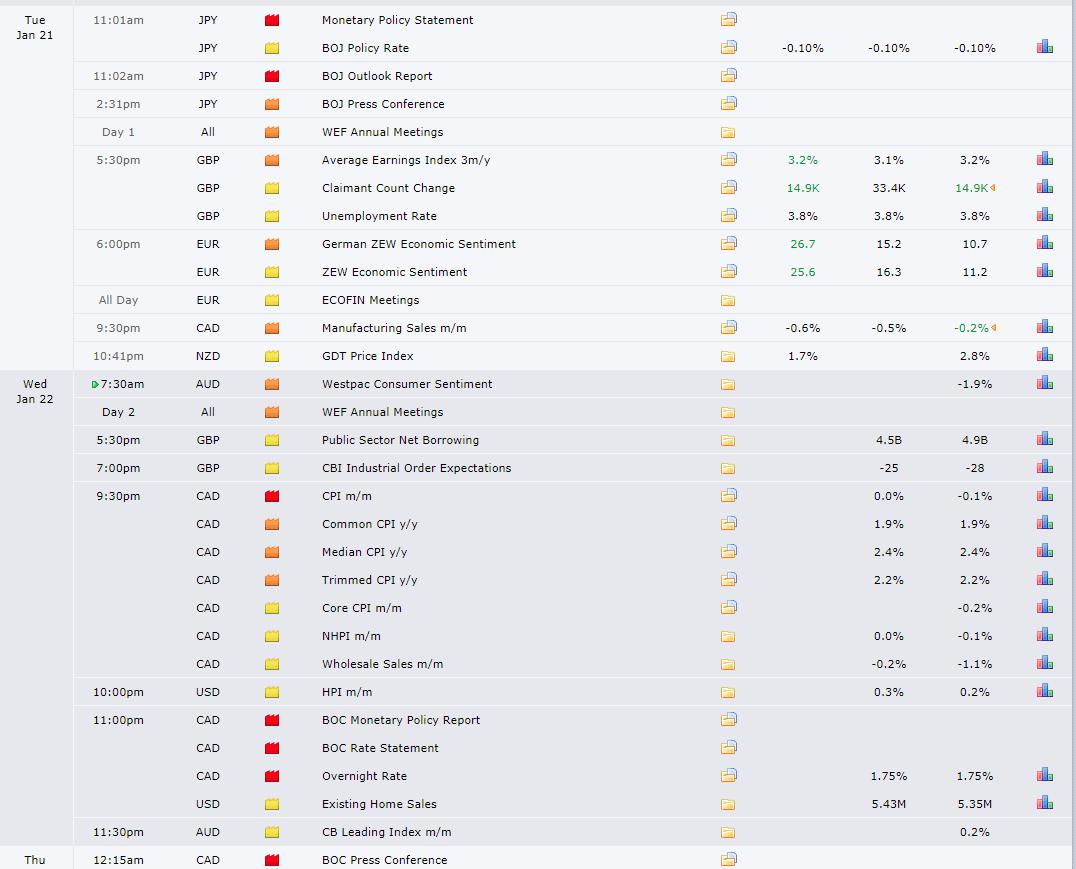
Recent Economic Indicators & Events Ahead
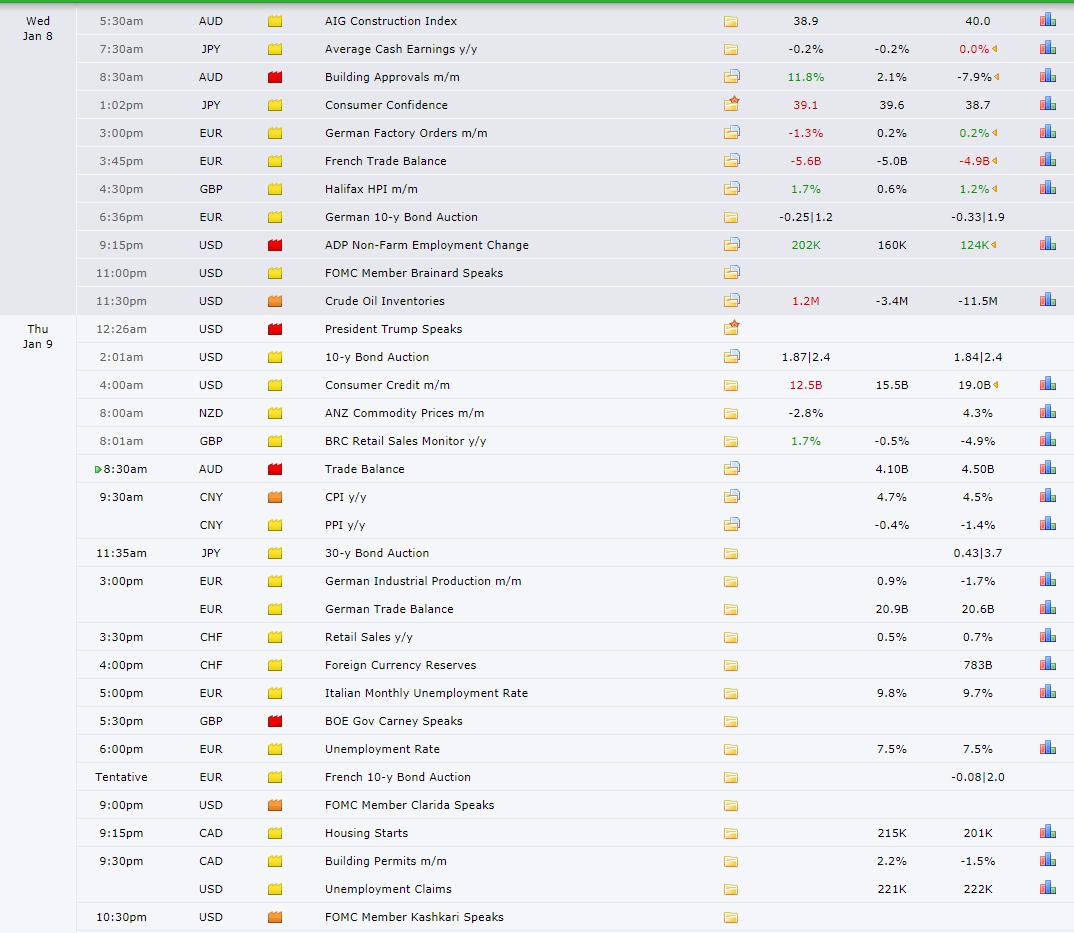
Source: Forexfactory
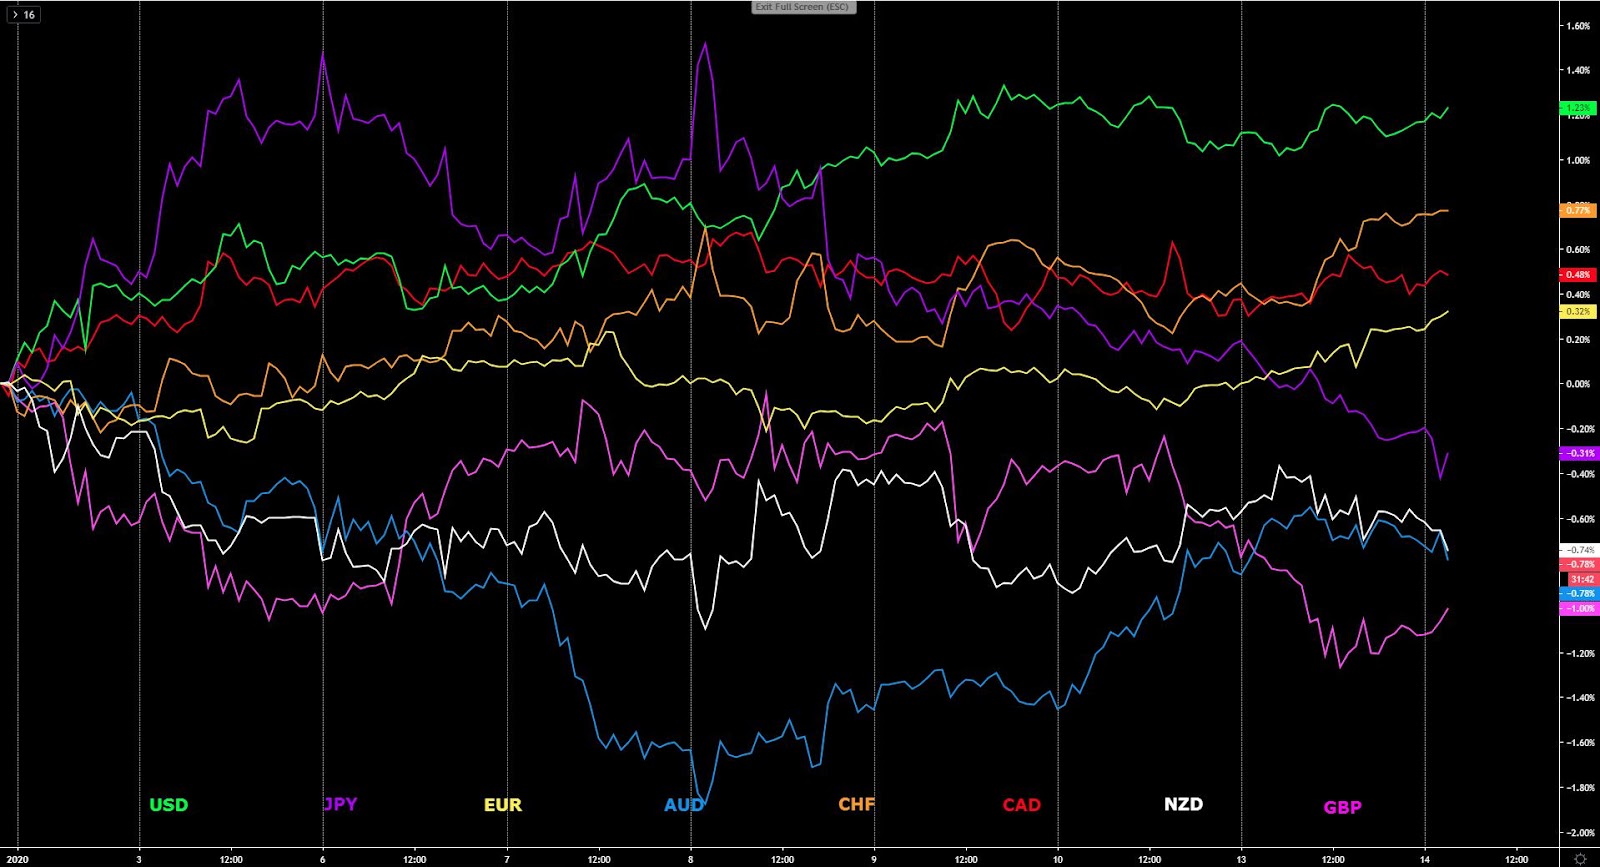
Insights Into FX Index Charts
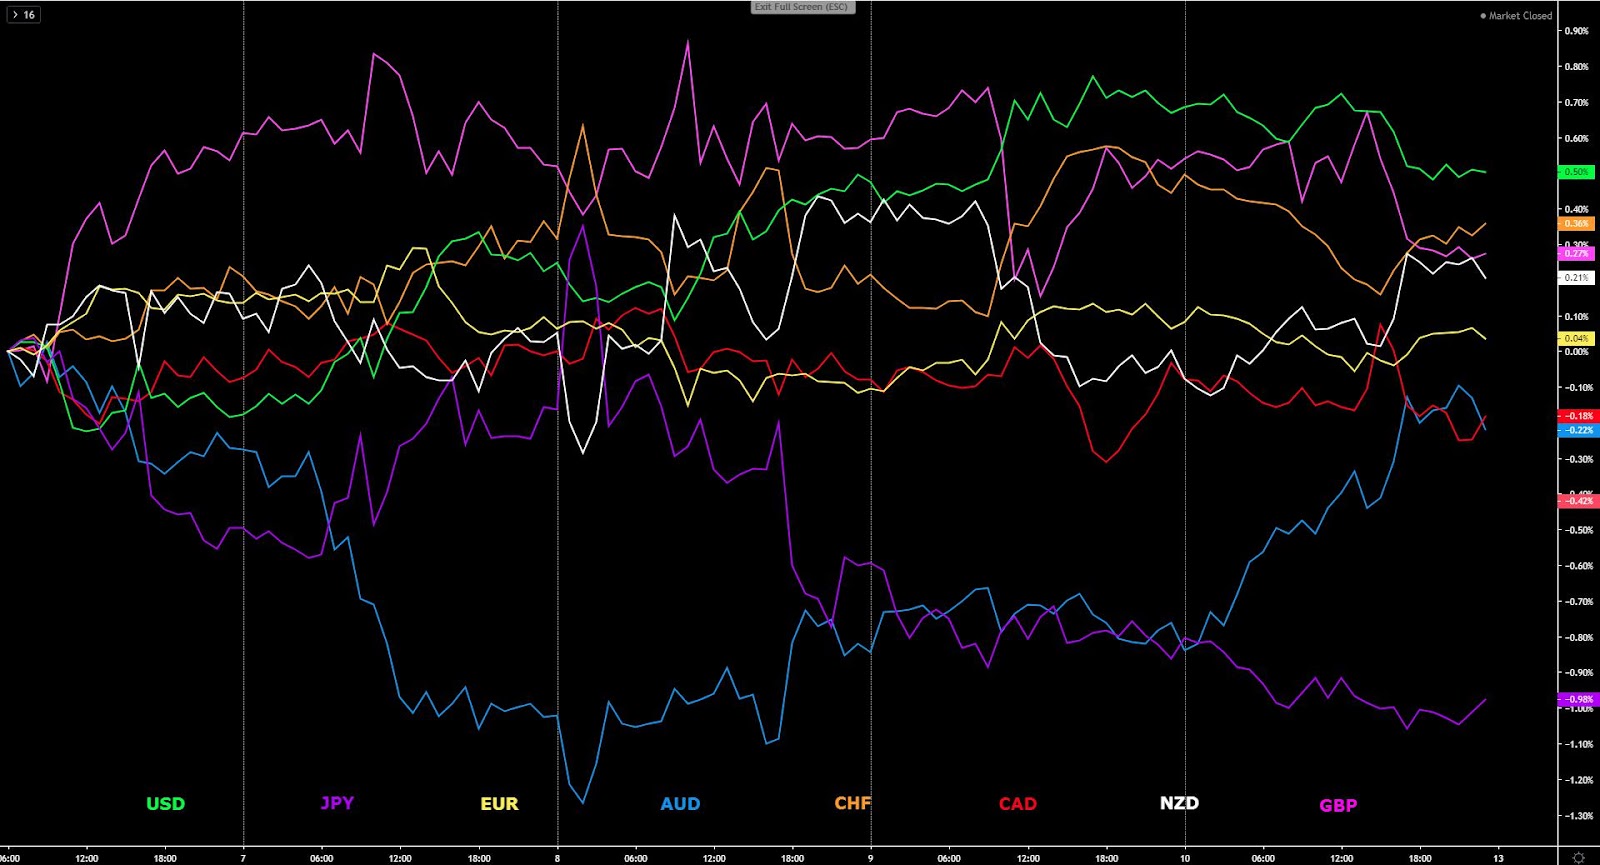
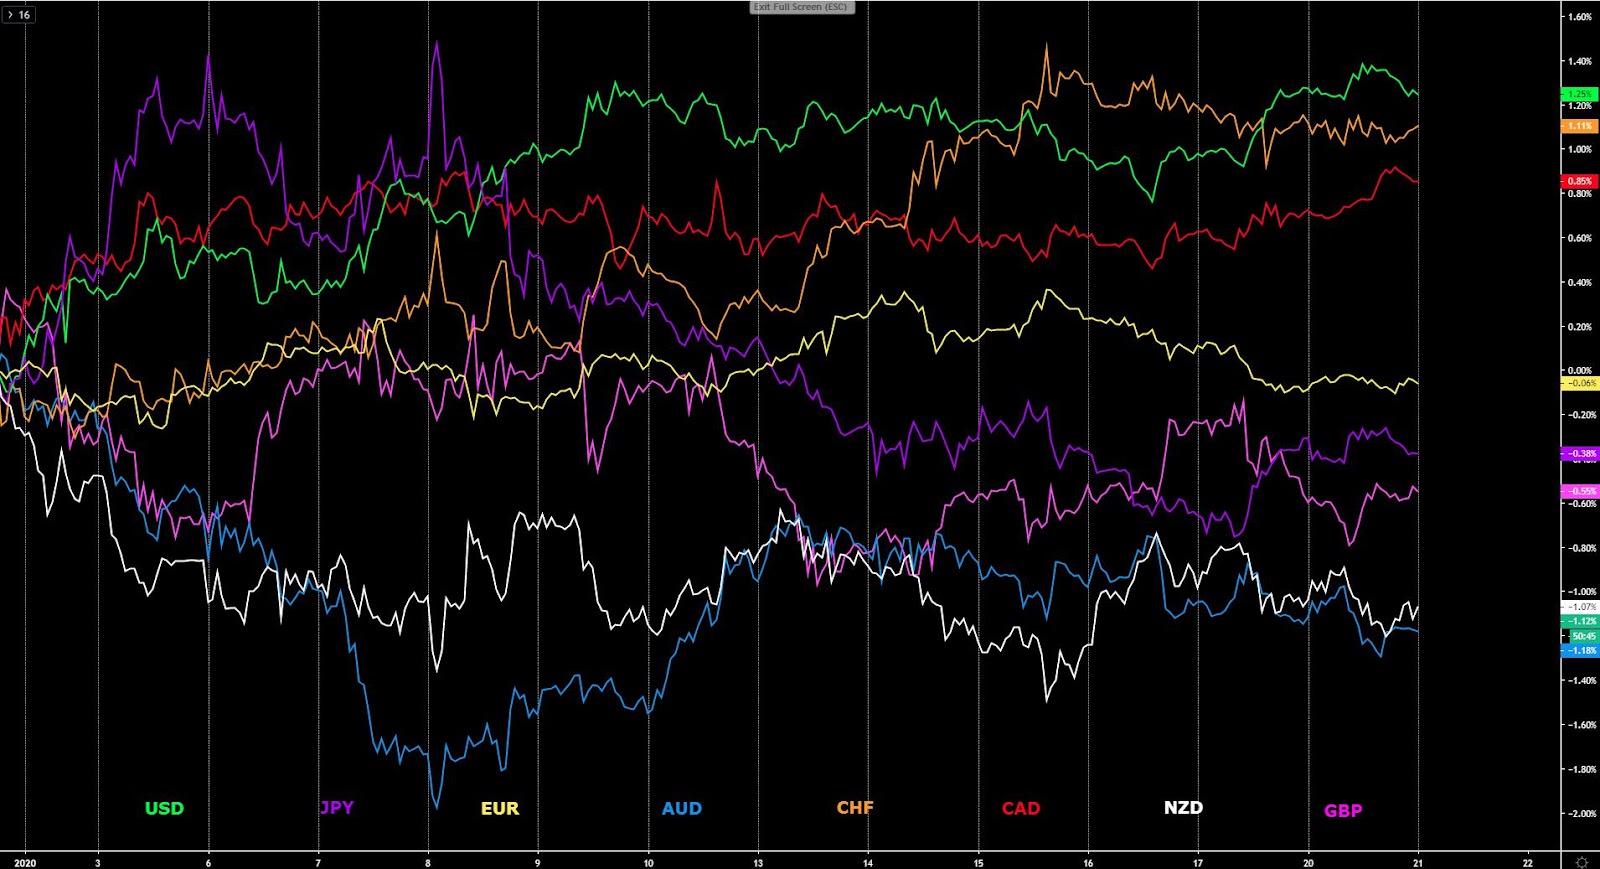
The indices show the performance of a particular currency vs G8 FX. An educational video on how to interpret these indices can be found in the Global Prime's Research section.
If you found the content in this section valuable, give us a share by just clicking here!
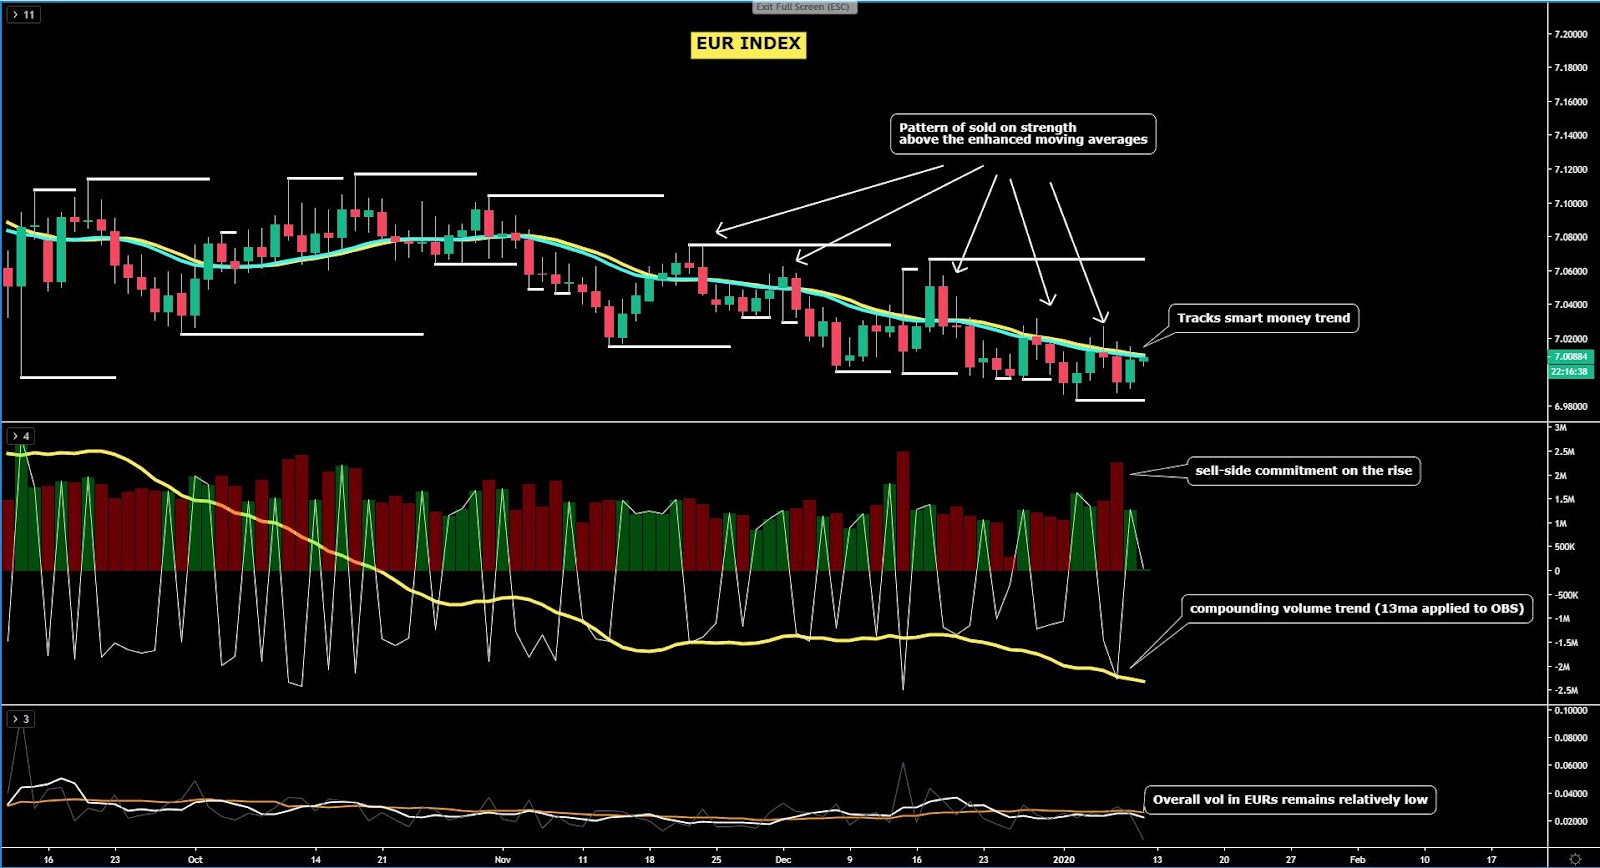
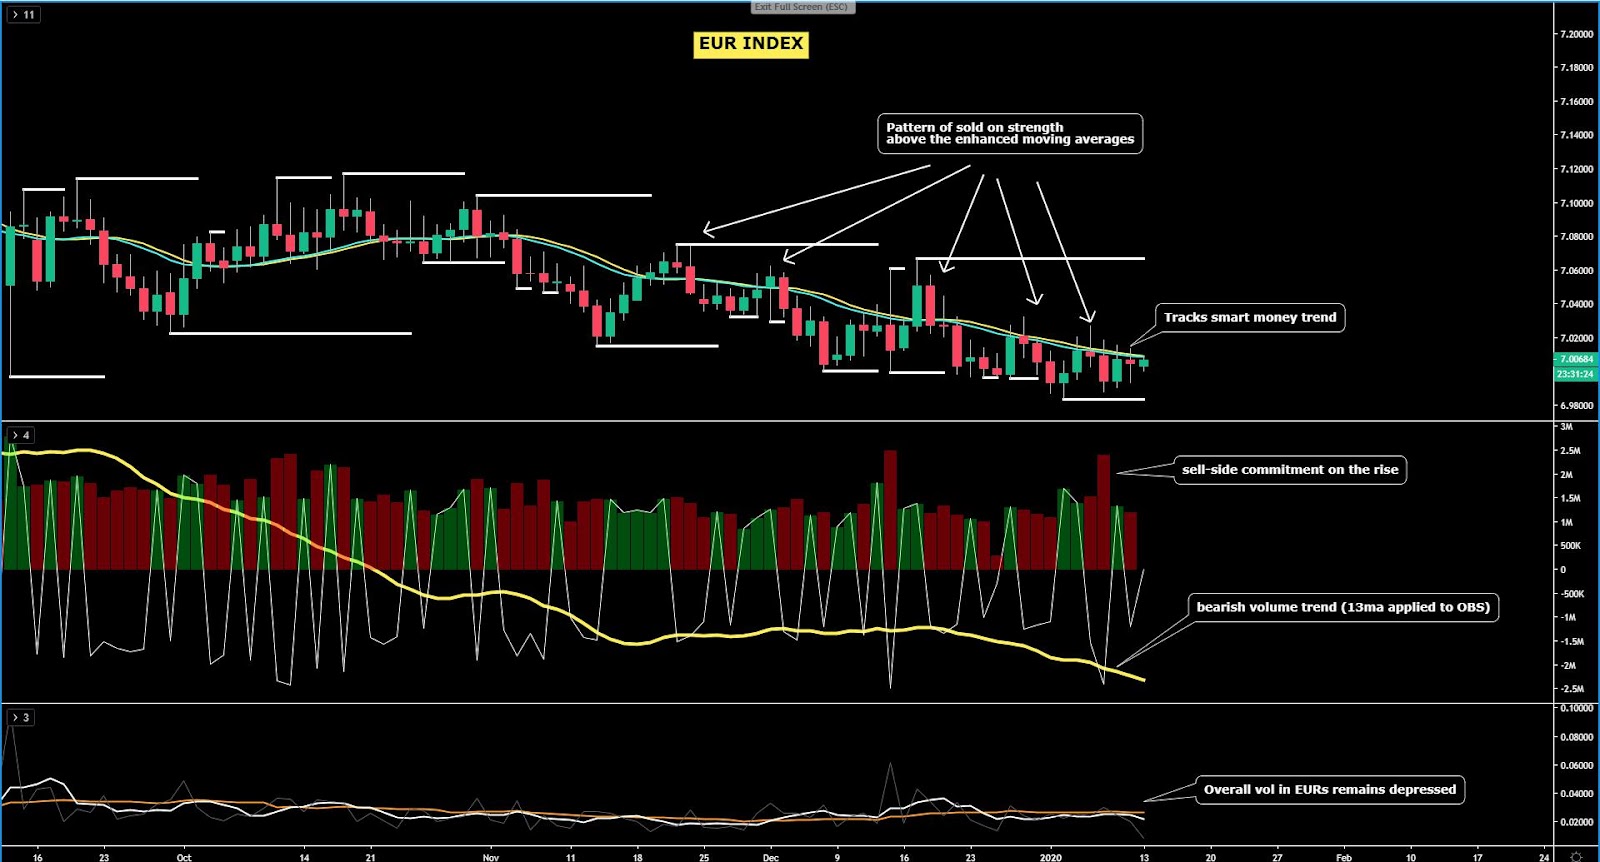
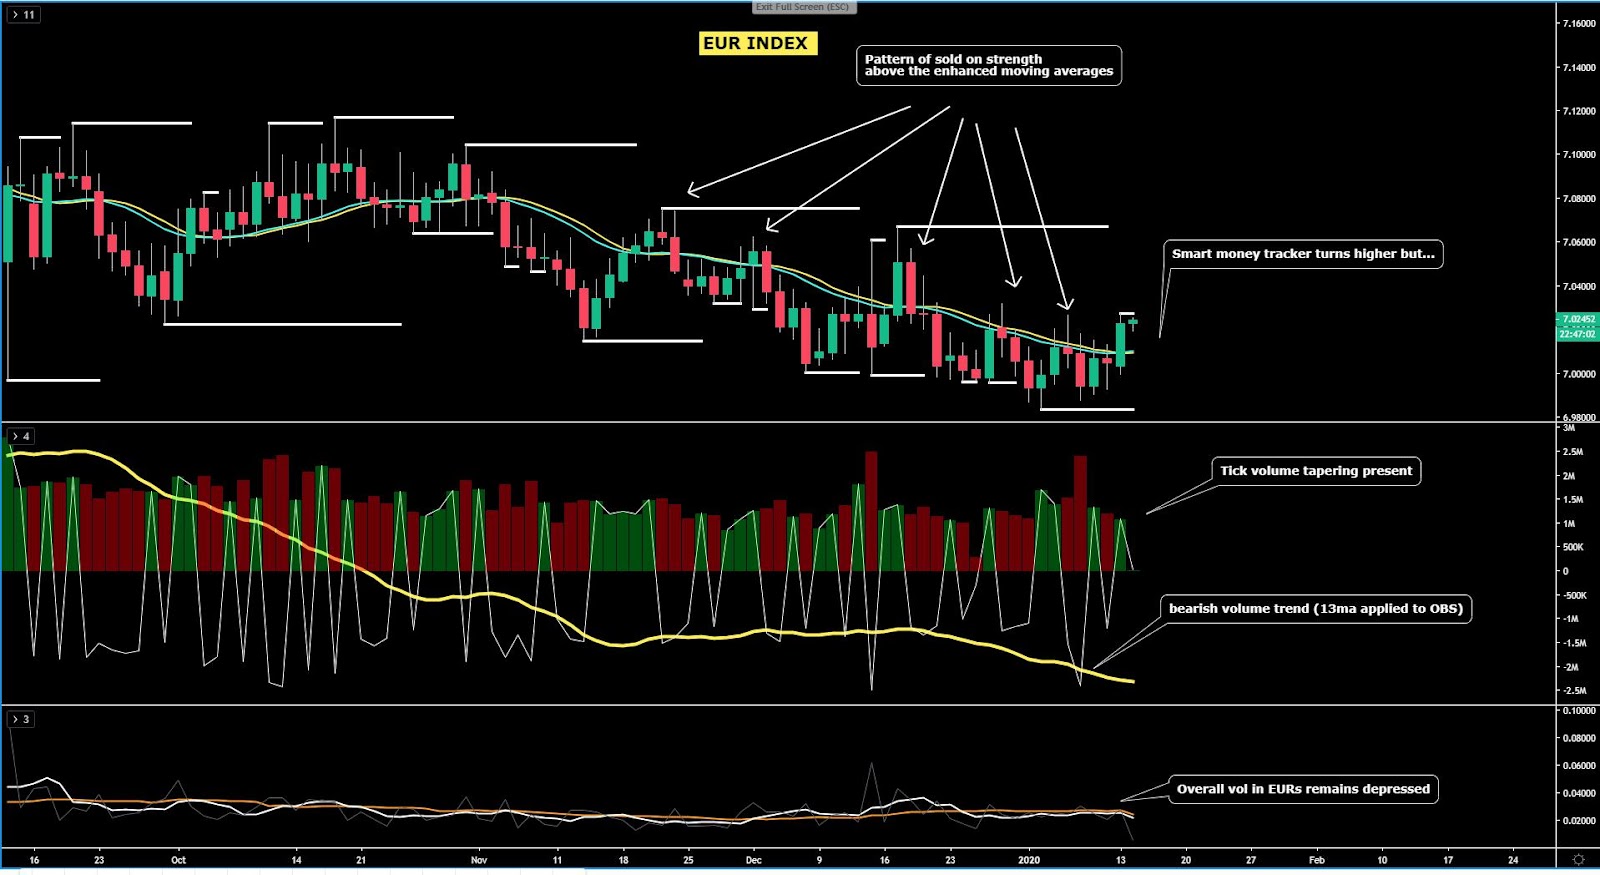
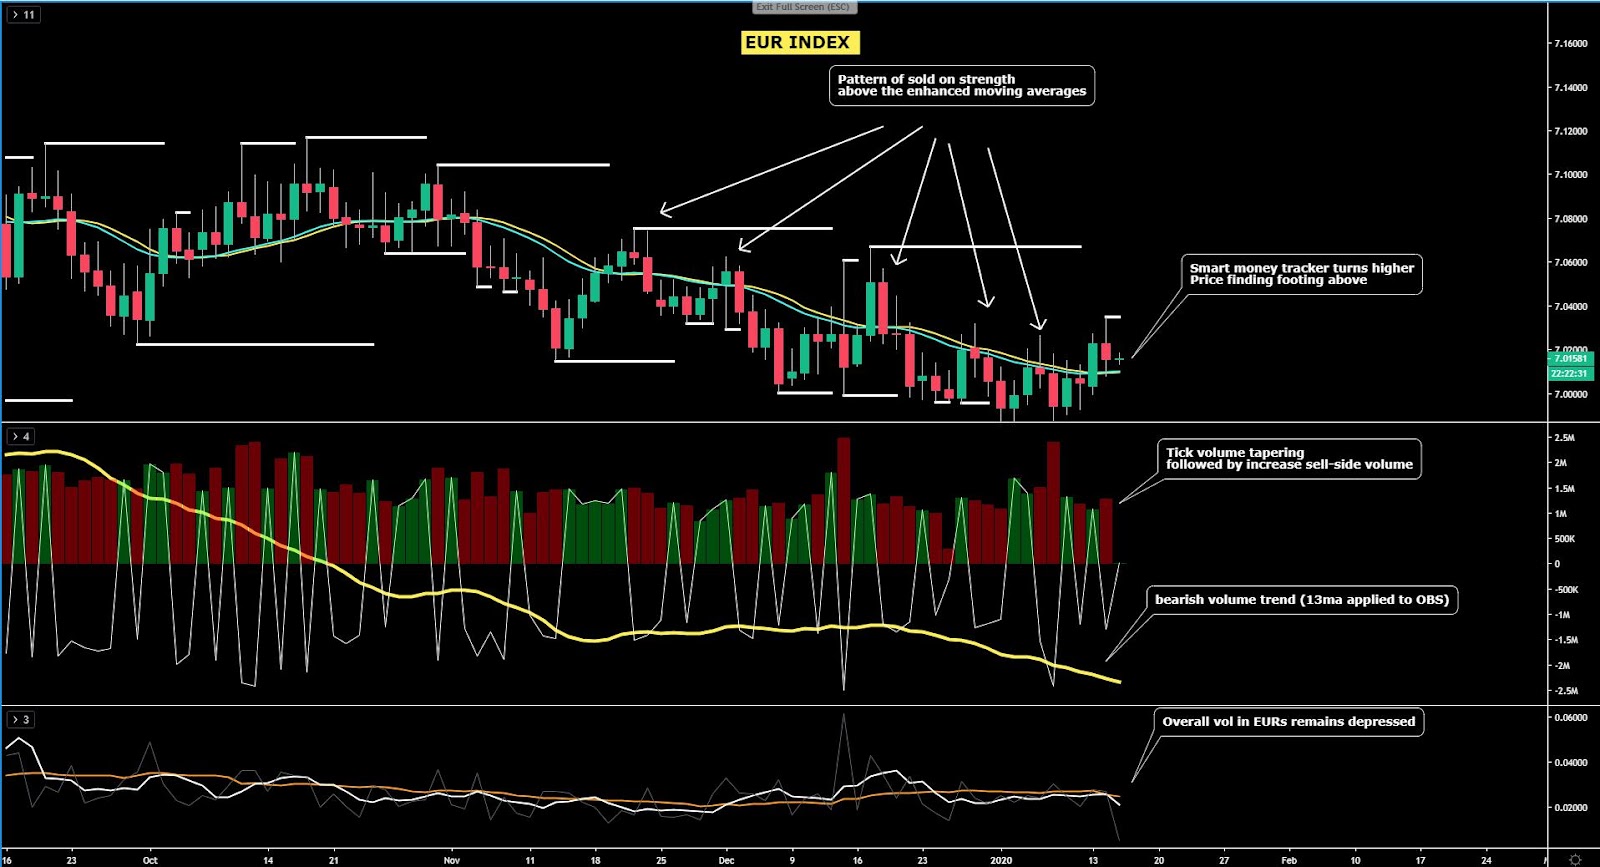
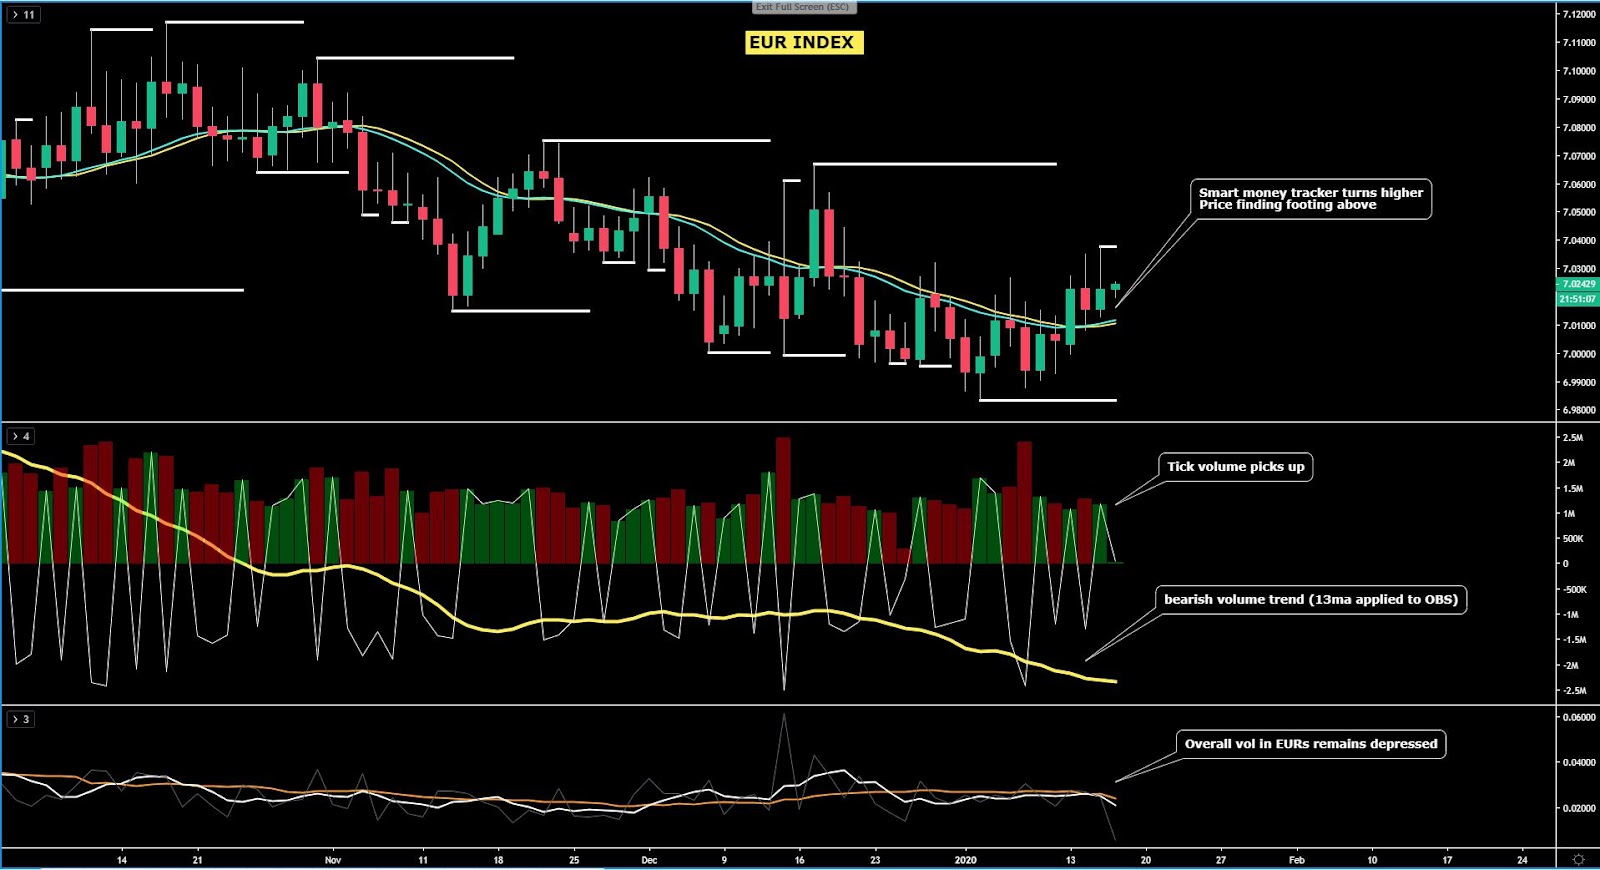
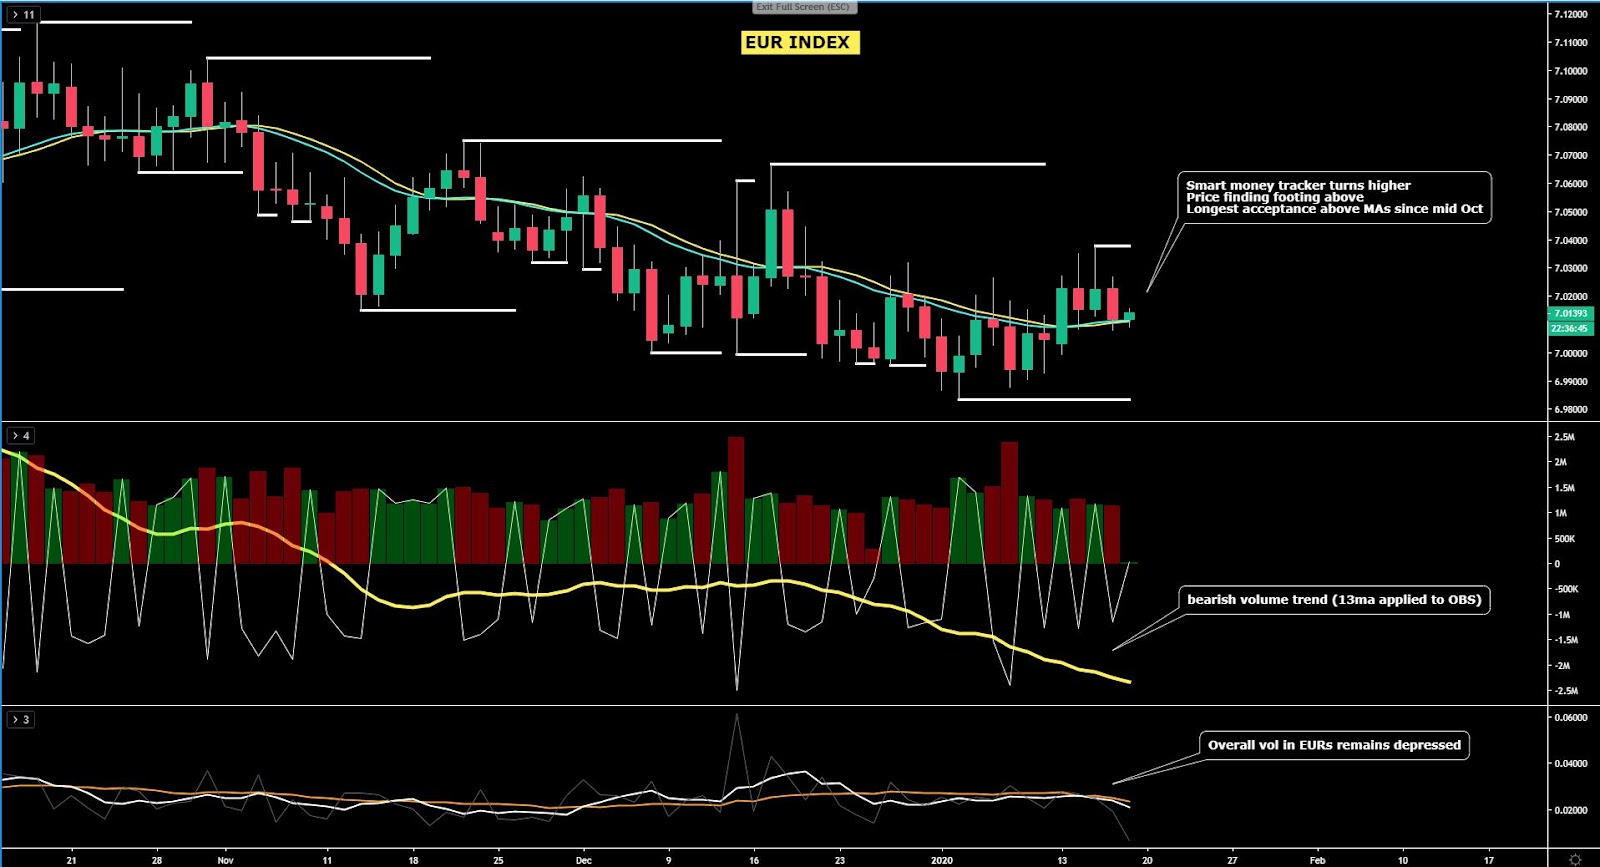
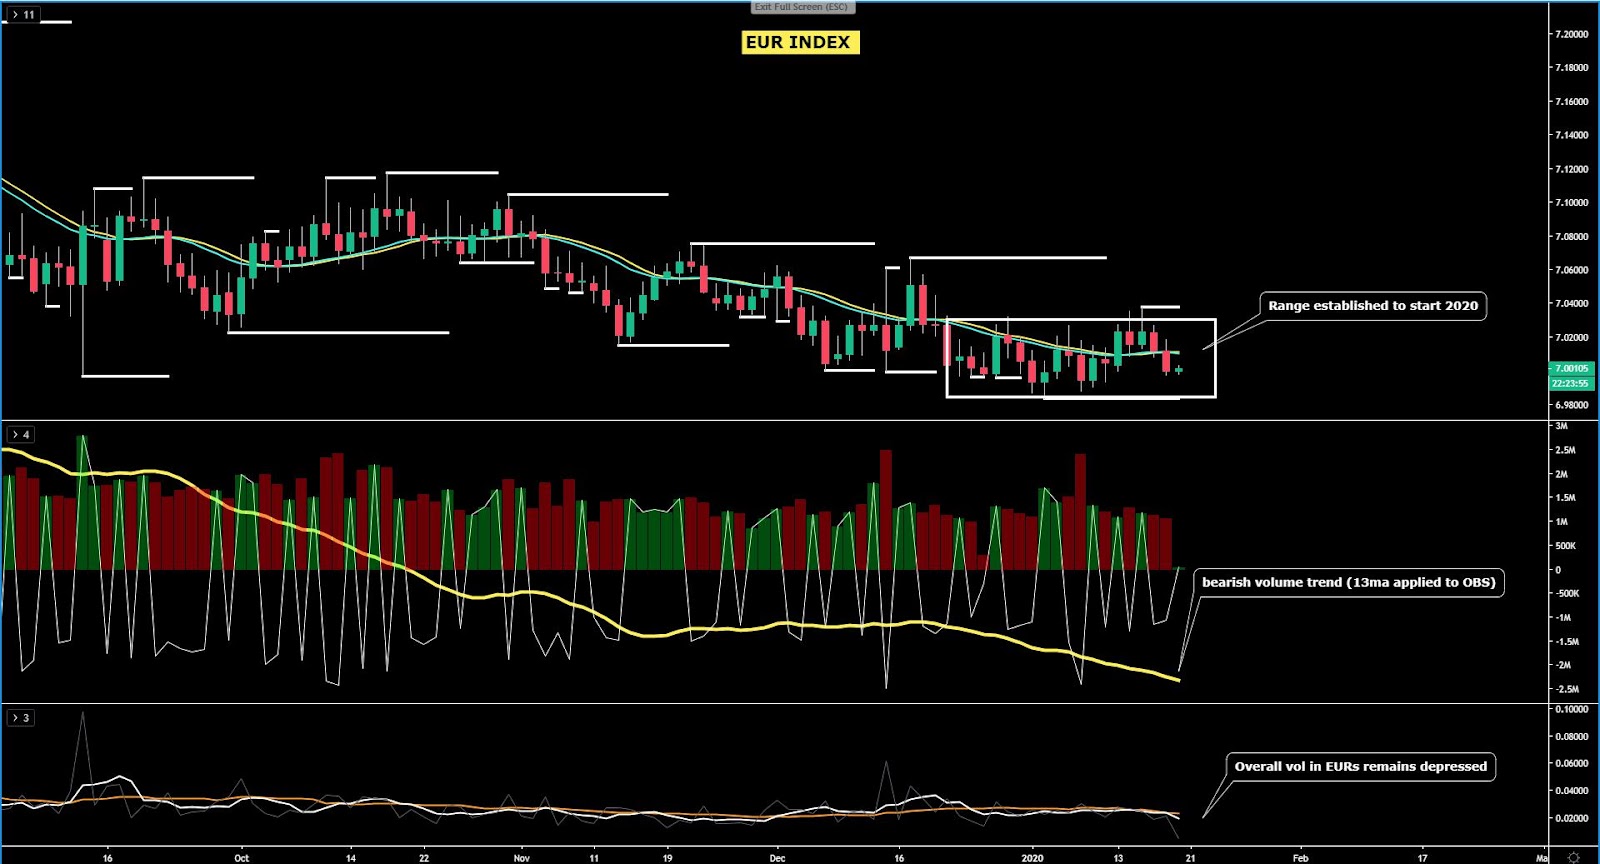
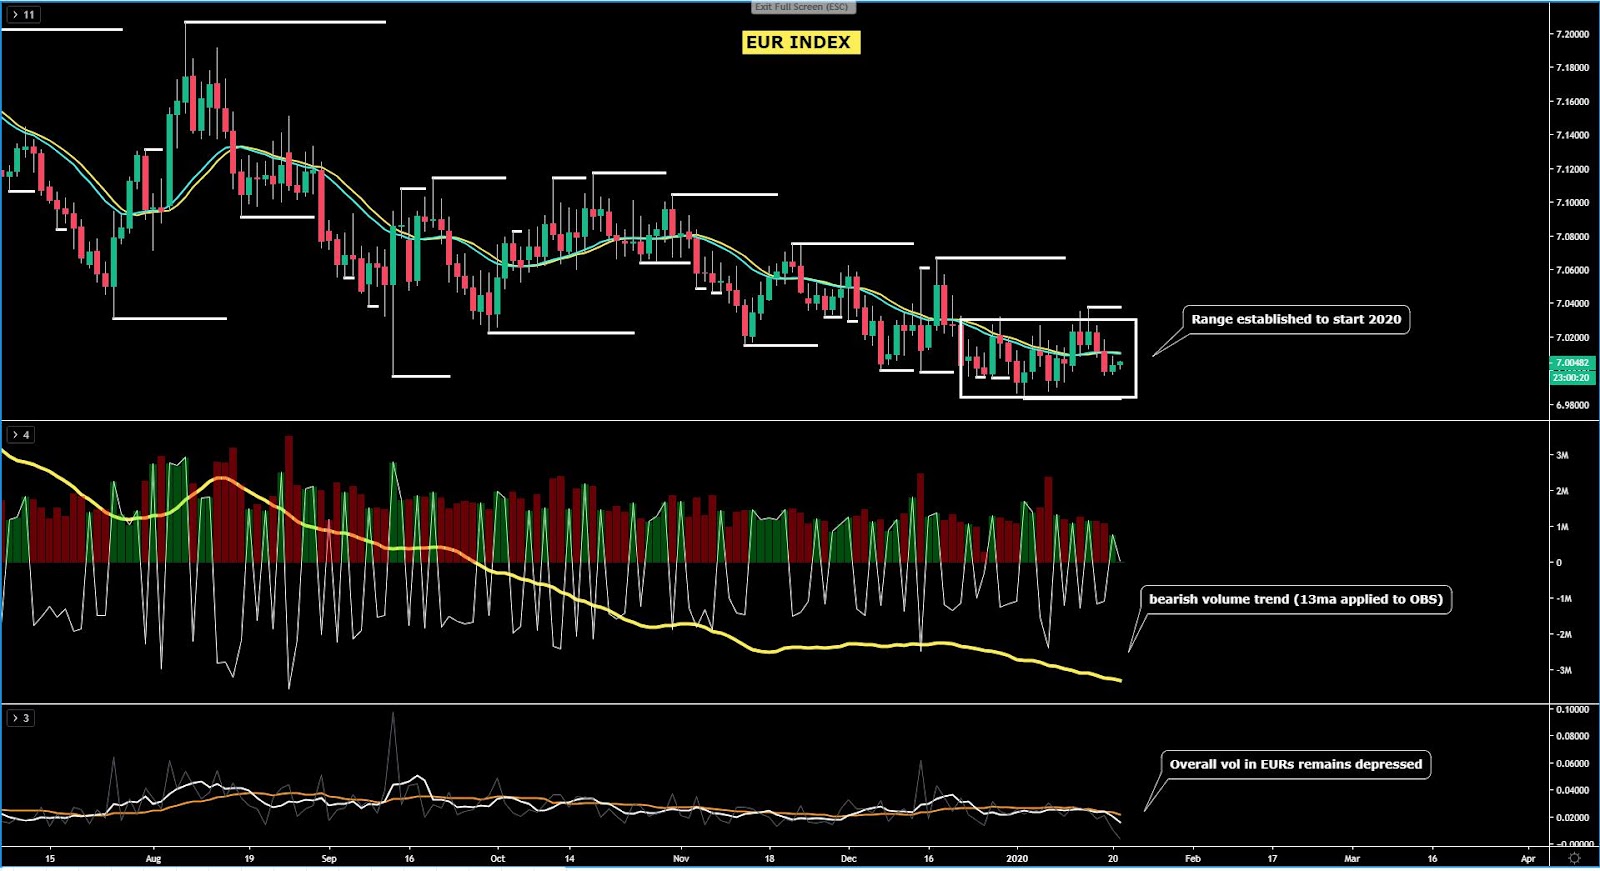
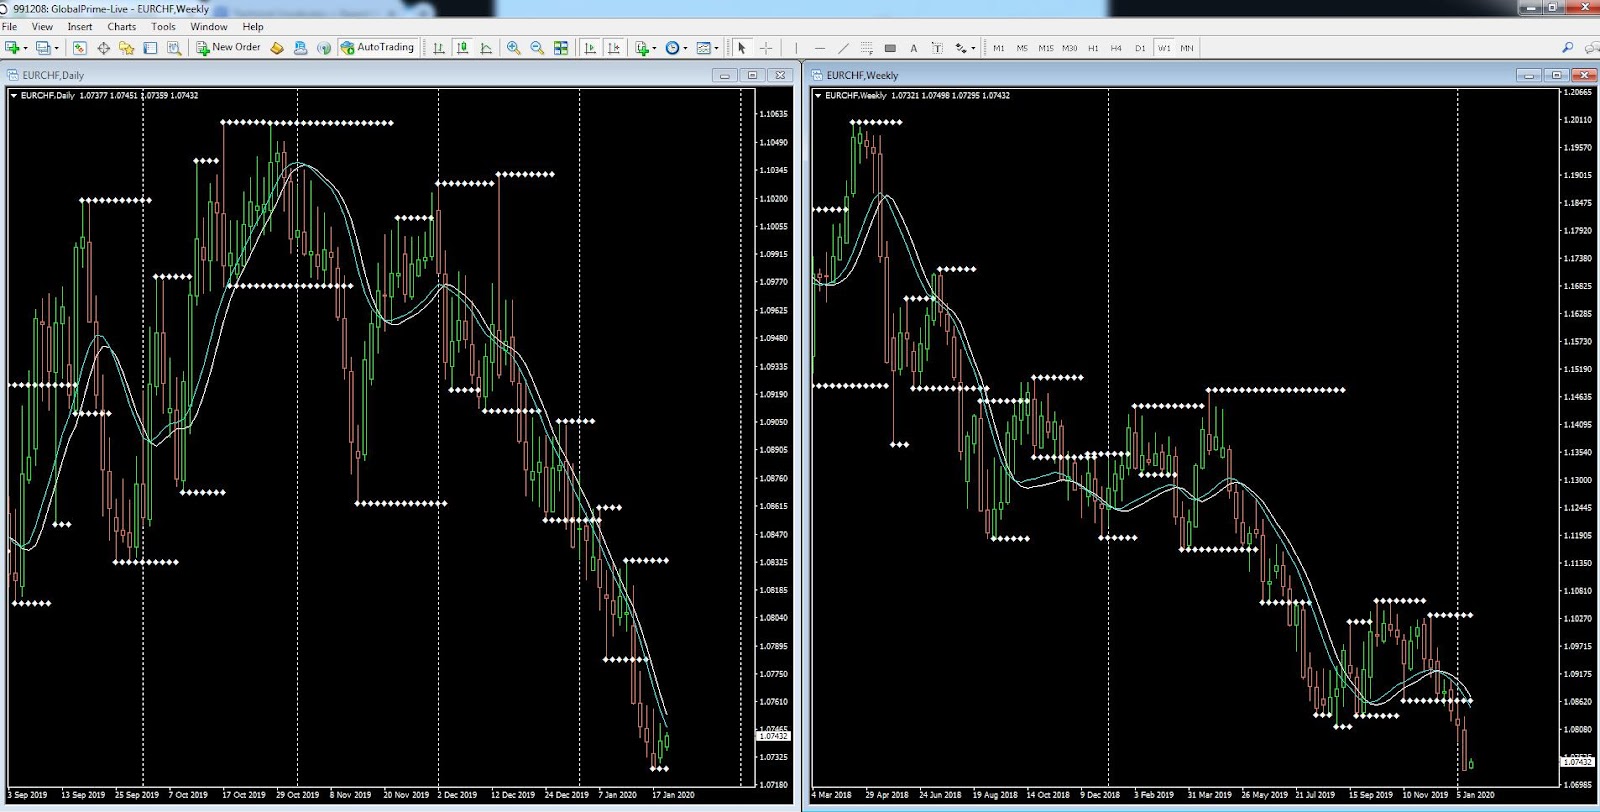
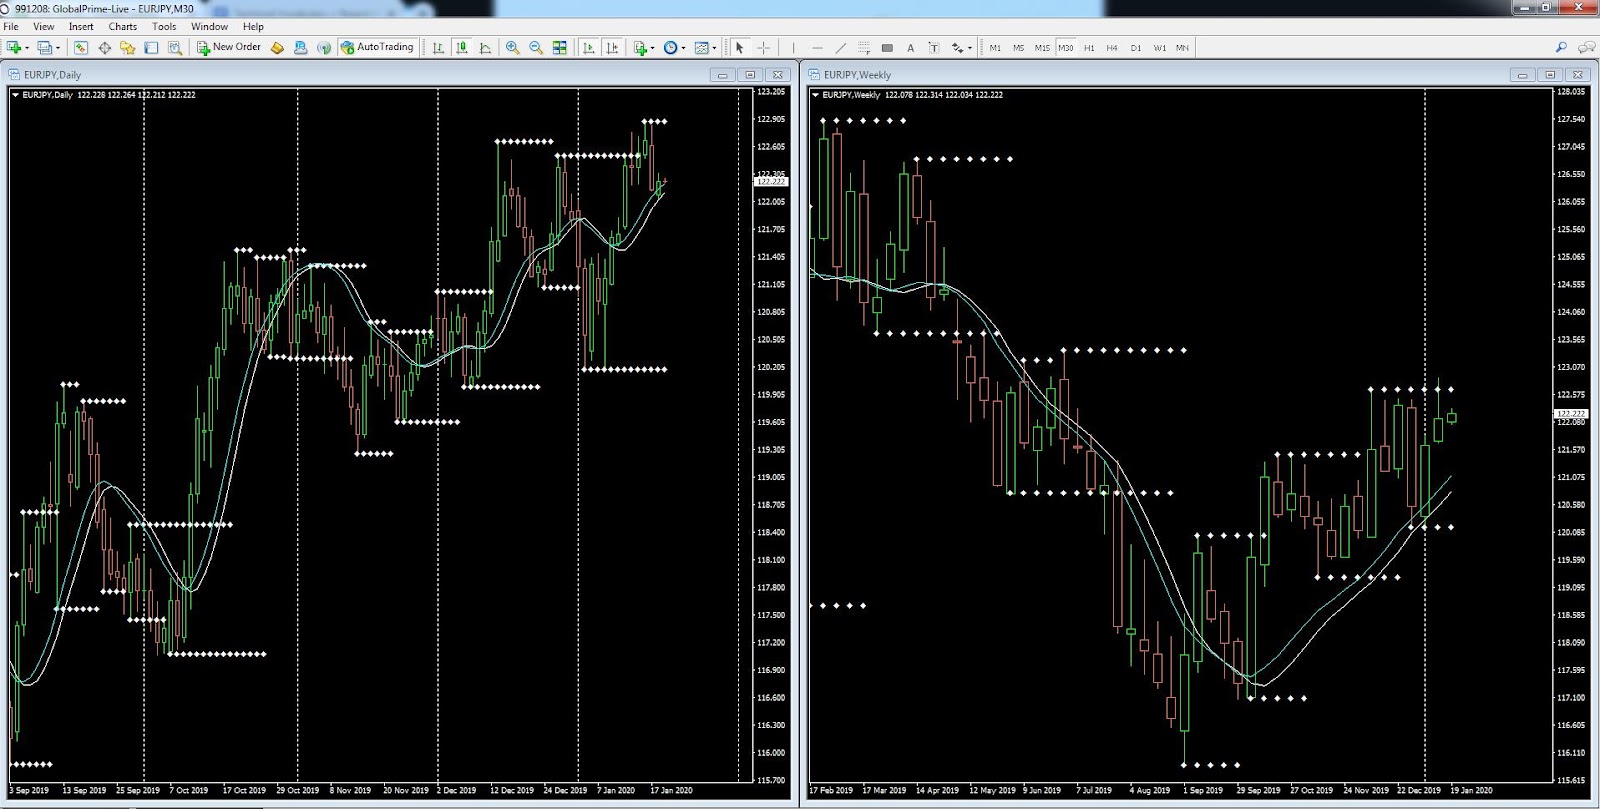
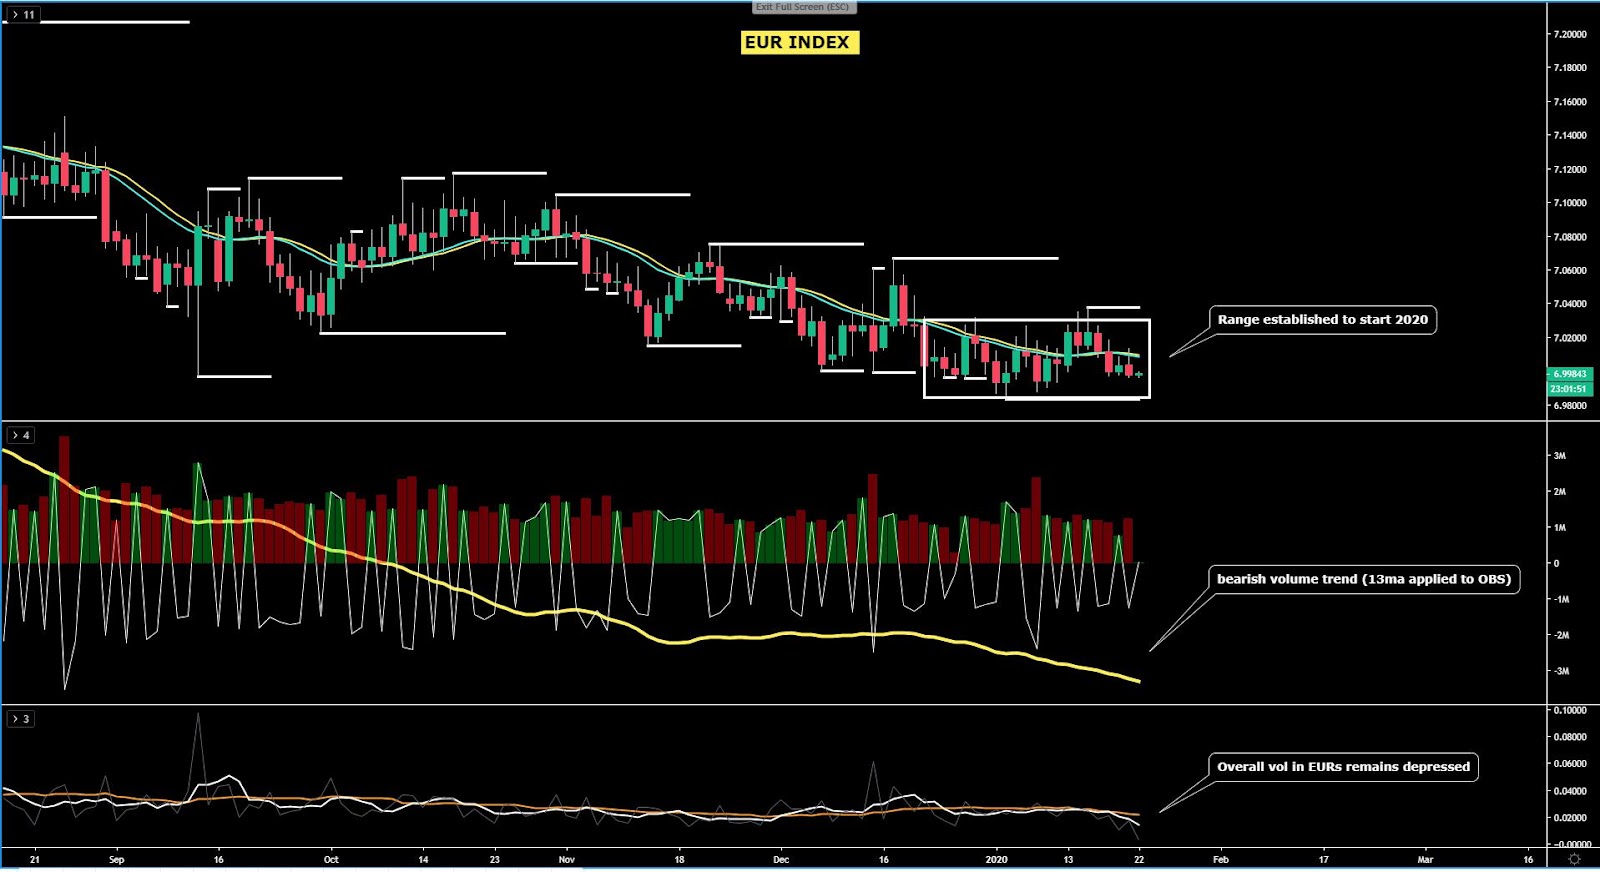
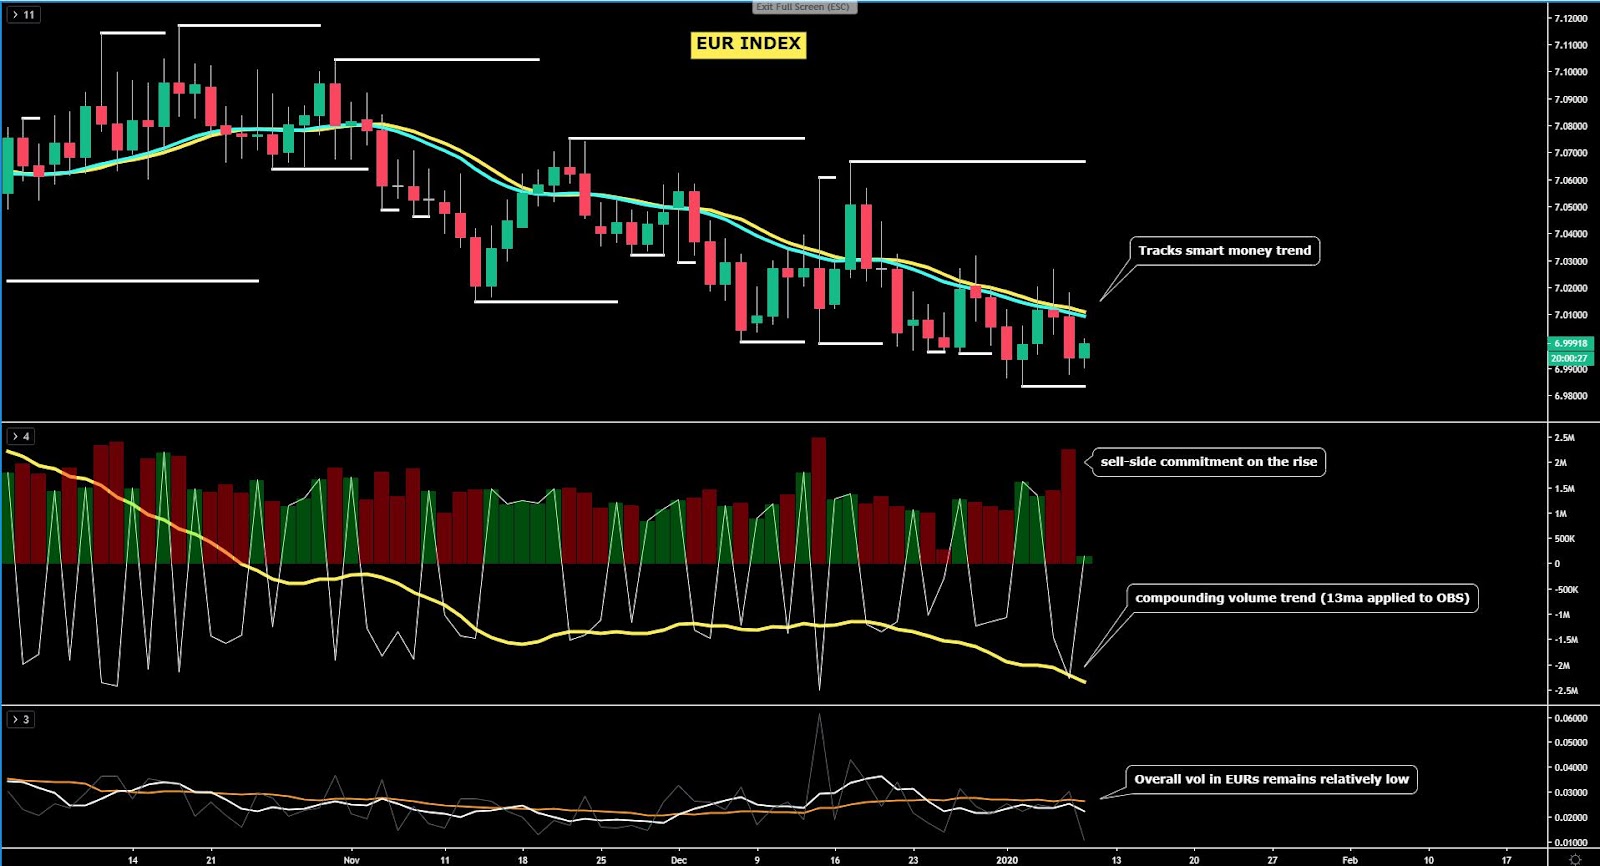
The EUR index has kicked off 2020 with analogous bearish tendencies as it closed last year, with the pressure to the downside not abating, even if similarly, deep downward extension are failing. Notice, in the last window, the actual 5-day vol remains below the monthly vol average. The bear trend remains validated by both the market structure and the enhanced moving averages as a proxy to understand dominant smart money flows. Wednesday's daily candle portrays sell-side commitment increasing as reflected by the spike in aggregate tick volume activity, which occurs in the context of a bear trend in compounded volume (see 13ema applied to OBV). It’s worth also remembering that the EUR seasonal pattern in Jan is very negative.
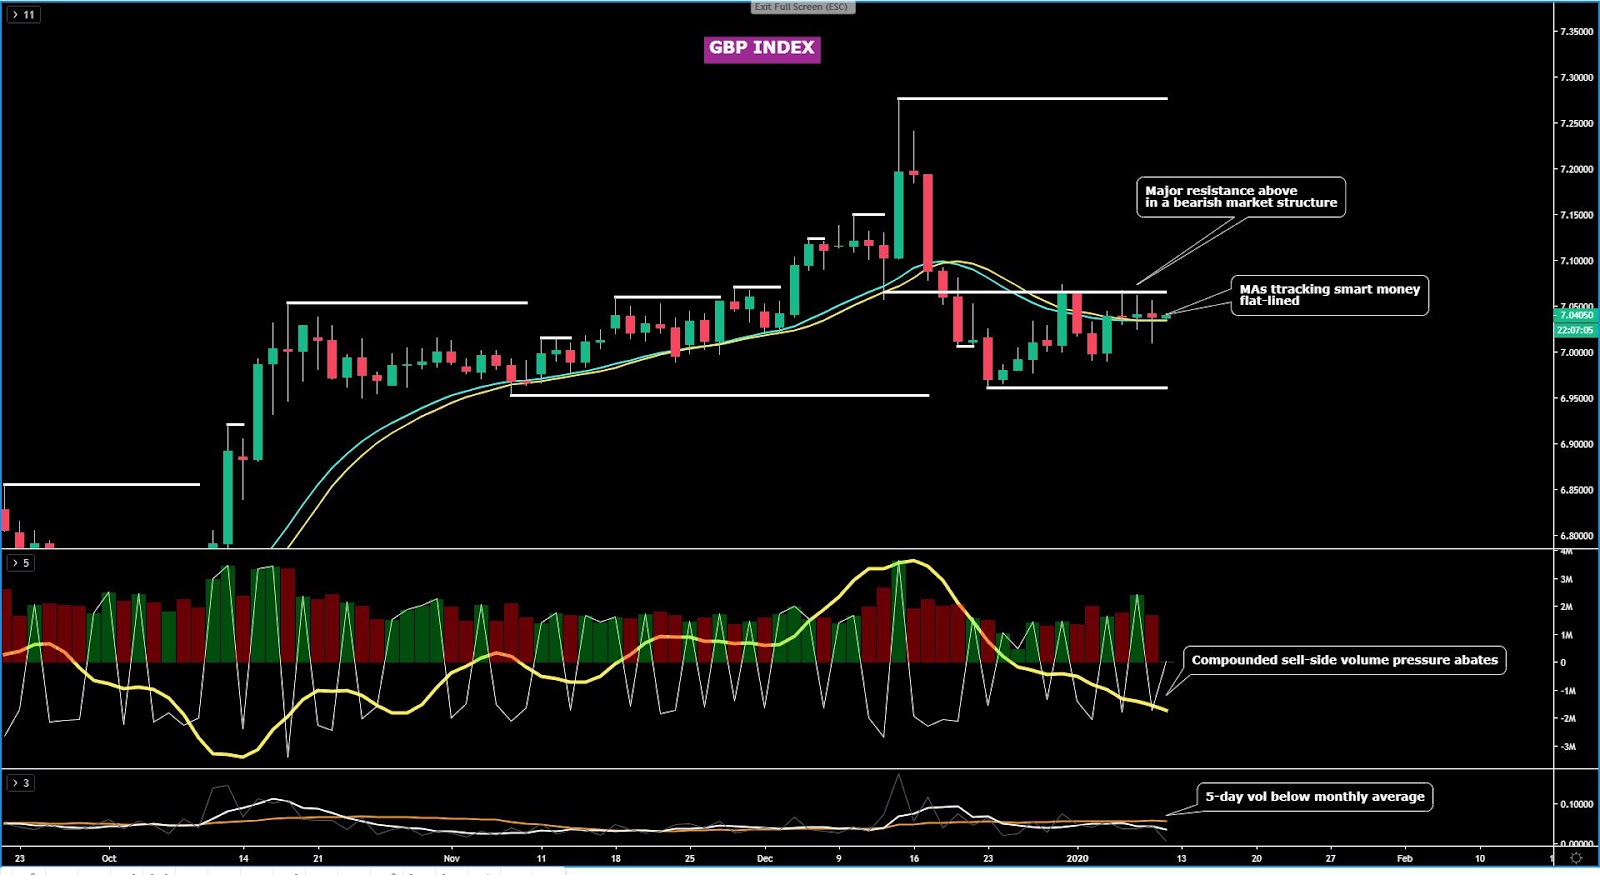
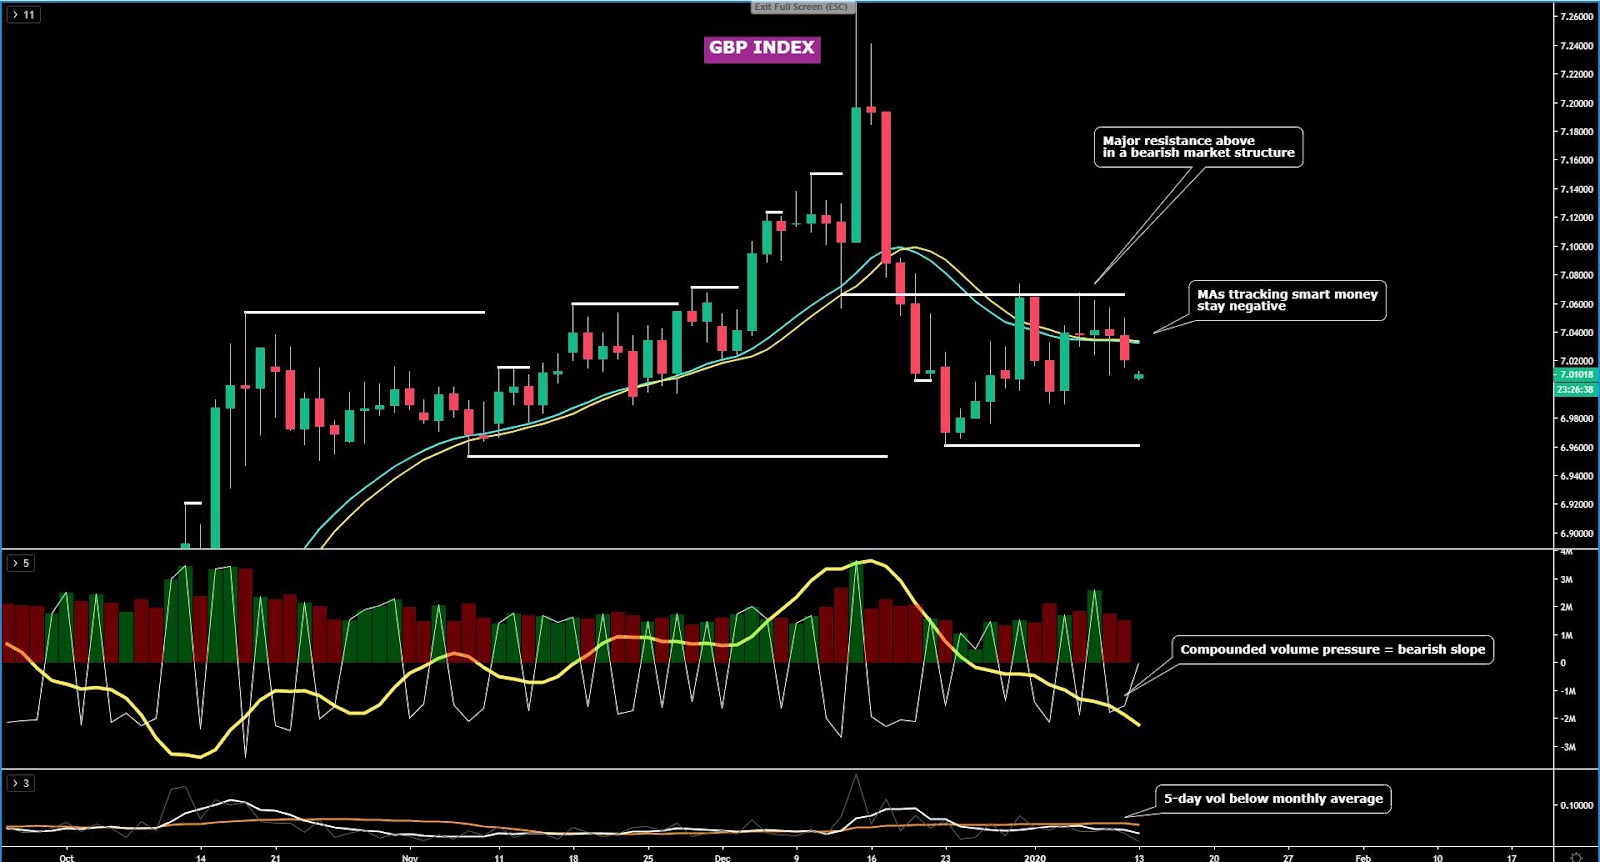
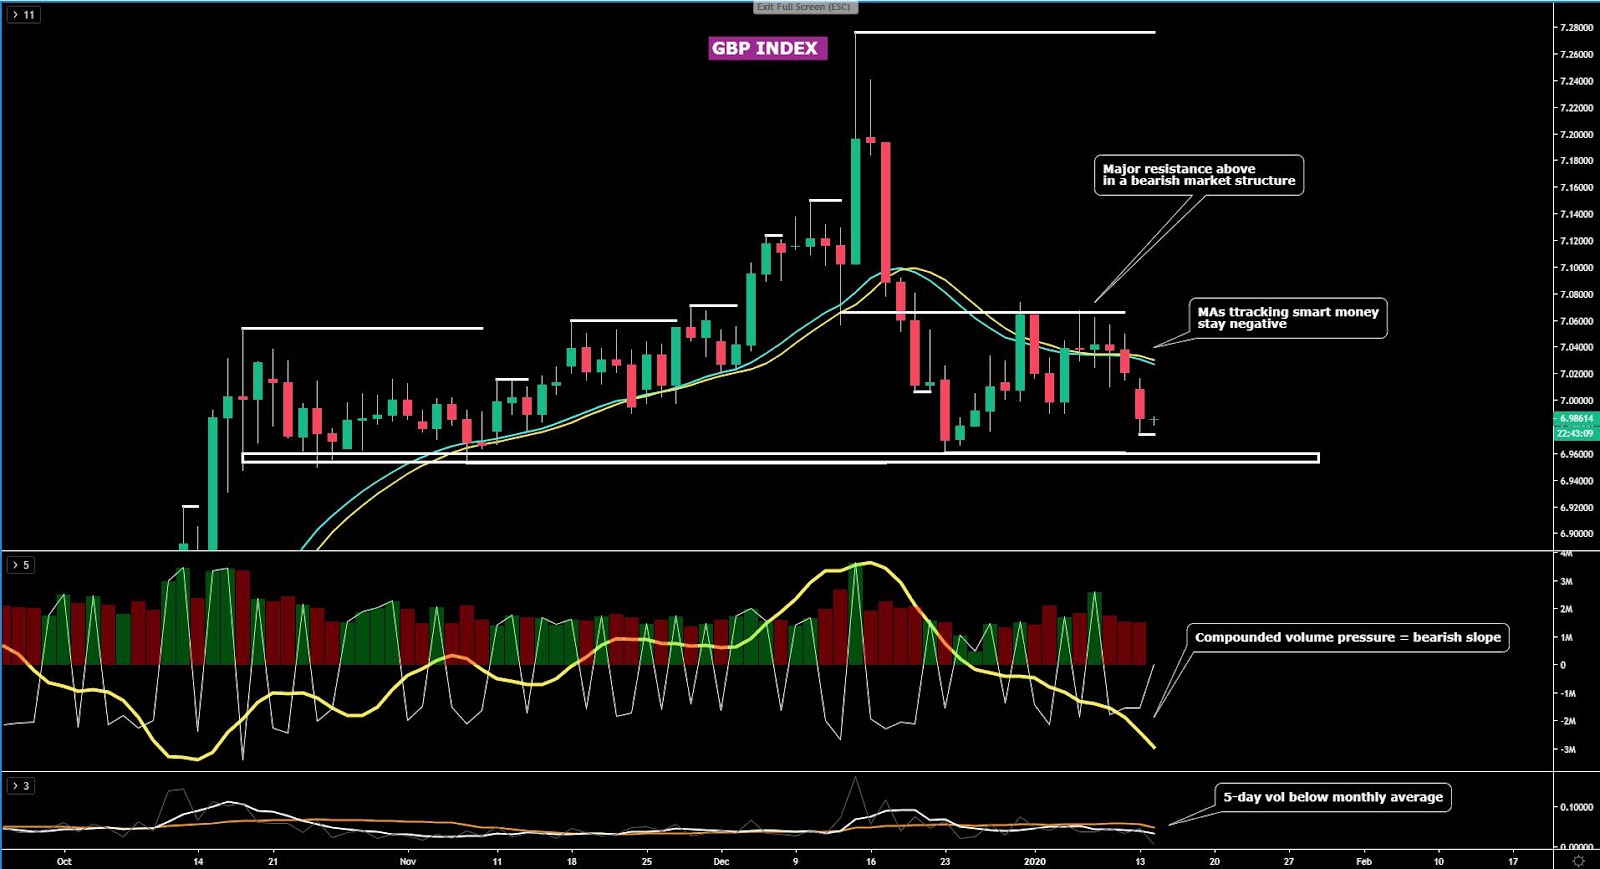
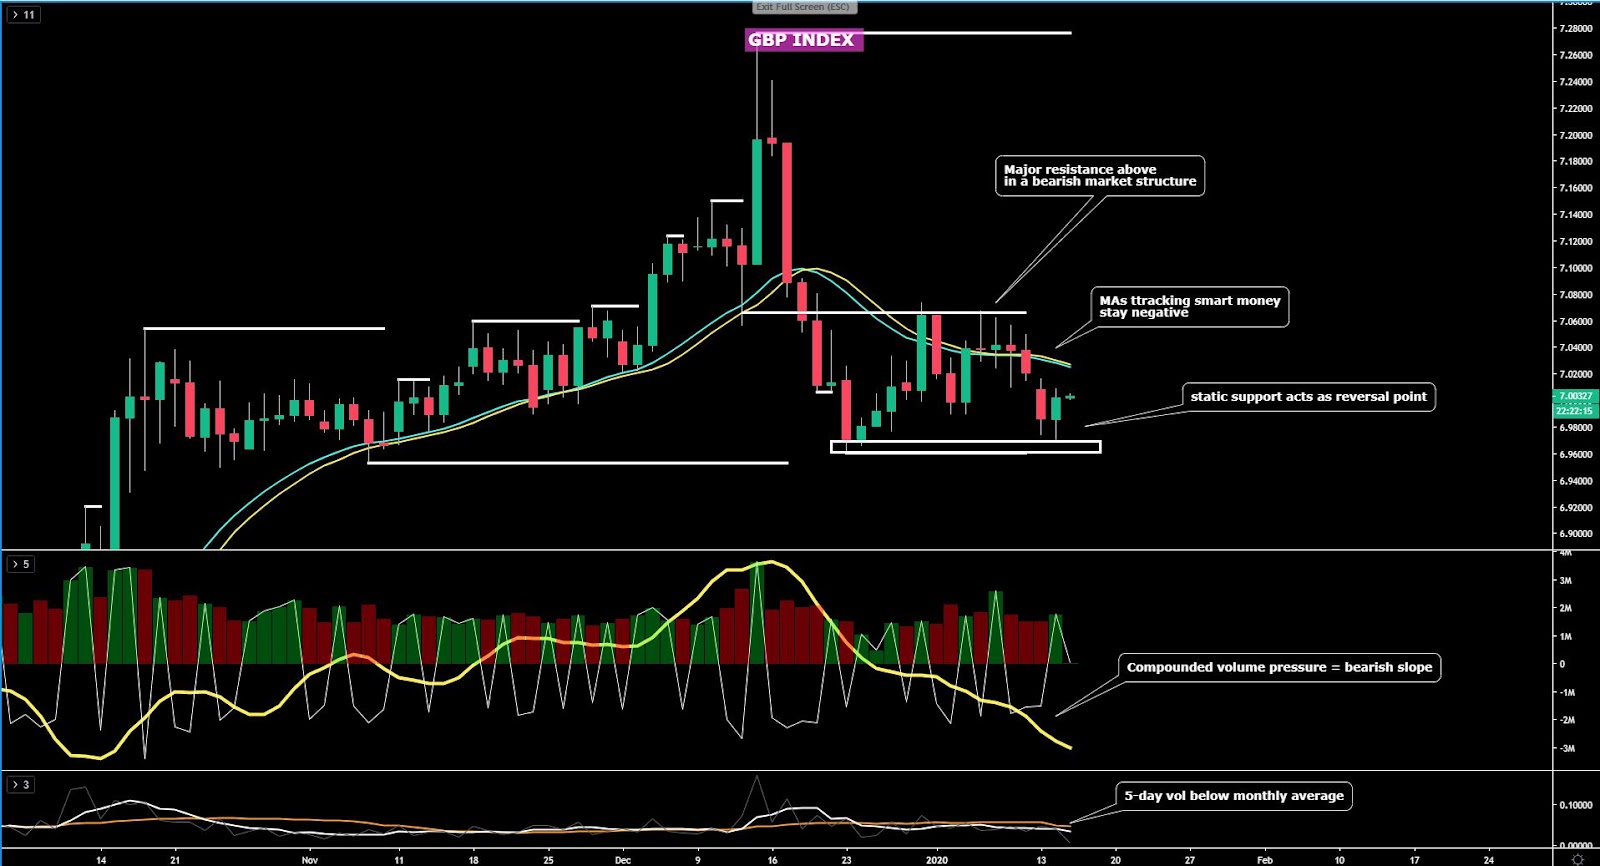
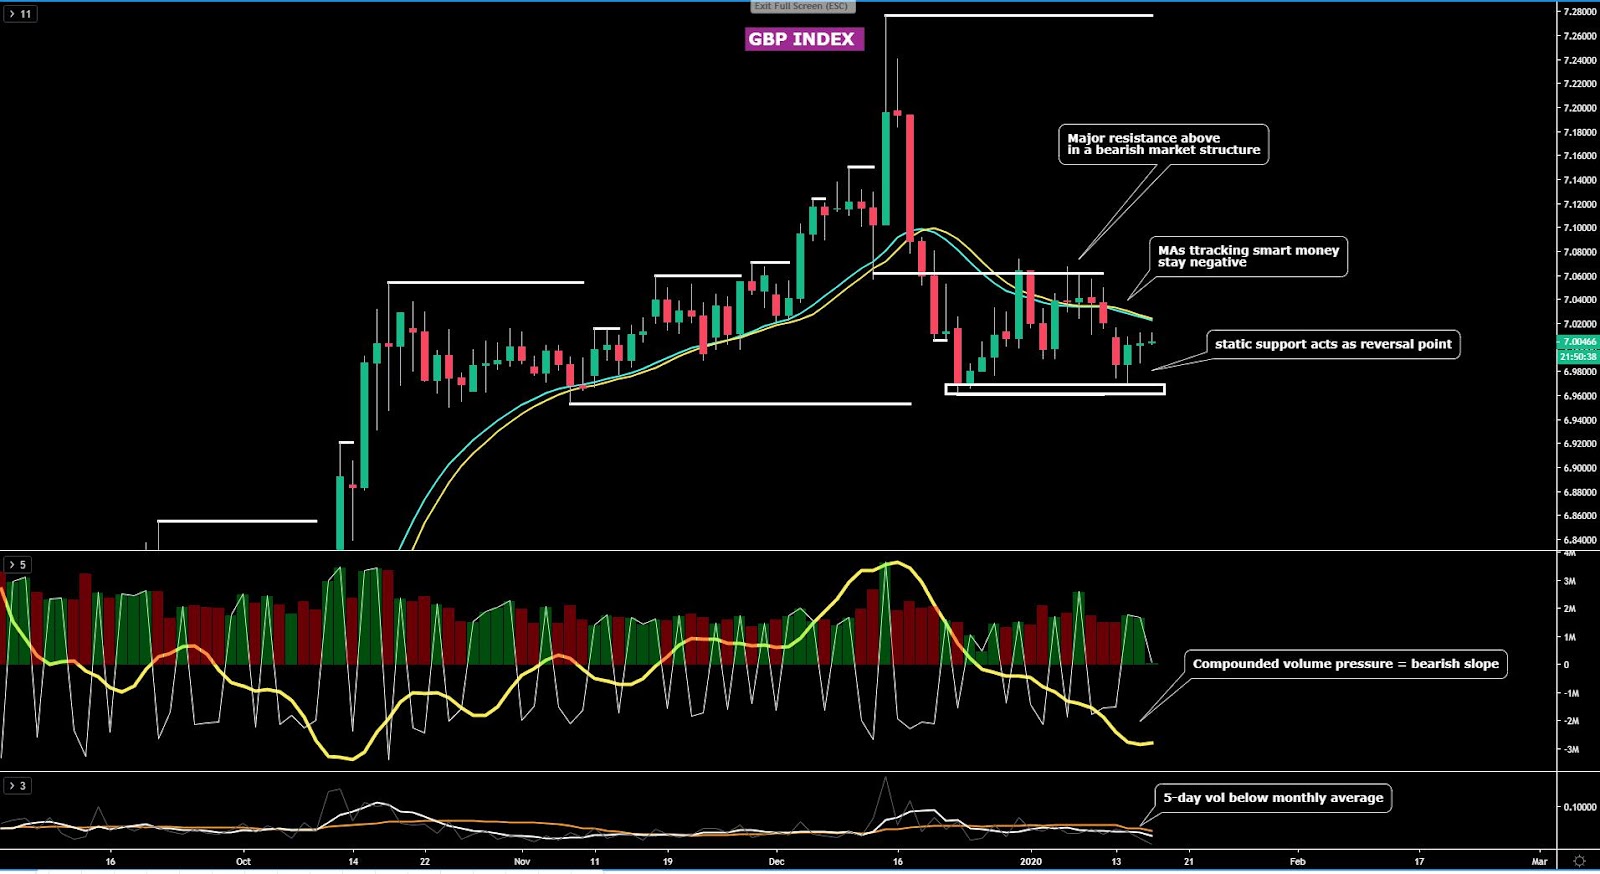
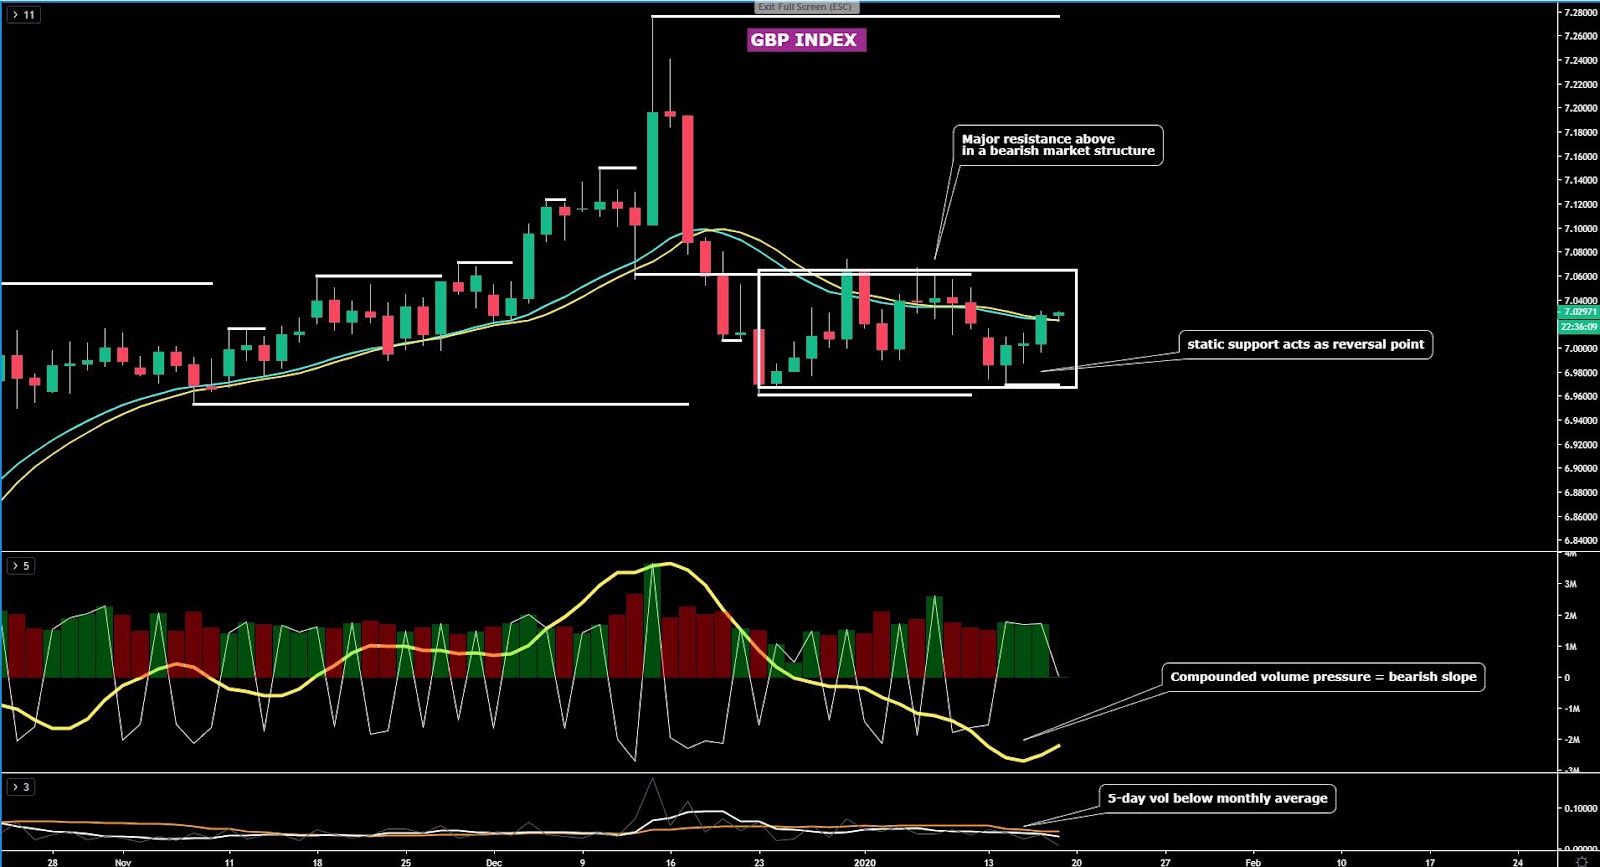
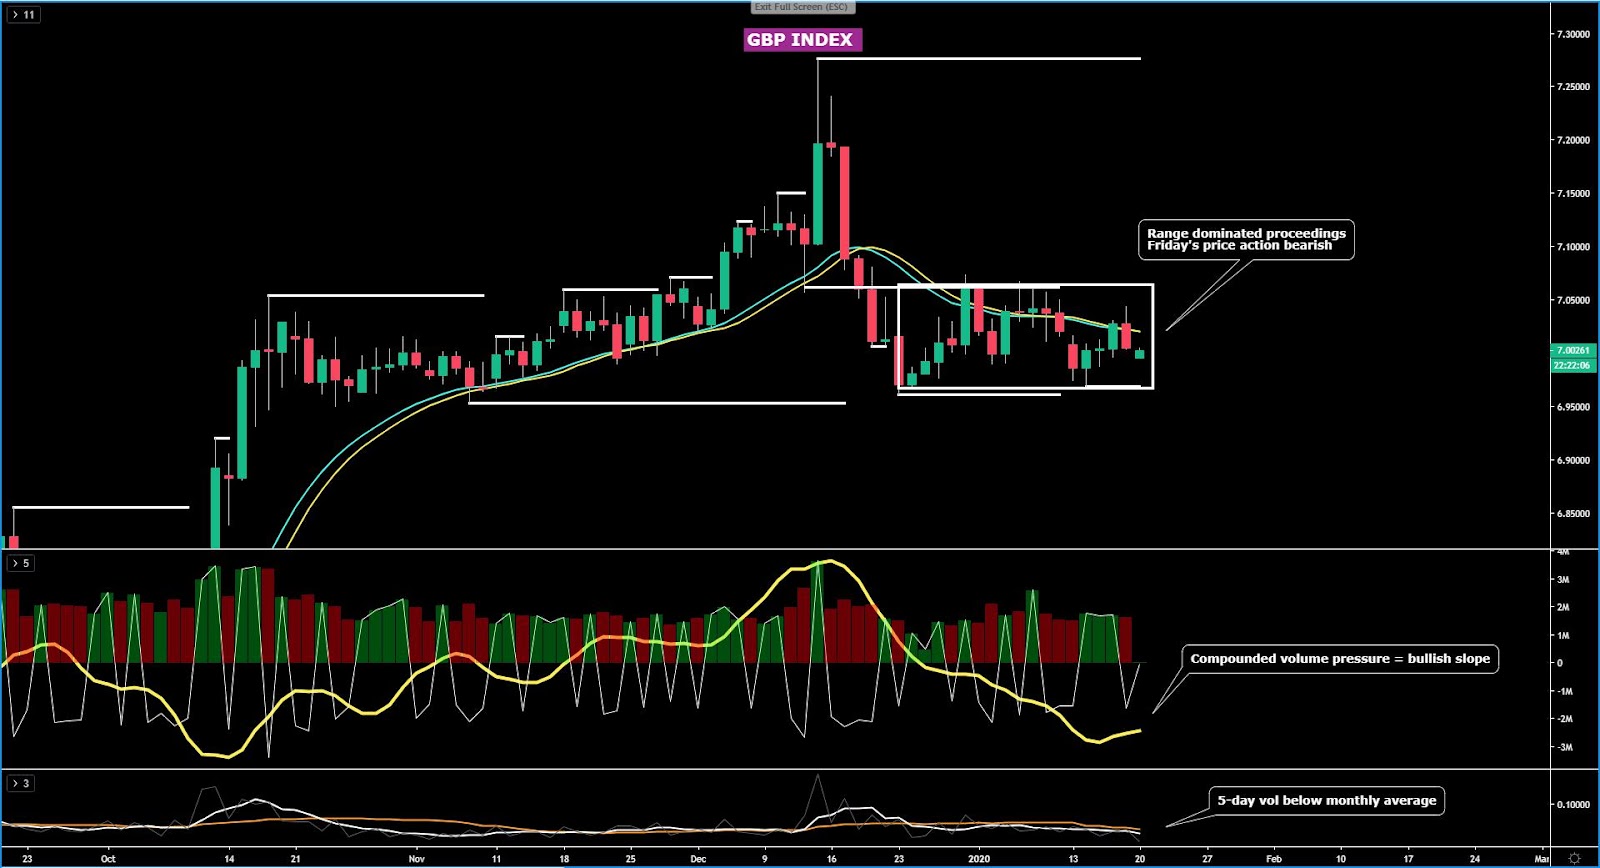
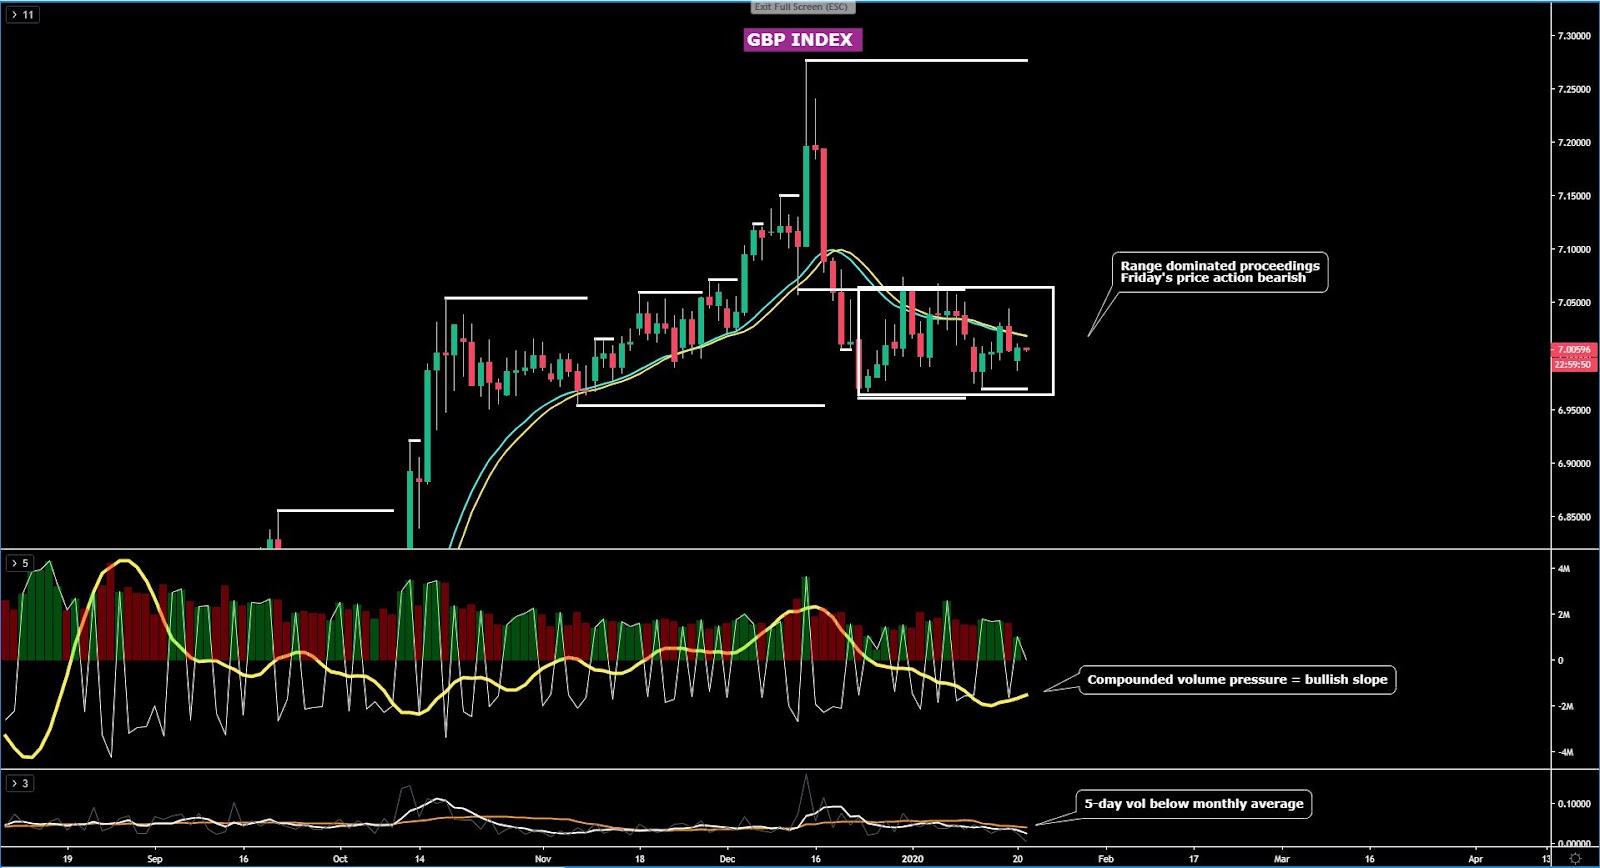
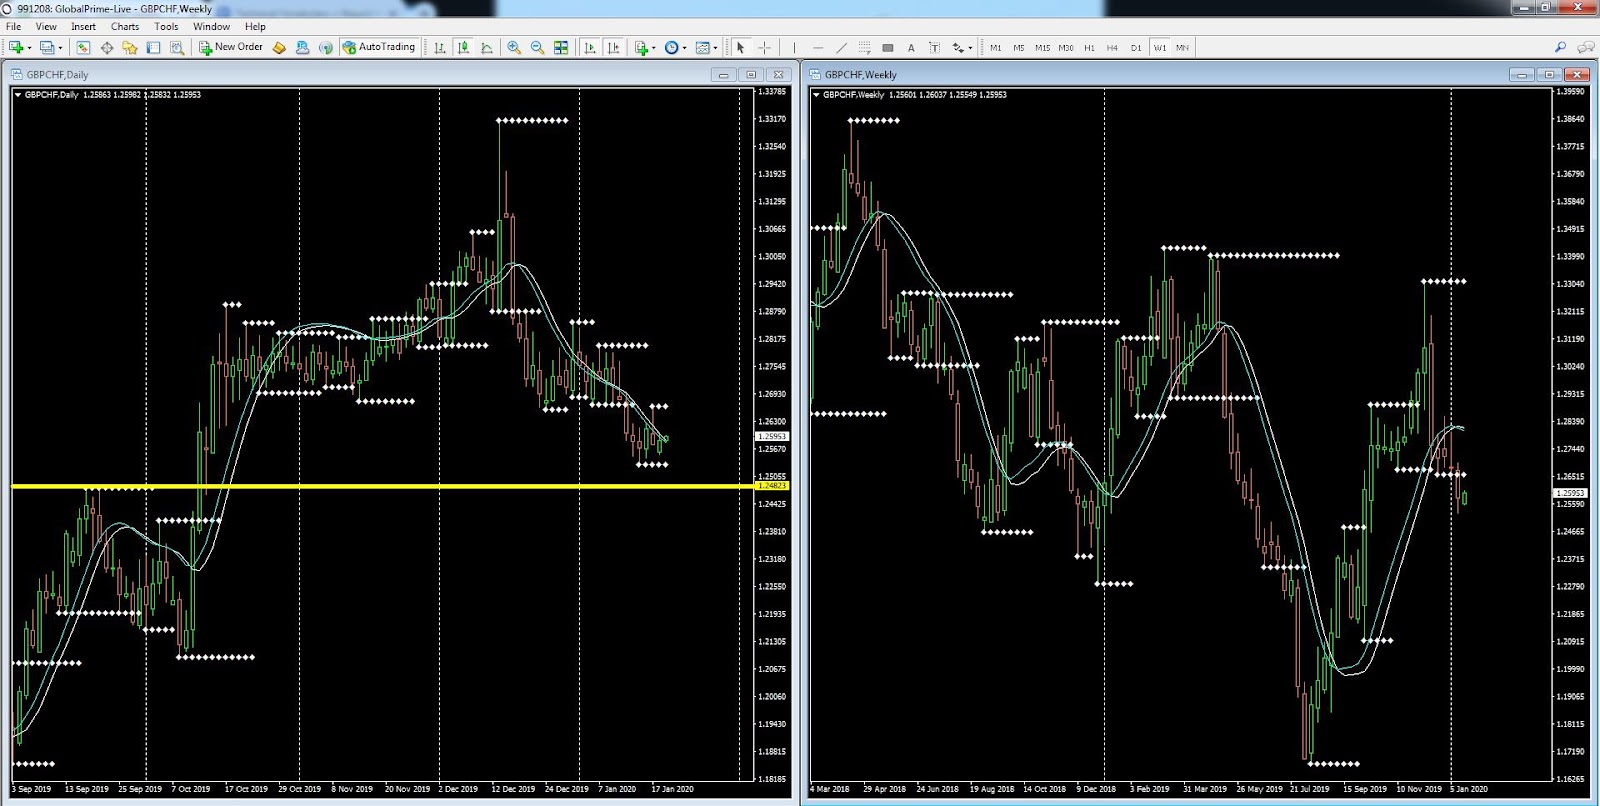
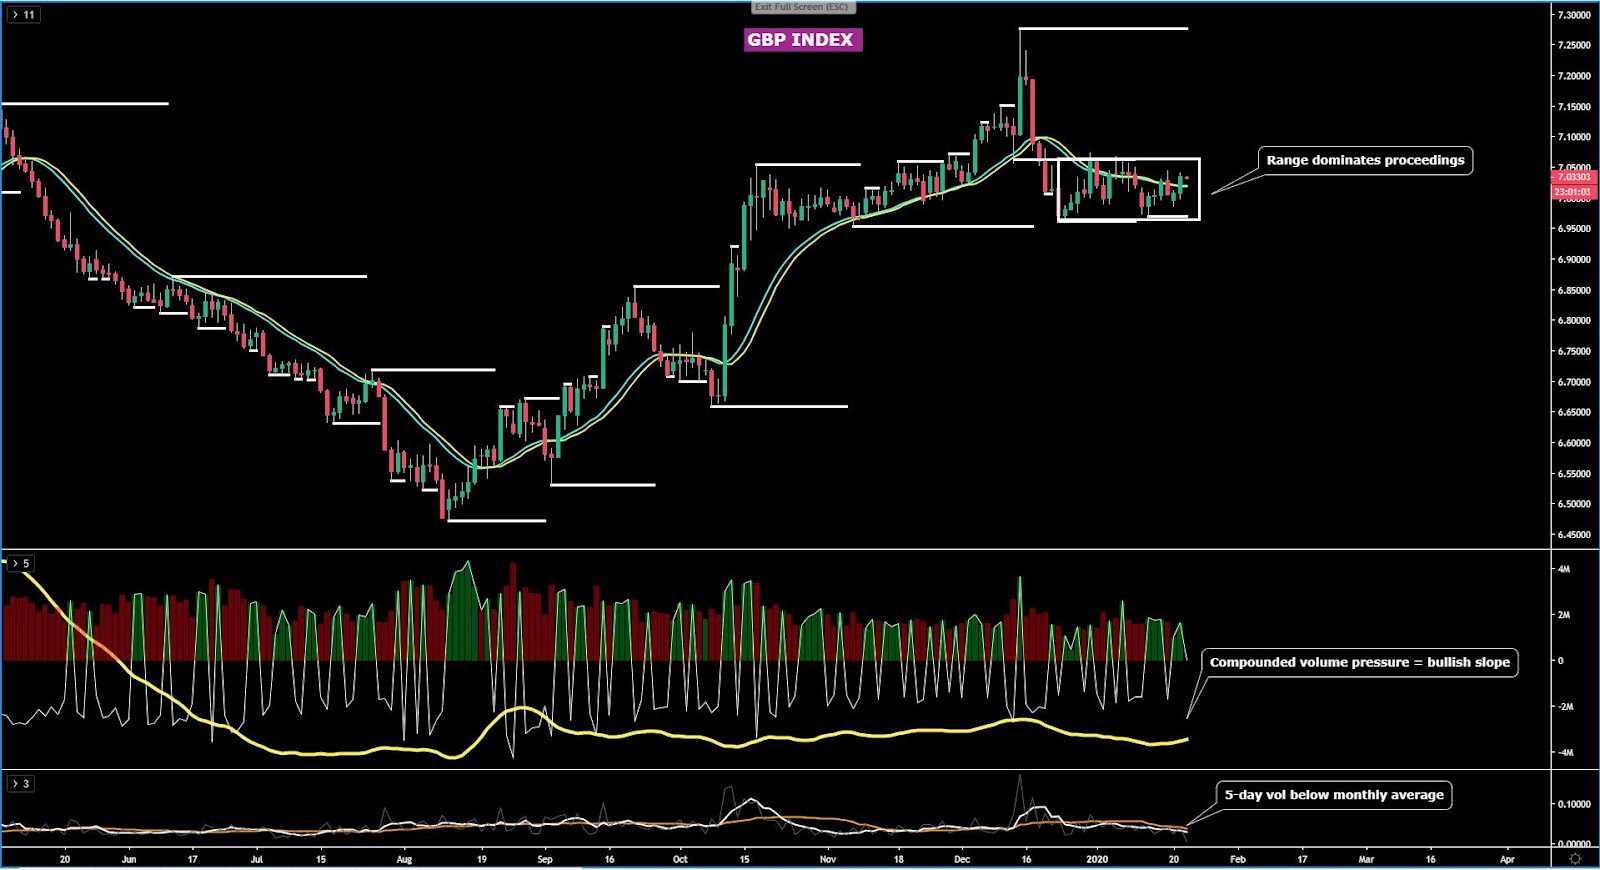
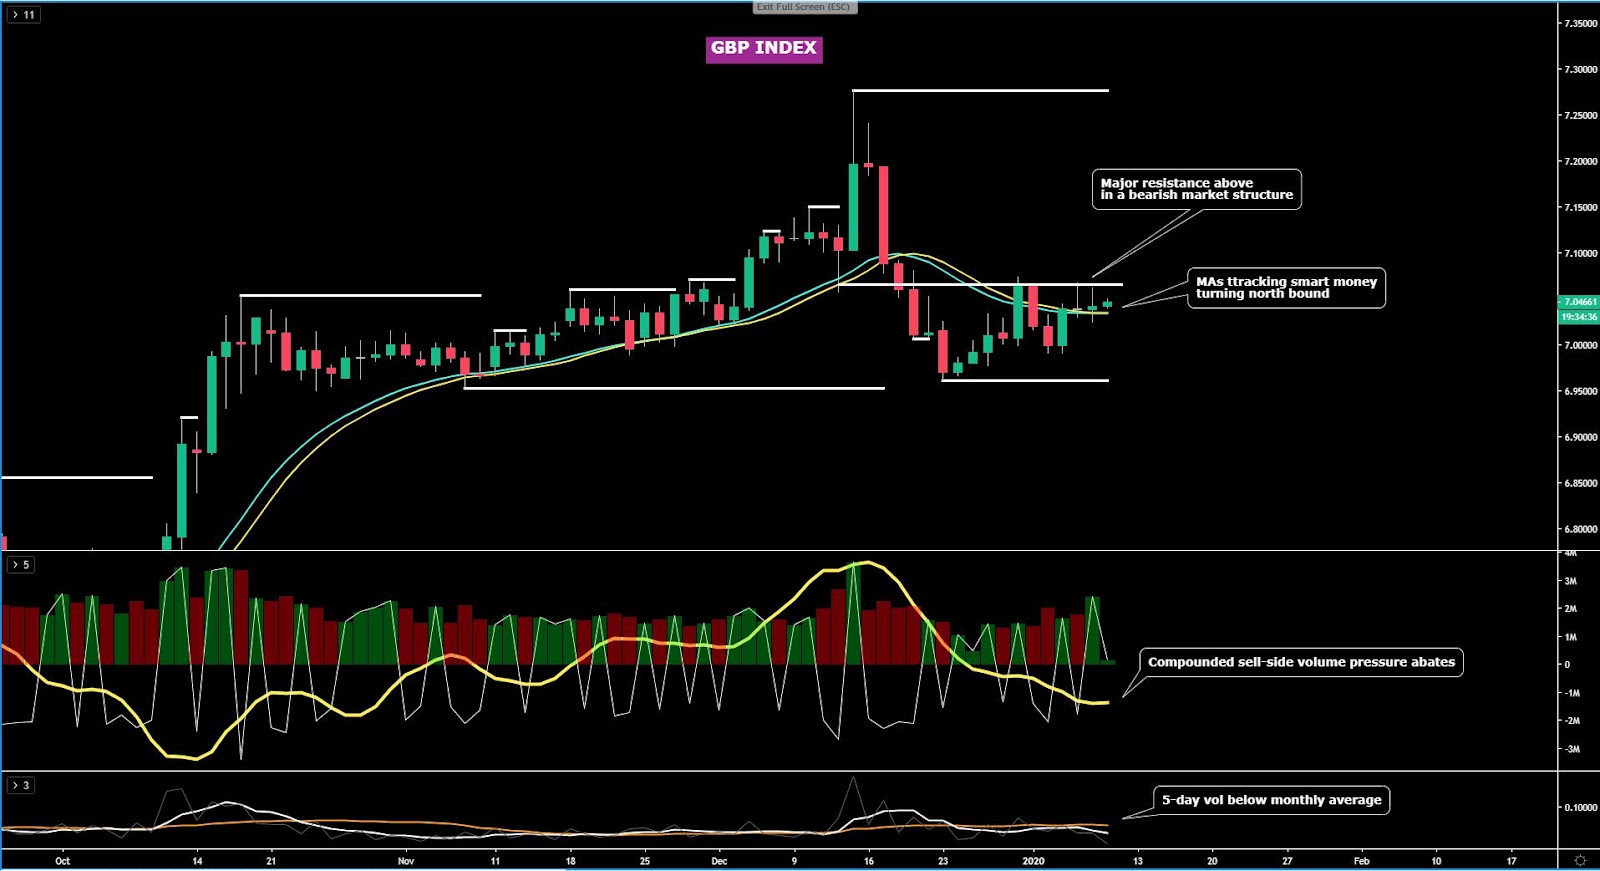
The GBP index could be setting up the stage for another test towards a major structural pivot point in the chart. However, the technicals pose challenges as there are conflicting daily signals preventing a well defined bias. Let’s break it all down. Firstly, on the positive side, the enhanced moving averages tracking the smart money flows is turning bullish for the first time since Dec 18, at a time when the buy-side volume has picked up the most since the UK election day, even if Wed’s Doji-like candle is far from inspirational for the bulls. Besides, the market structure is bearish until acceptance can be found above the resistance line overhead. The vol in the index remains below its monthly historical, which has obviously been distorted by the UK election. Lastly, note that as in the case of the EUR, the GBP also tends to suffer in January.
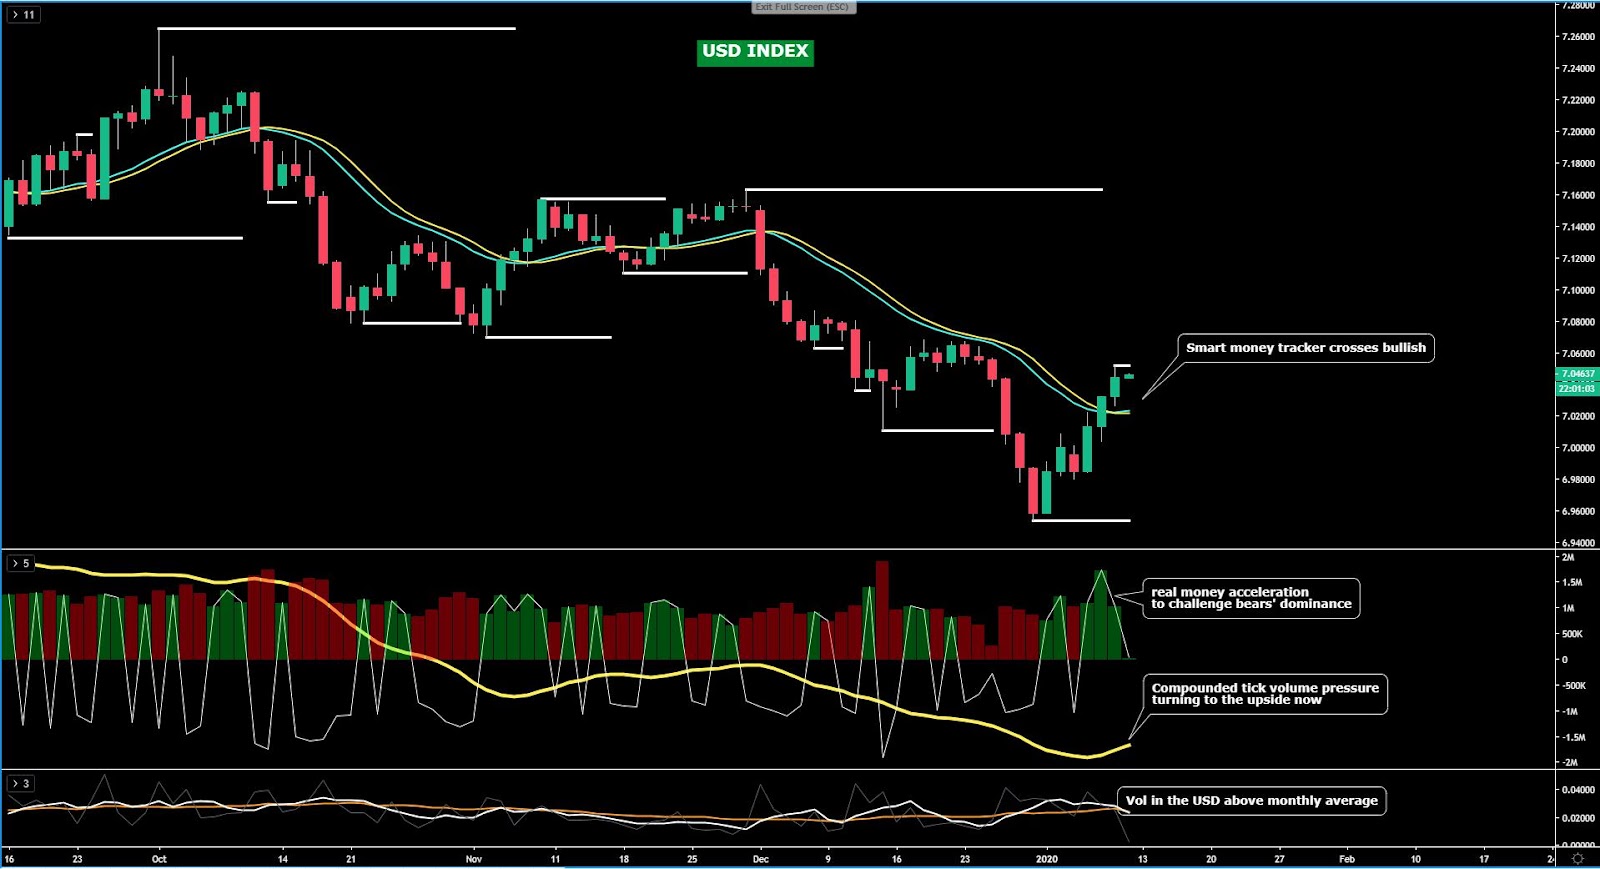
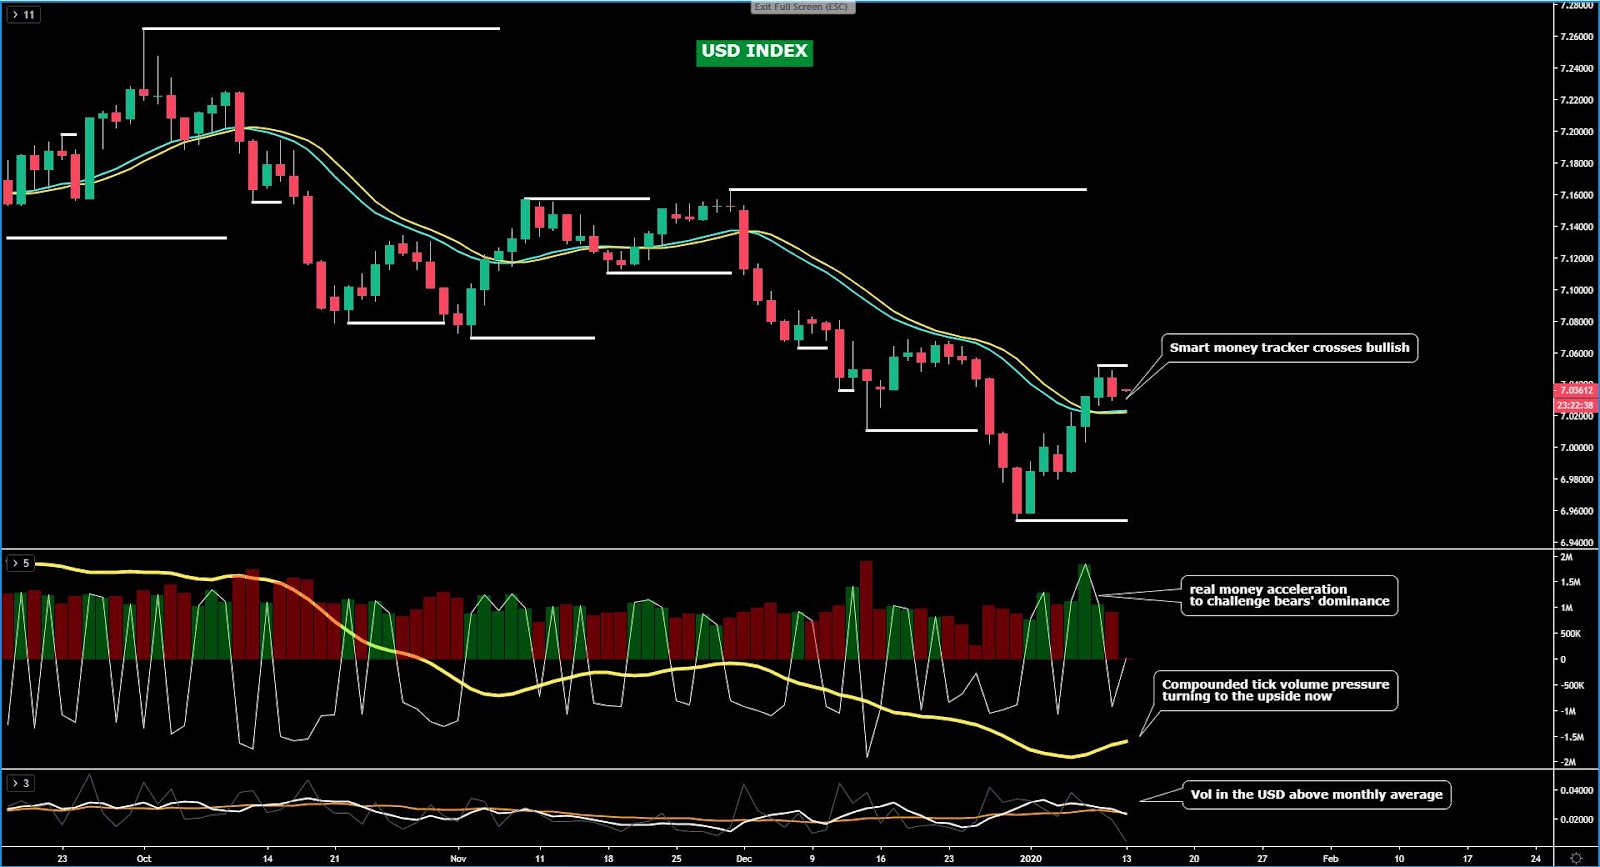
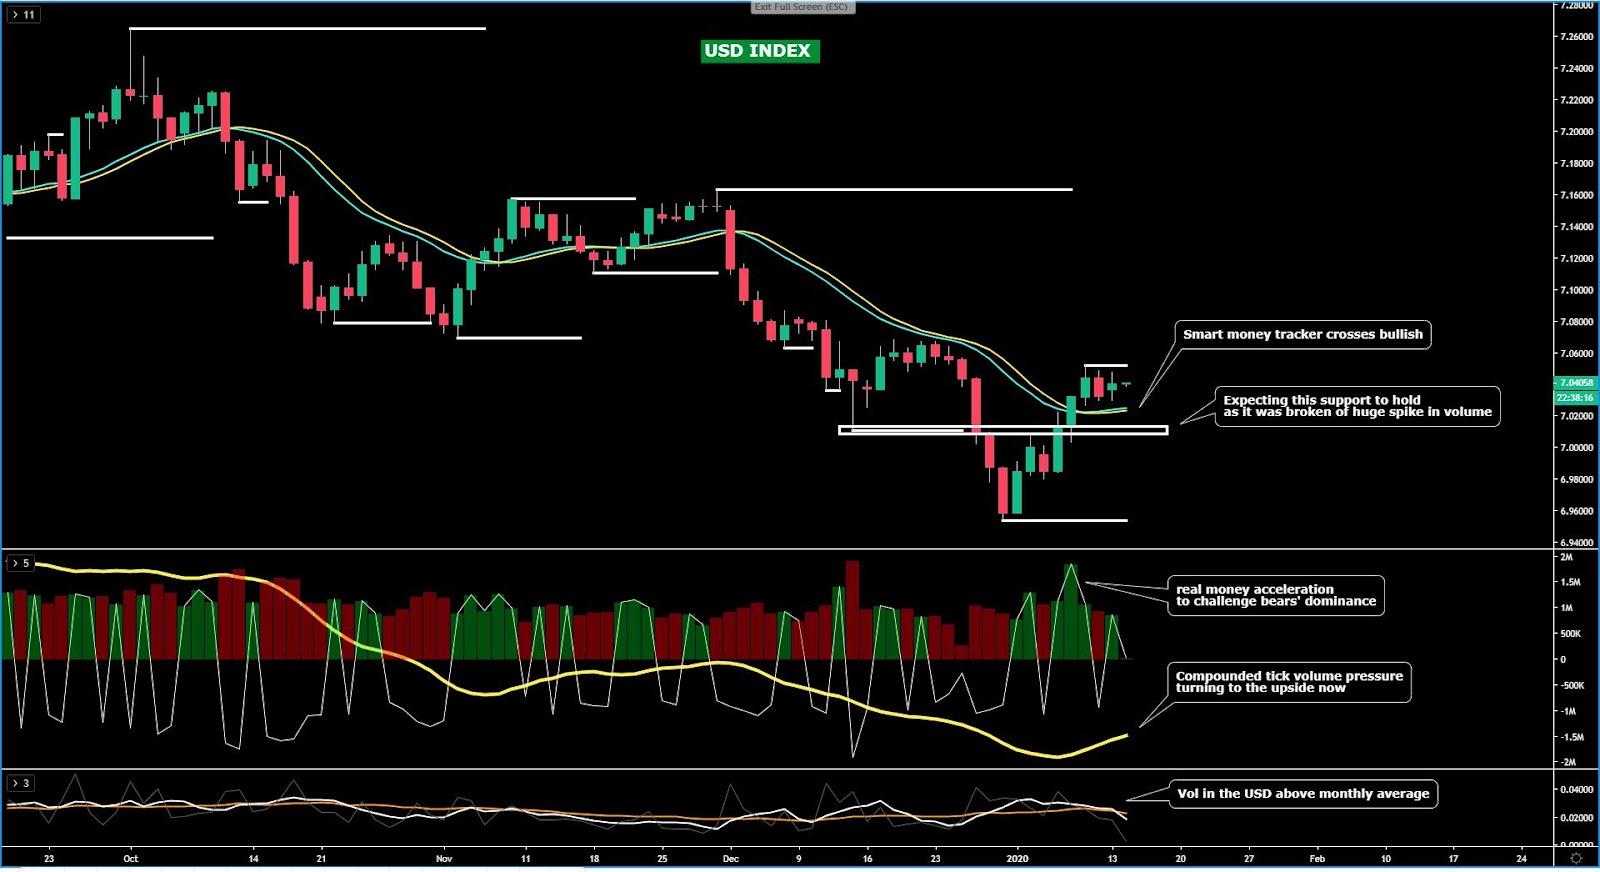
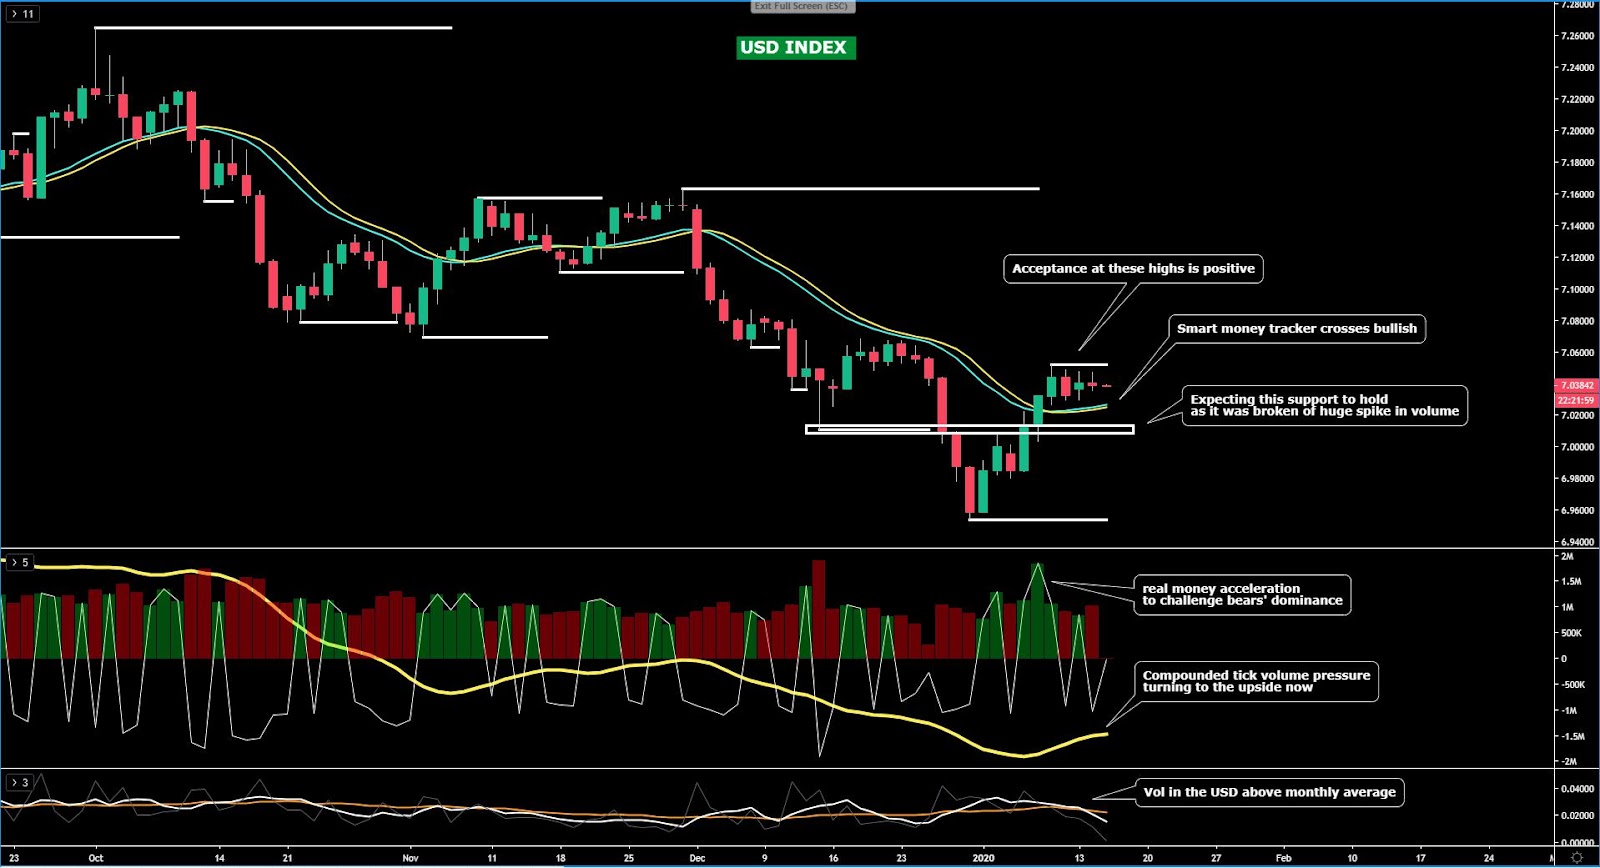
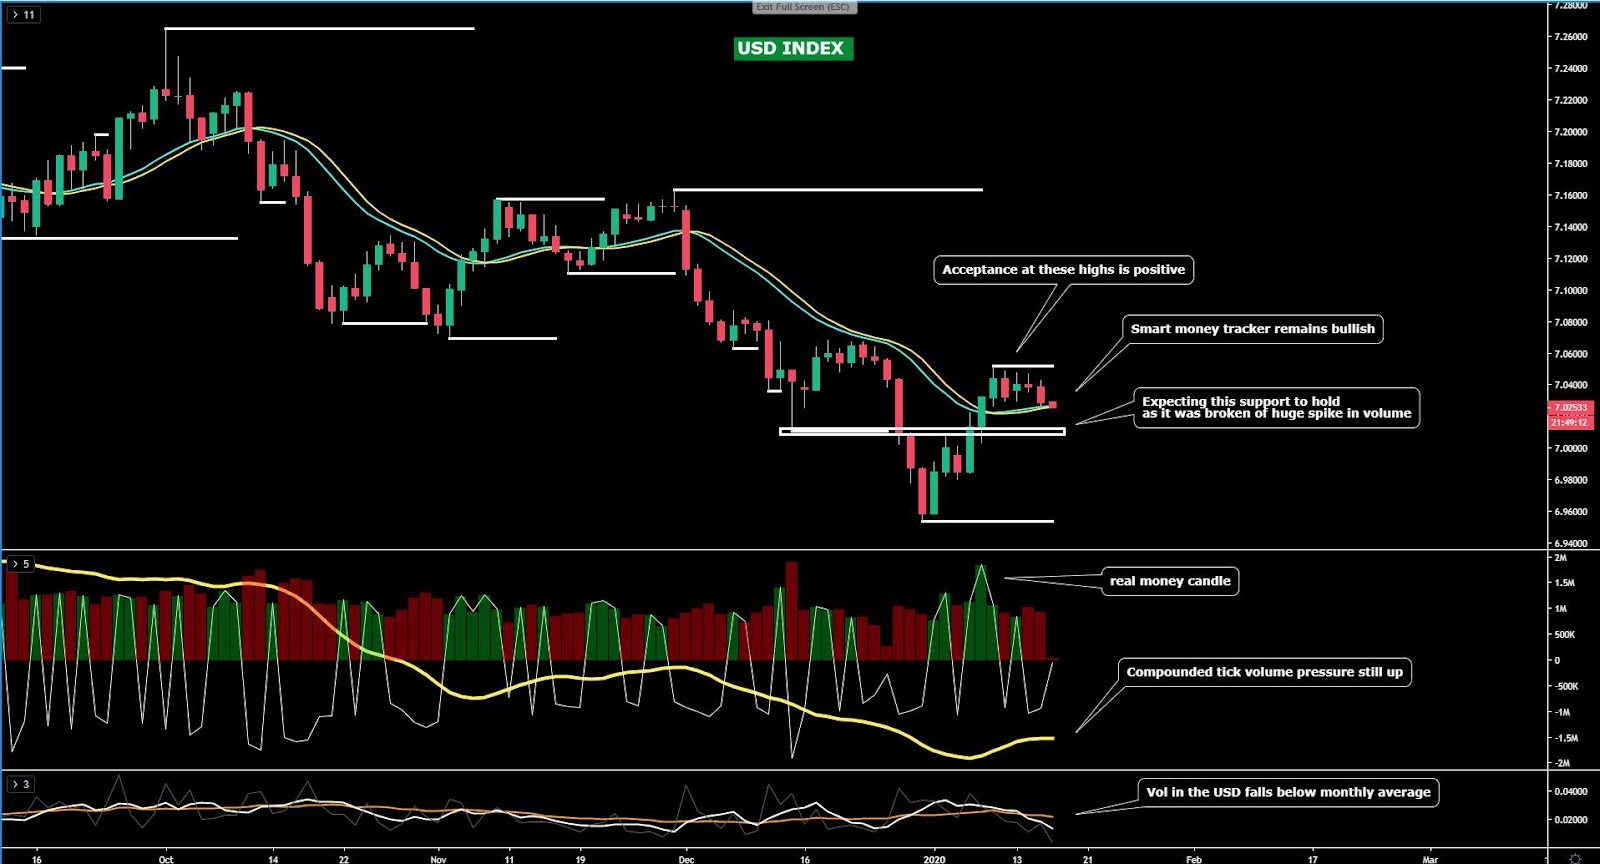
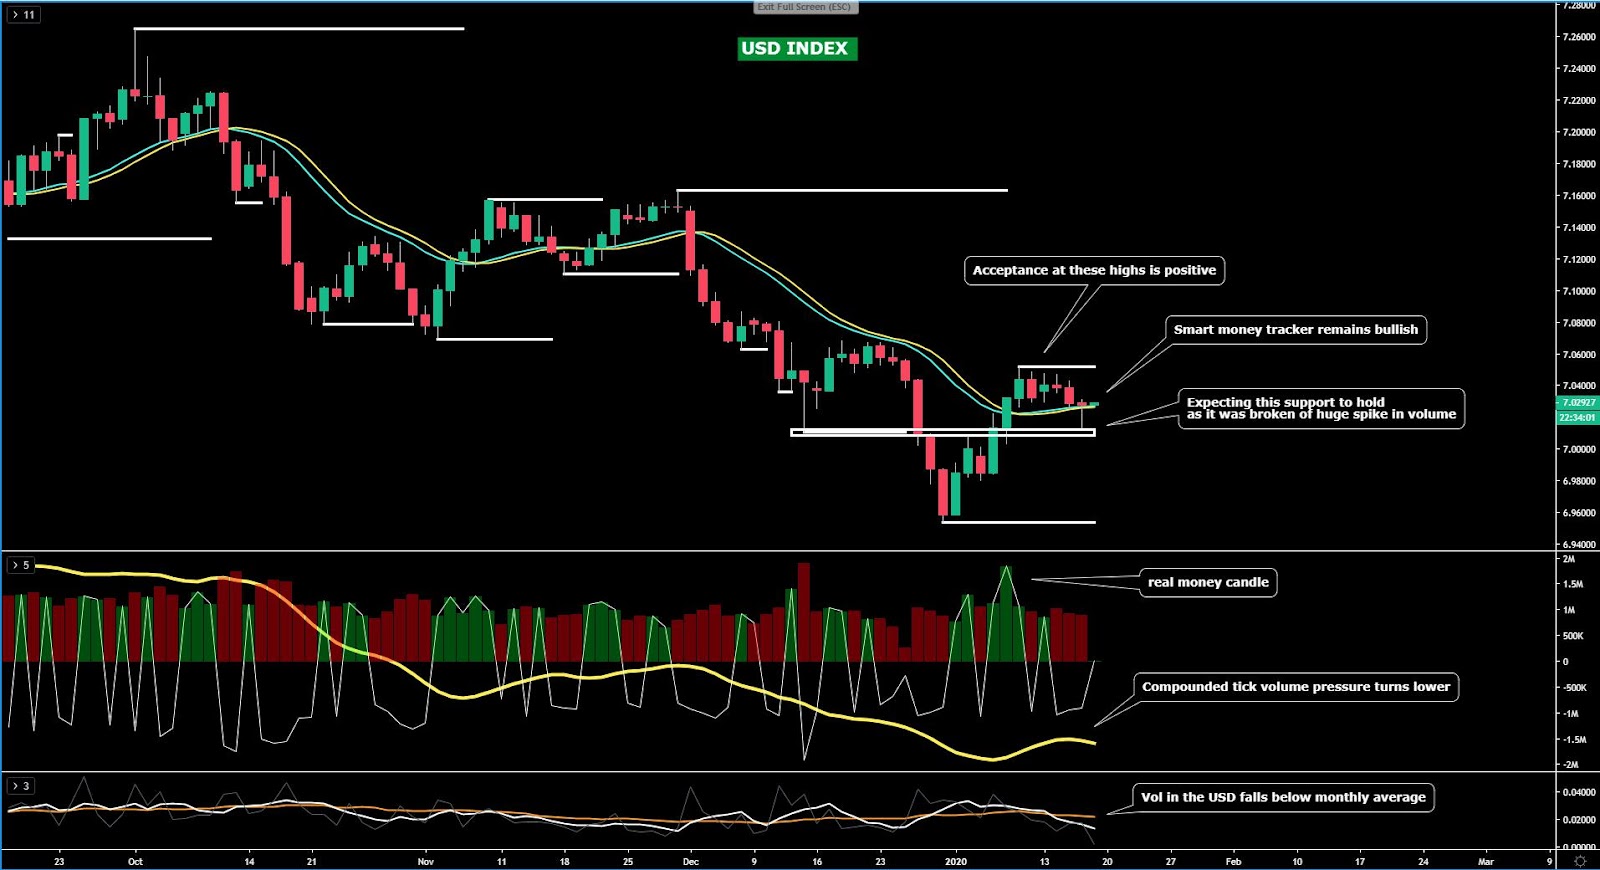
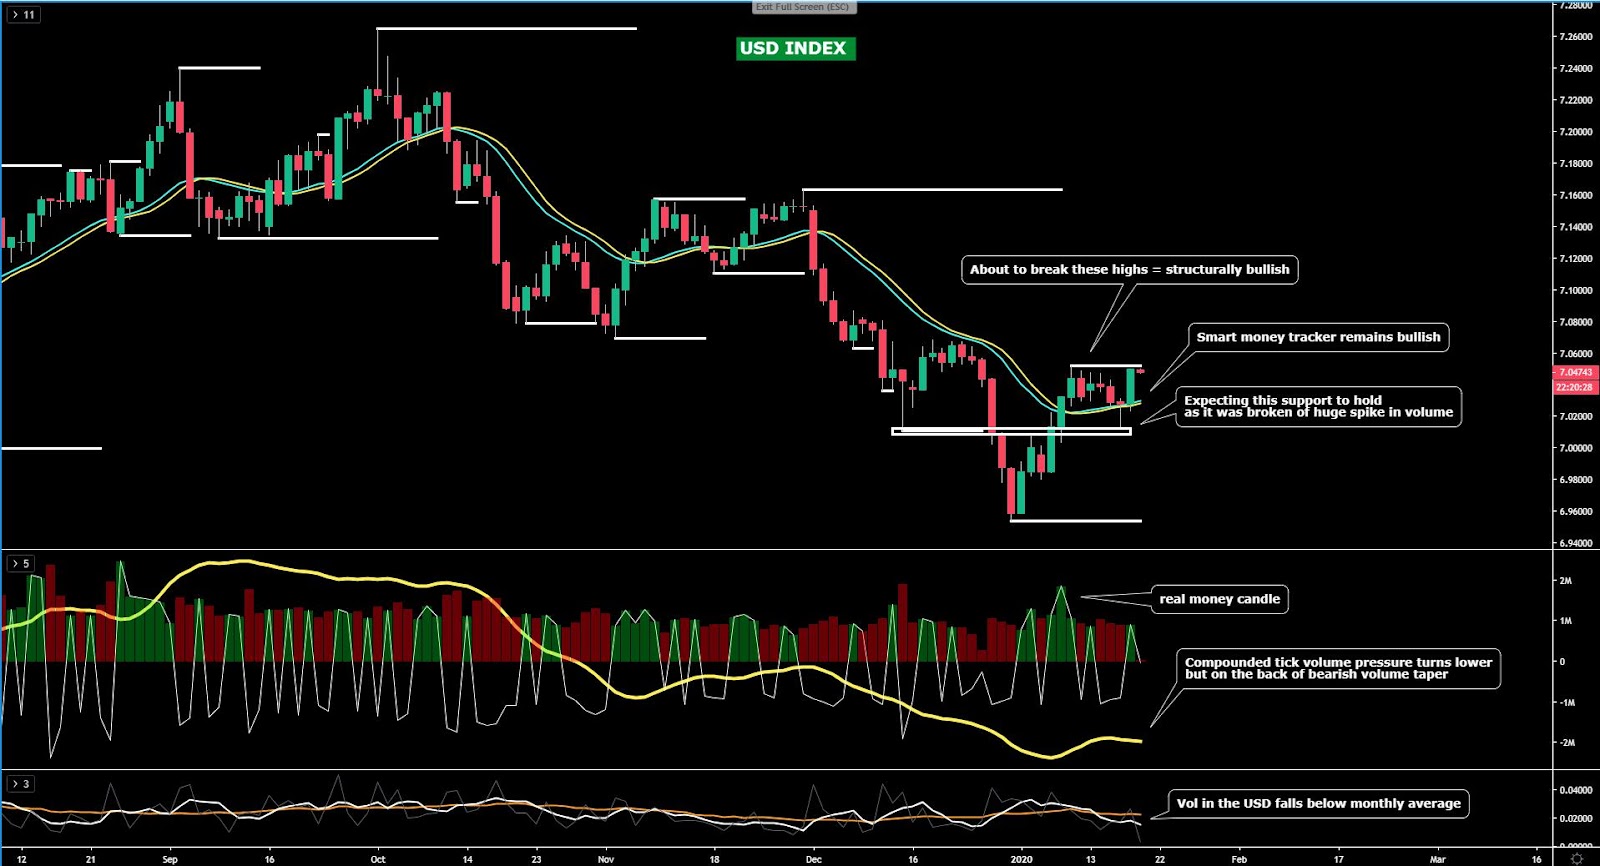
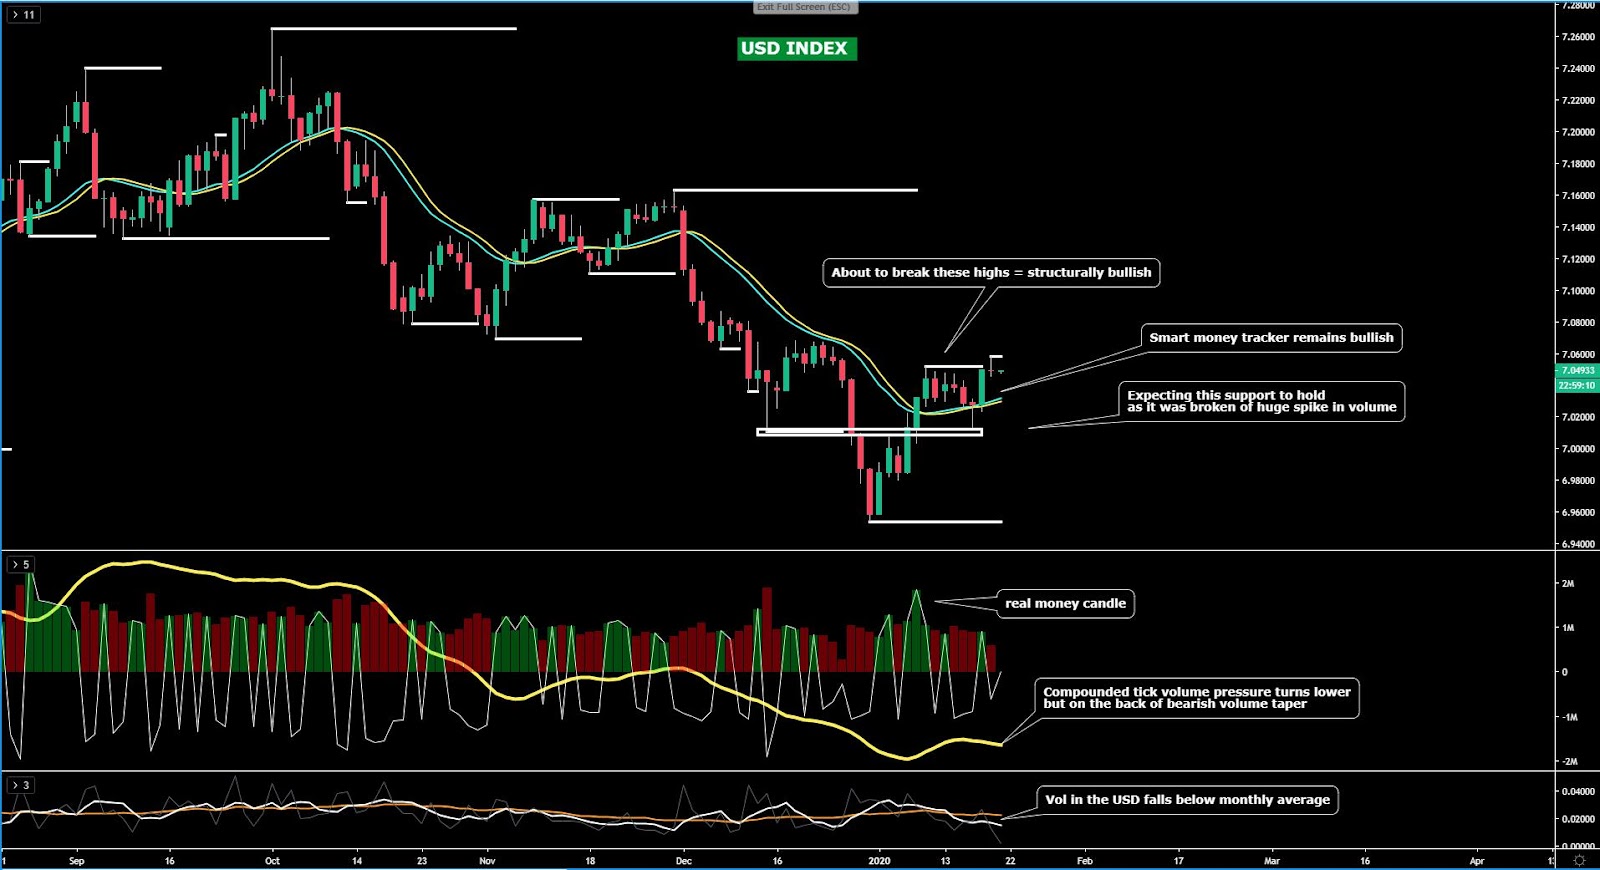
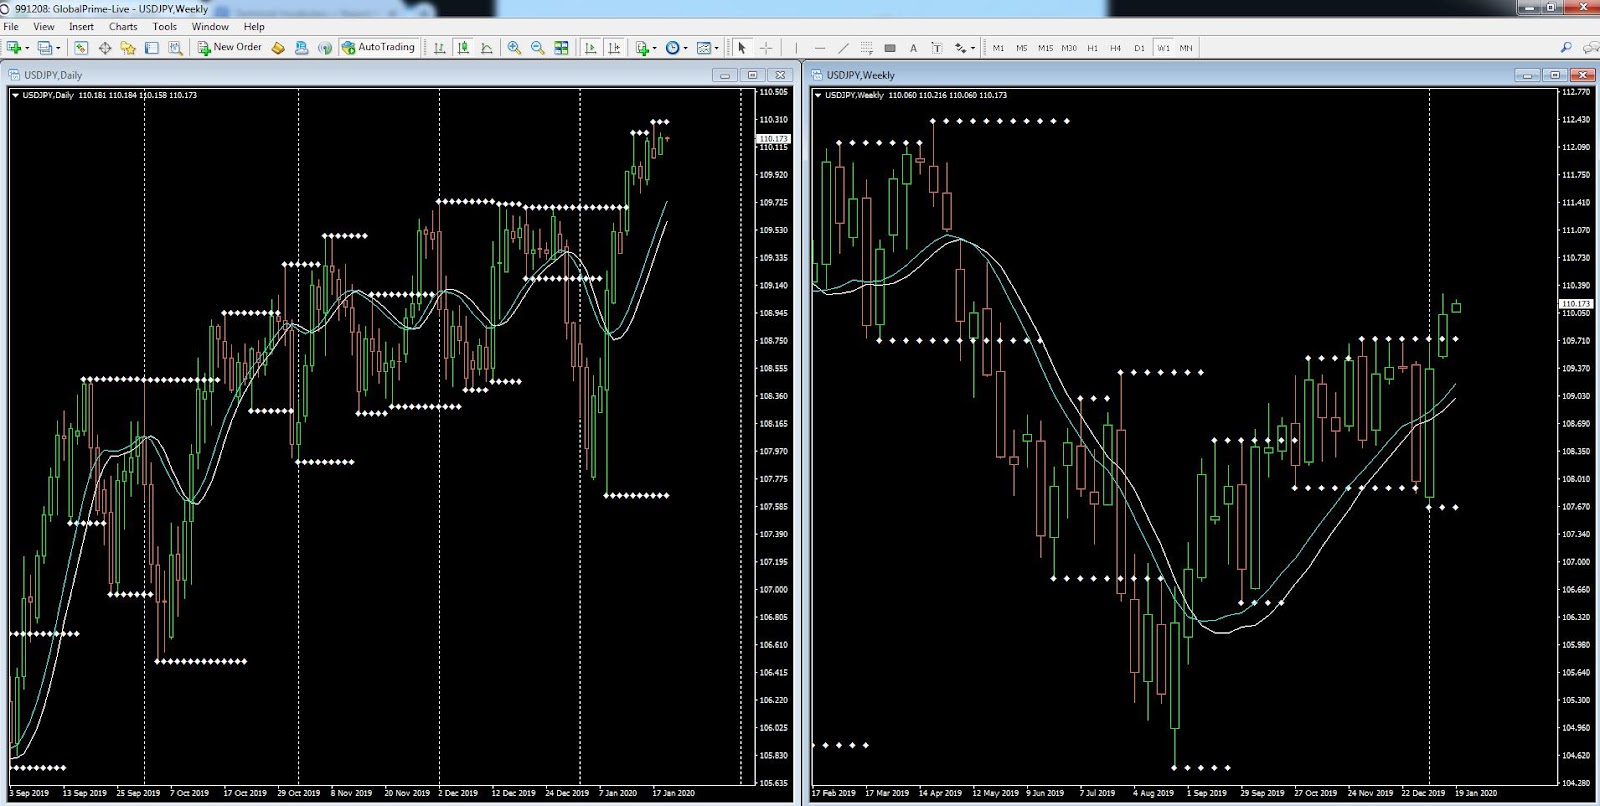
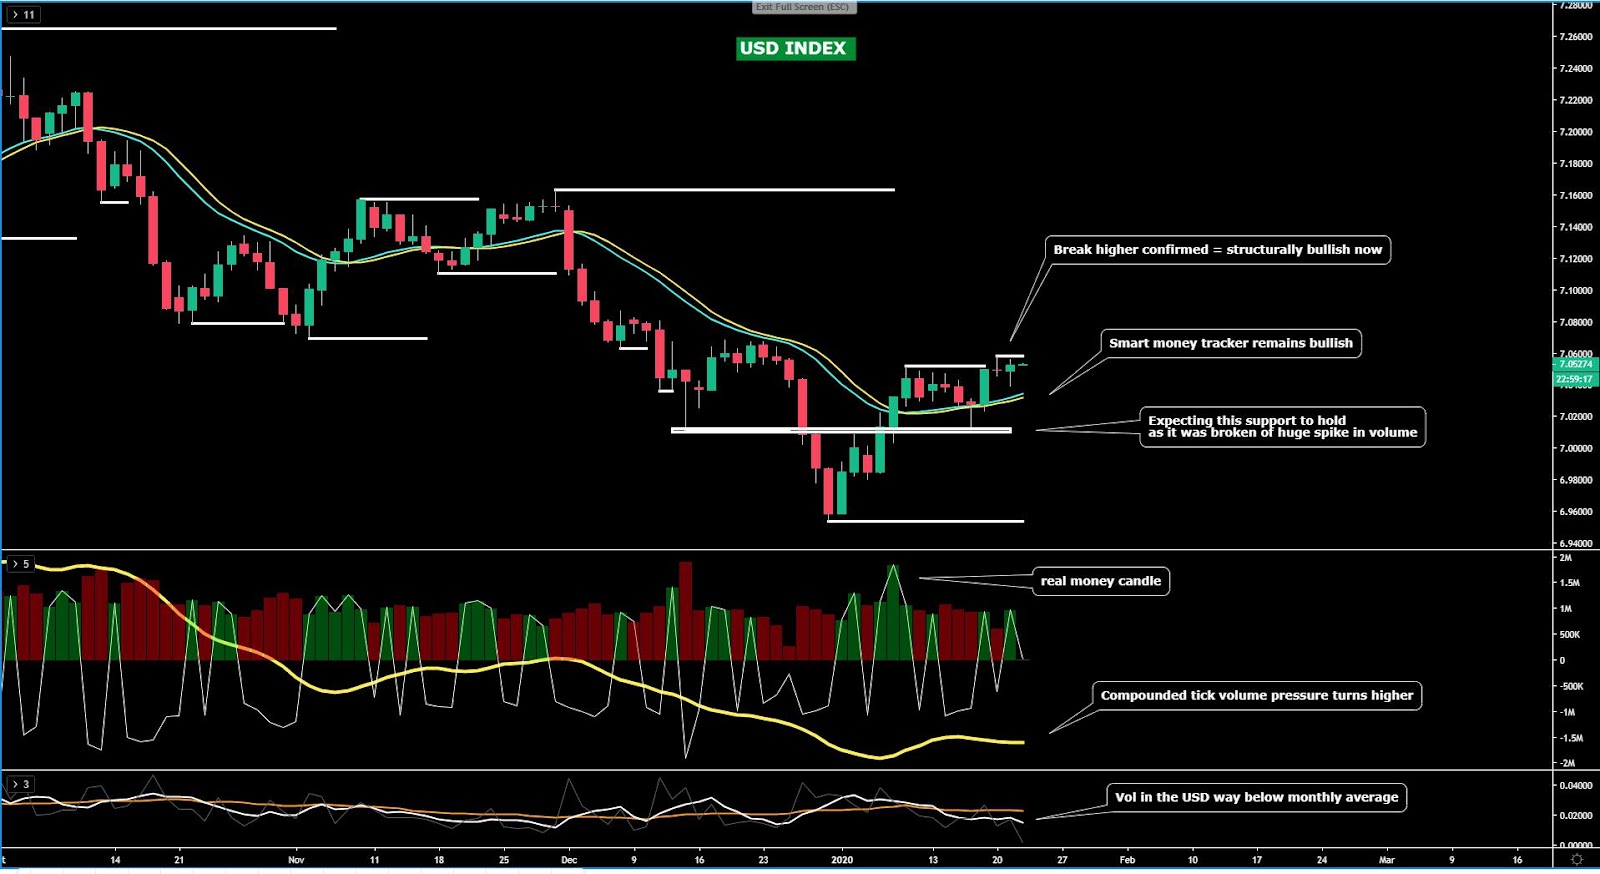
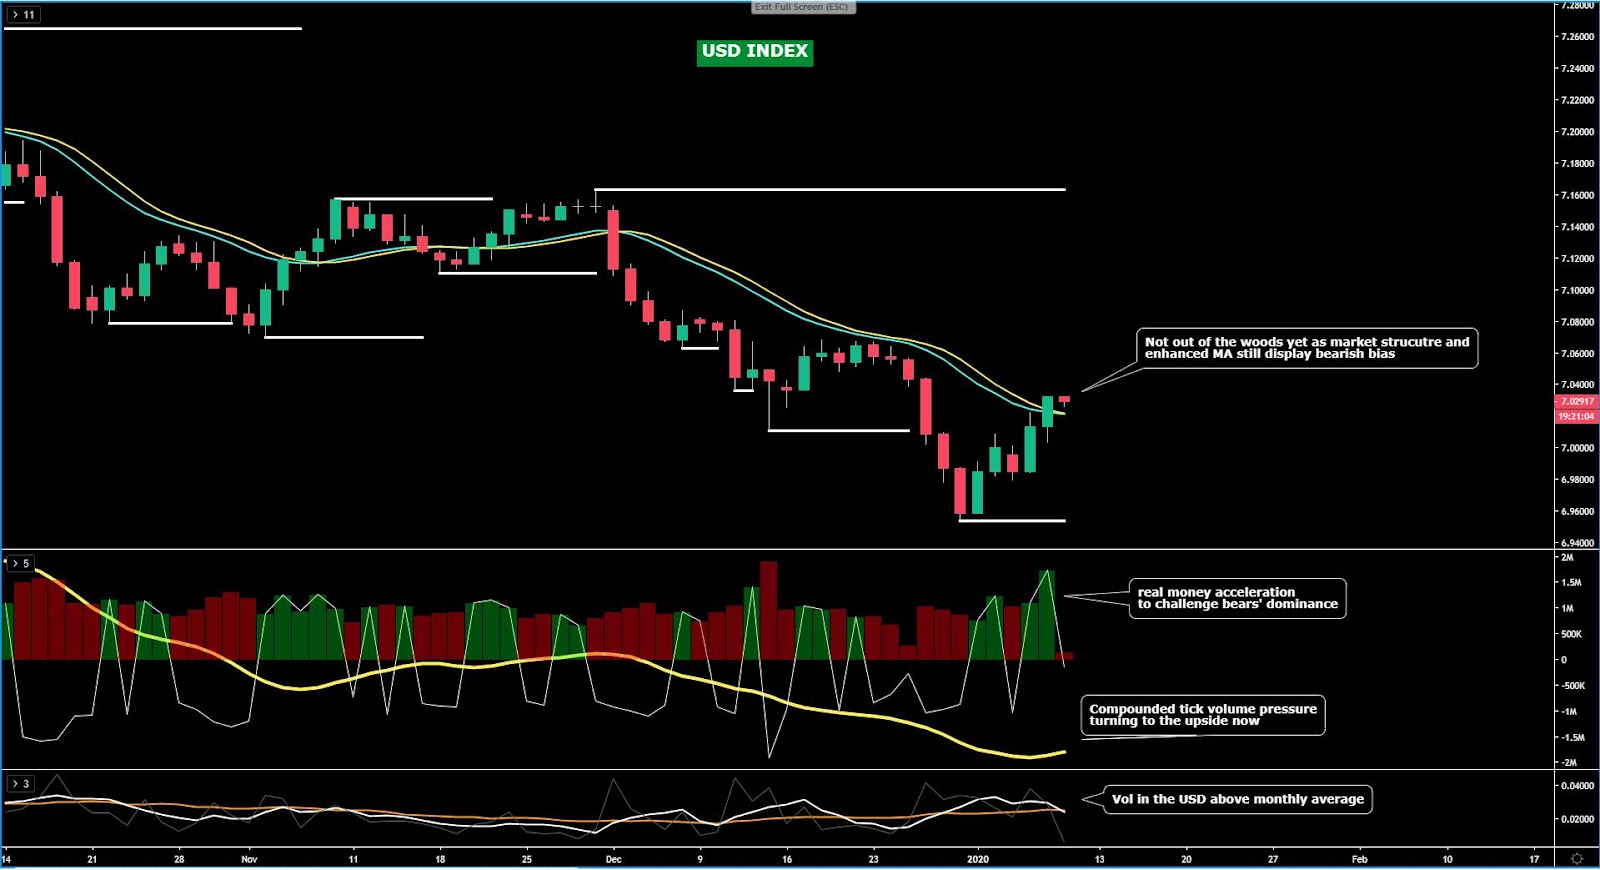
The USD index has found a fresh leg to the upside after the volatile 24h of forex trading, and judging by the close of the candle finding acceptance at the highs of the day by the end of business in NY, the volume it carried (highest since Aug 26th last year!), alongside the fact that the USD tends to attract heavy positive flows in January, my bullish stand has been reinforced. The overall sell-side volume pressure via the 13ema applied to the OBV is also turning bullish. That said, this Thursday and Friday the prospects a further bullish extension will be challenged by the ongoing bearish structure, which remains backed up by the smart money trend, as depicted by the bearish trajectory of the enhanced moving averages. It was an appealing proposition to be a USD buyer at the trend lows, less so at these levels.
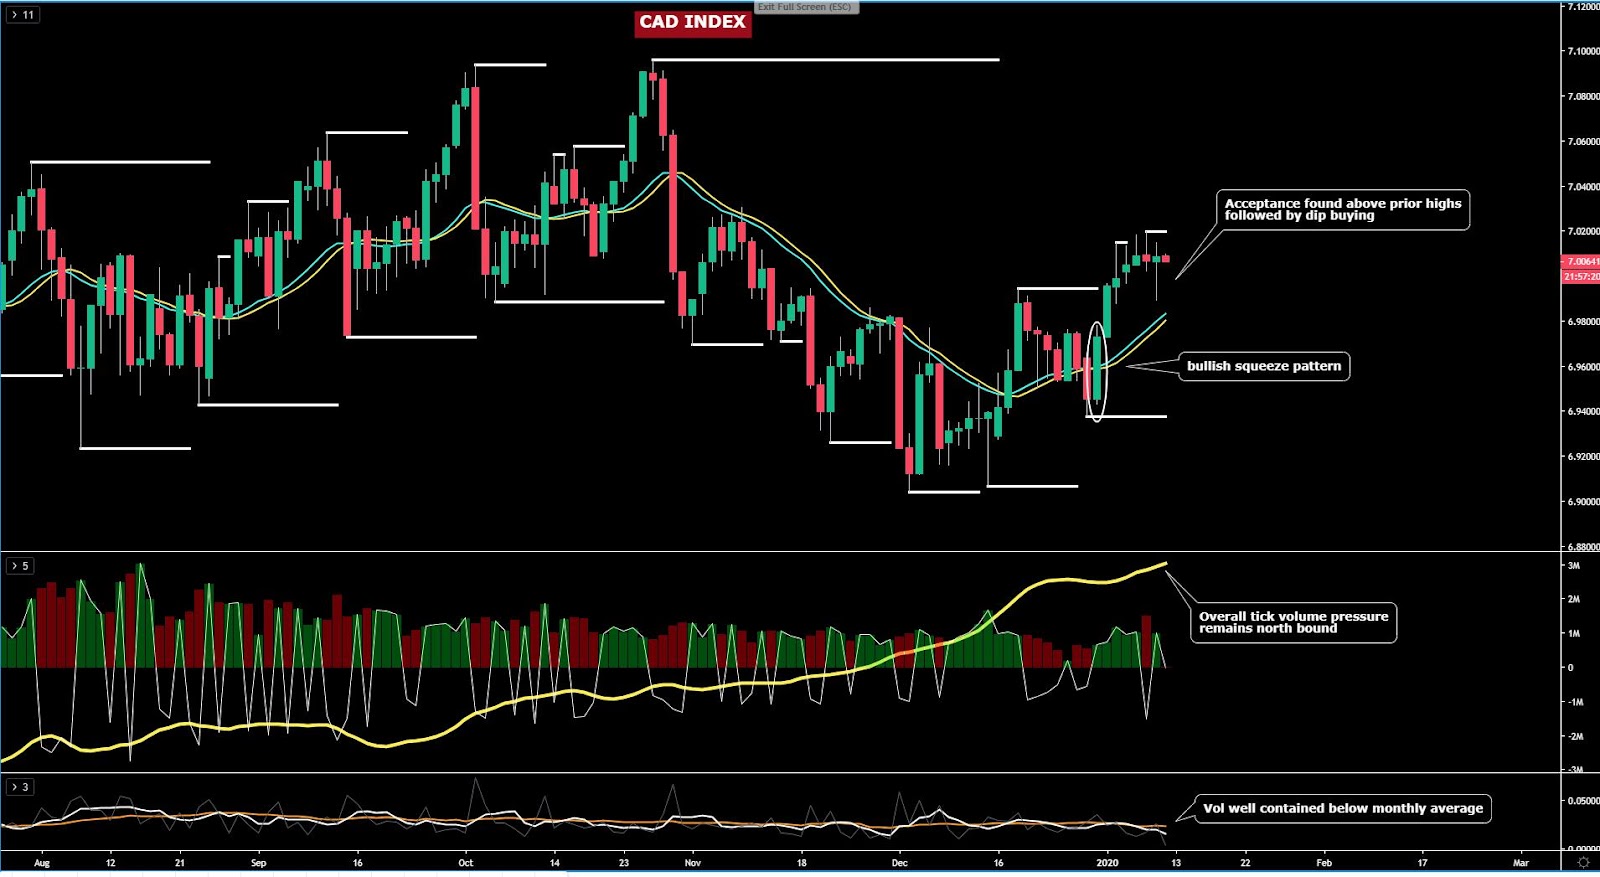
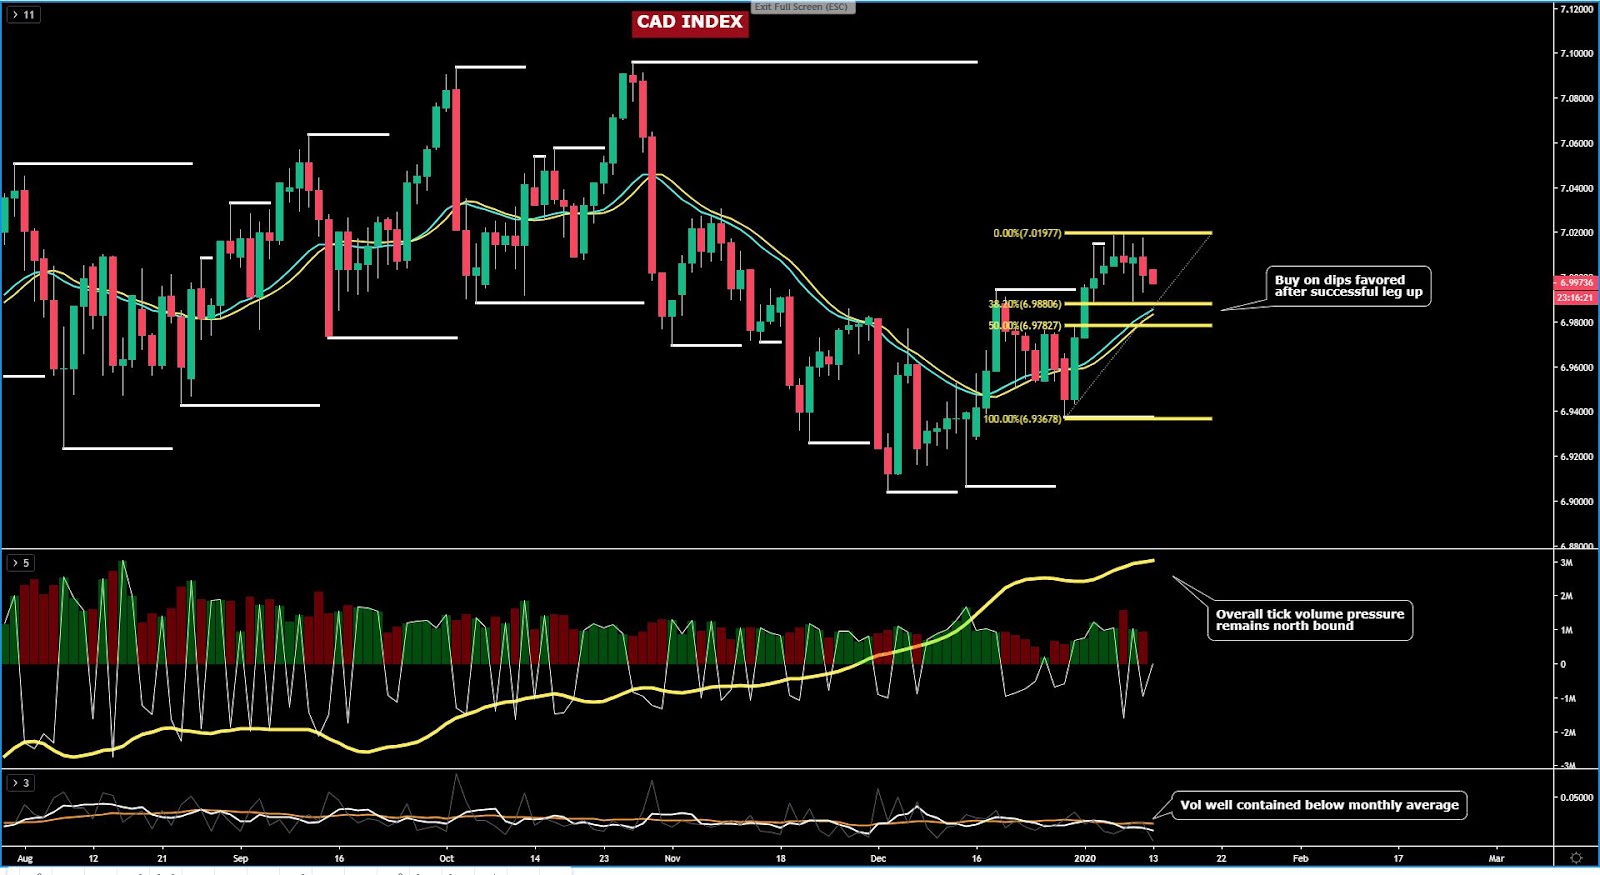
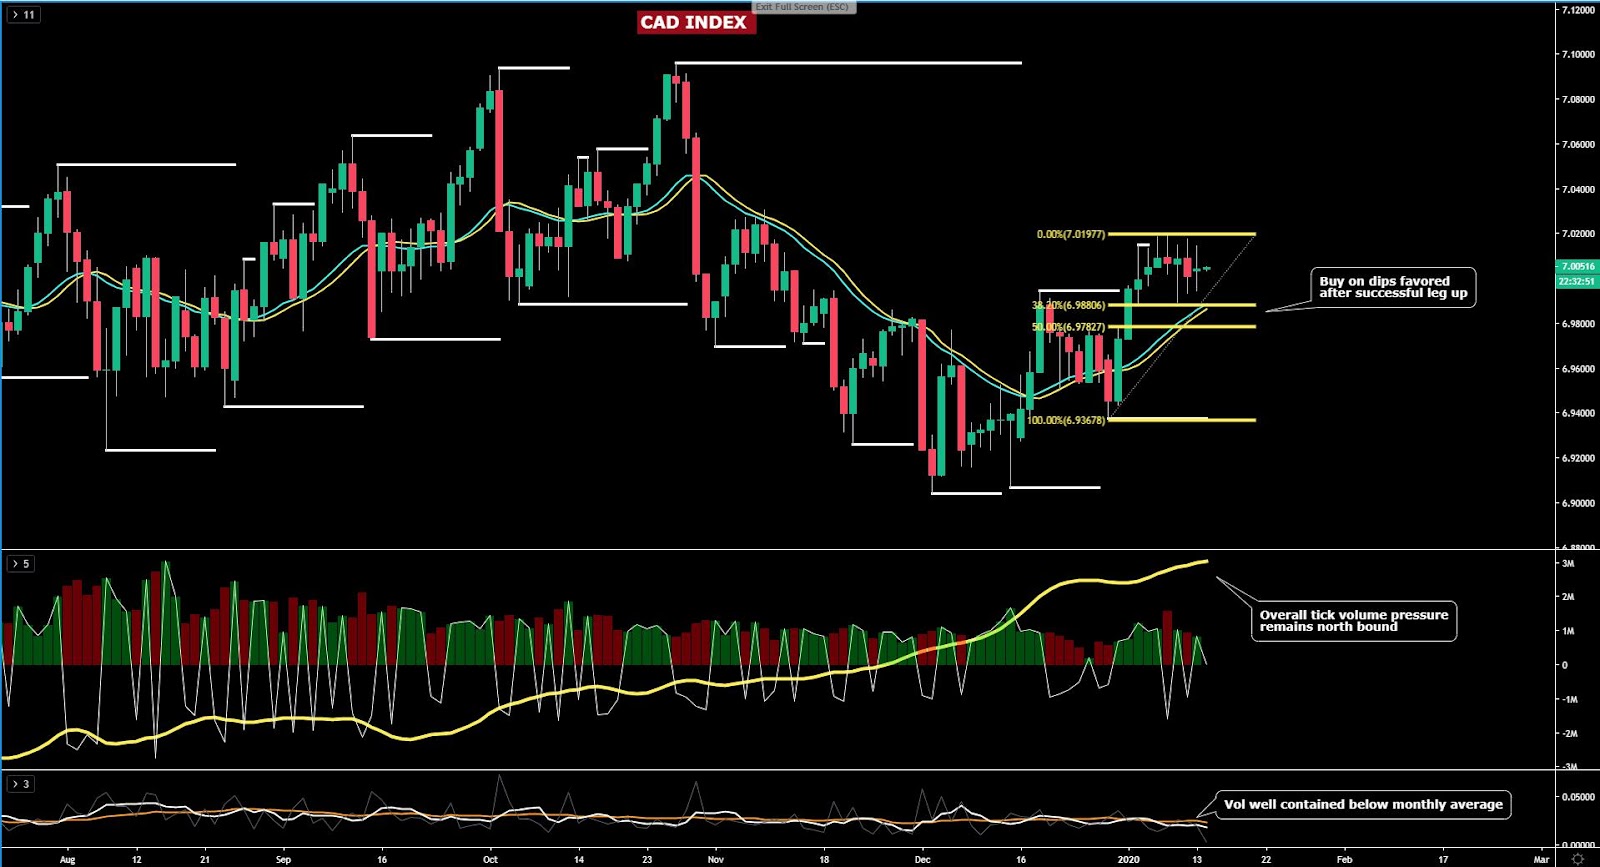
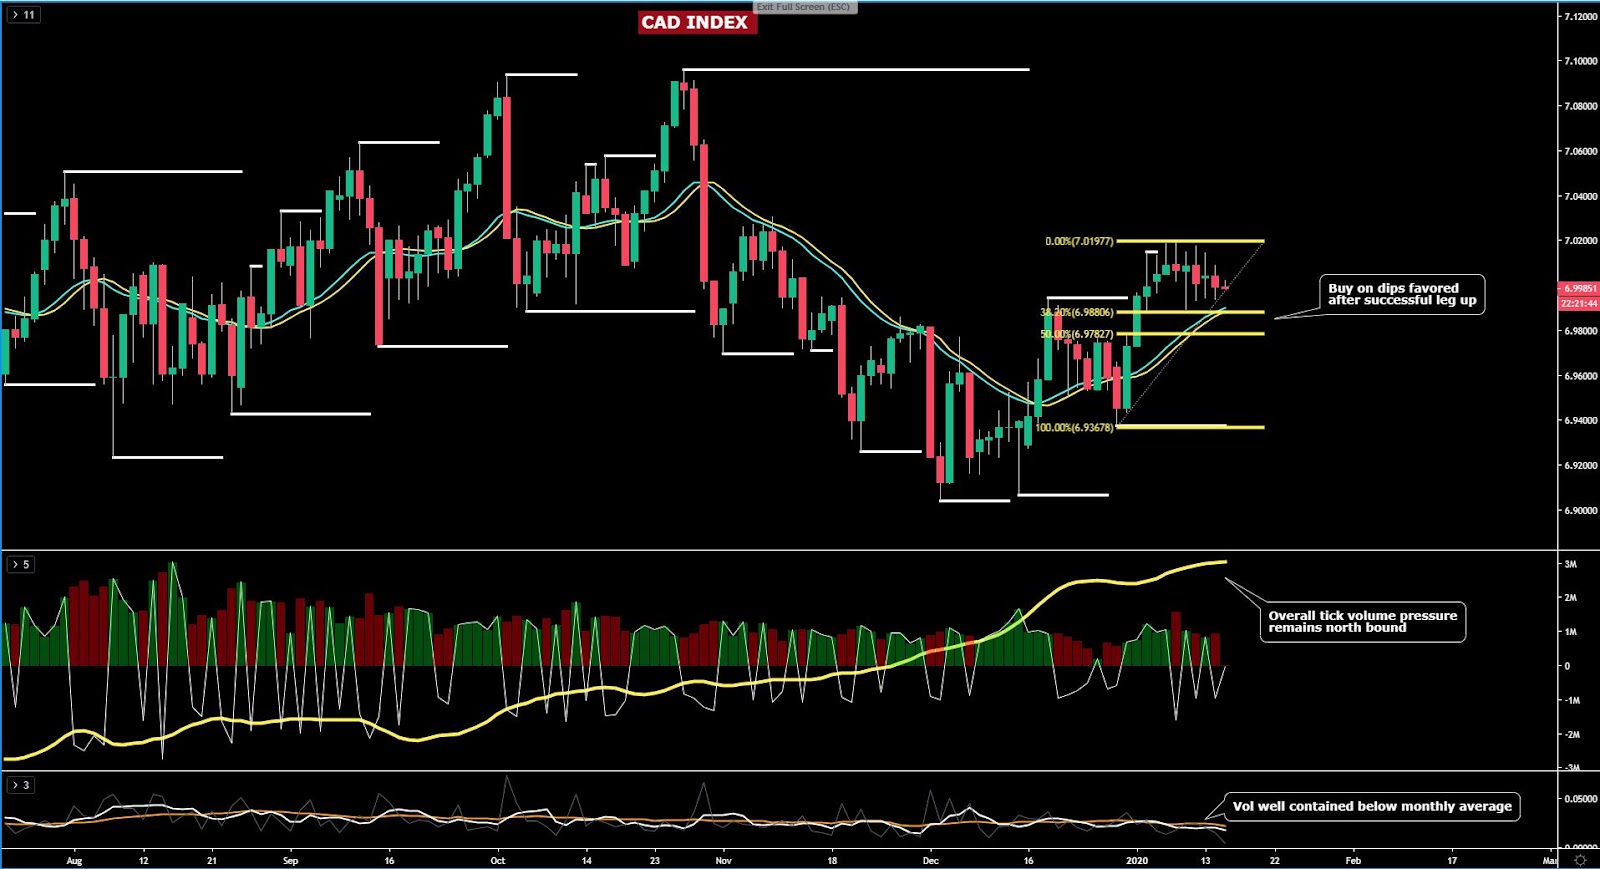
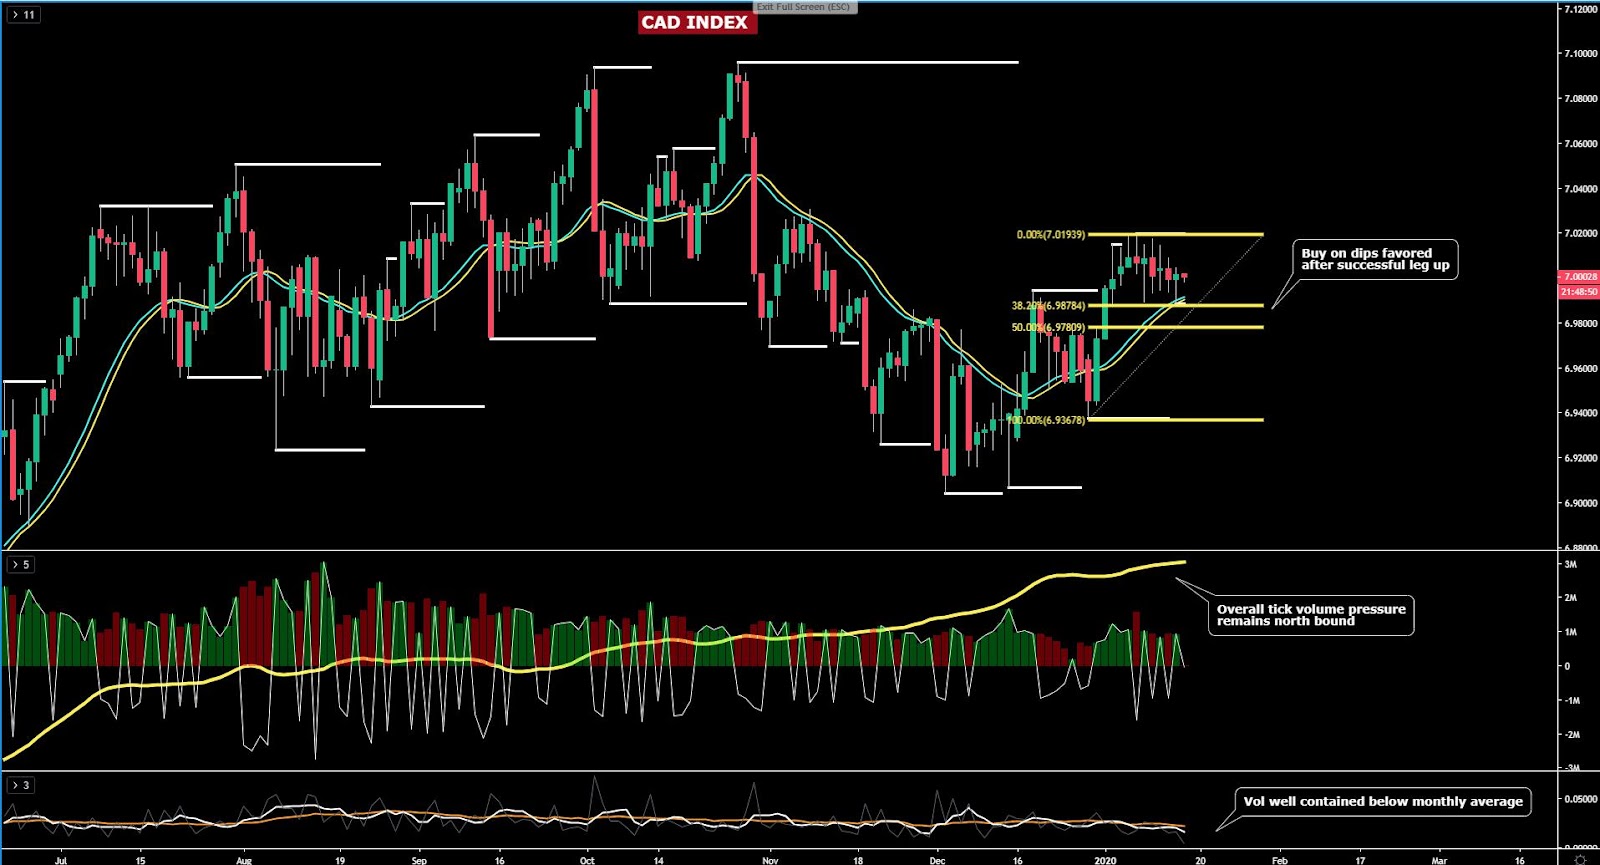
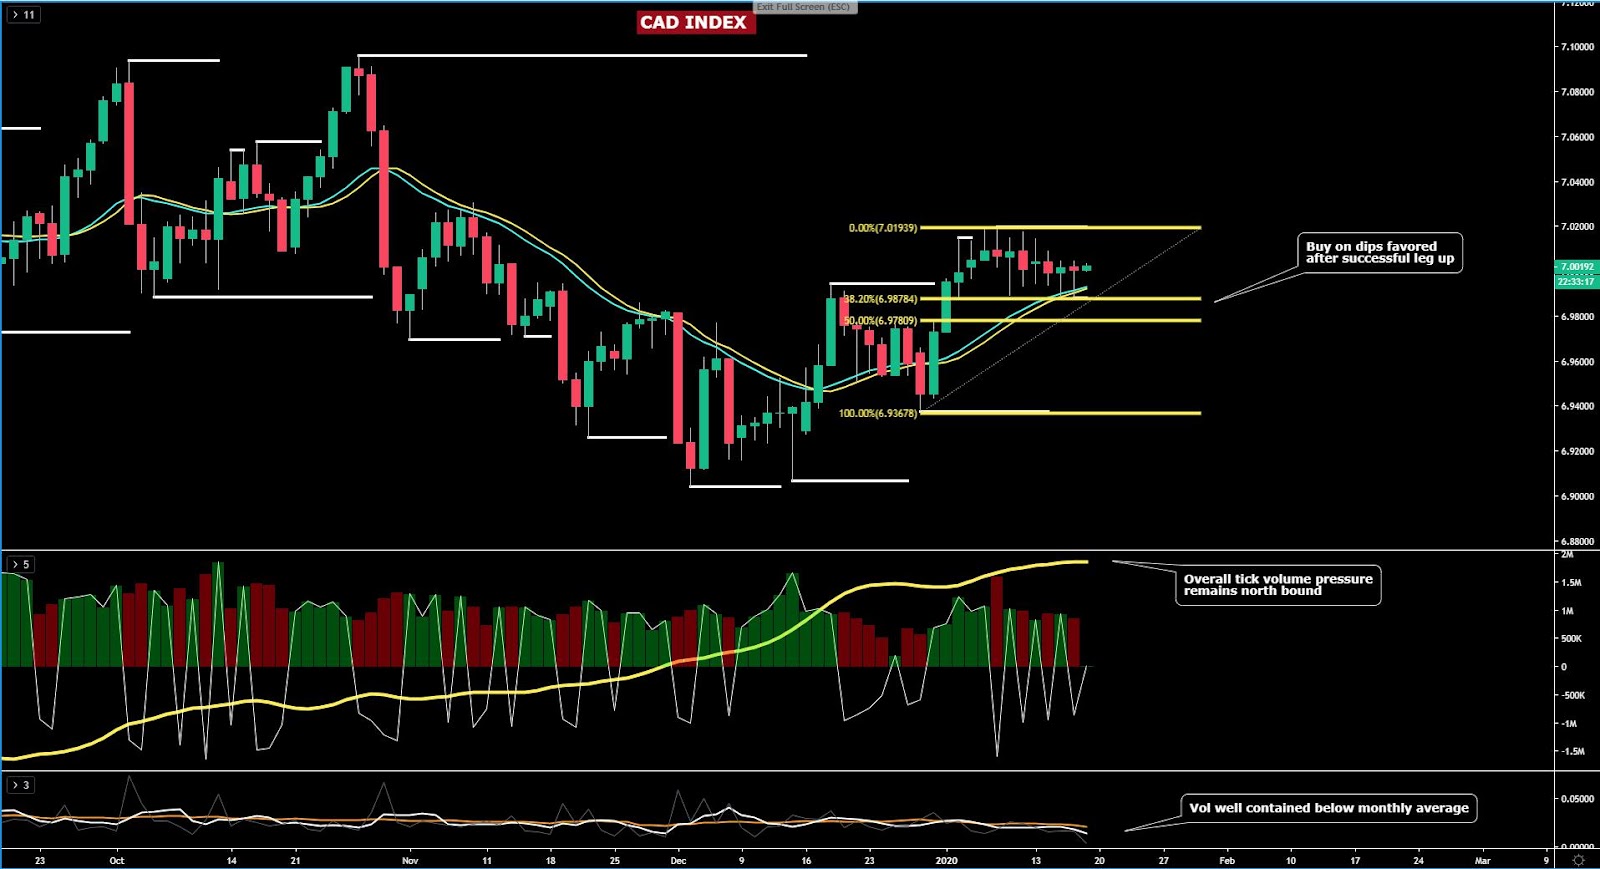
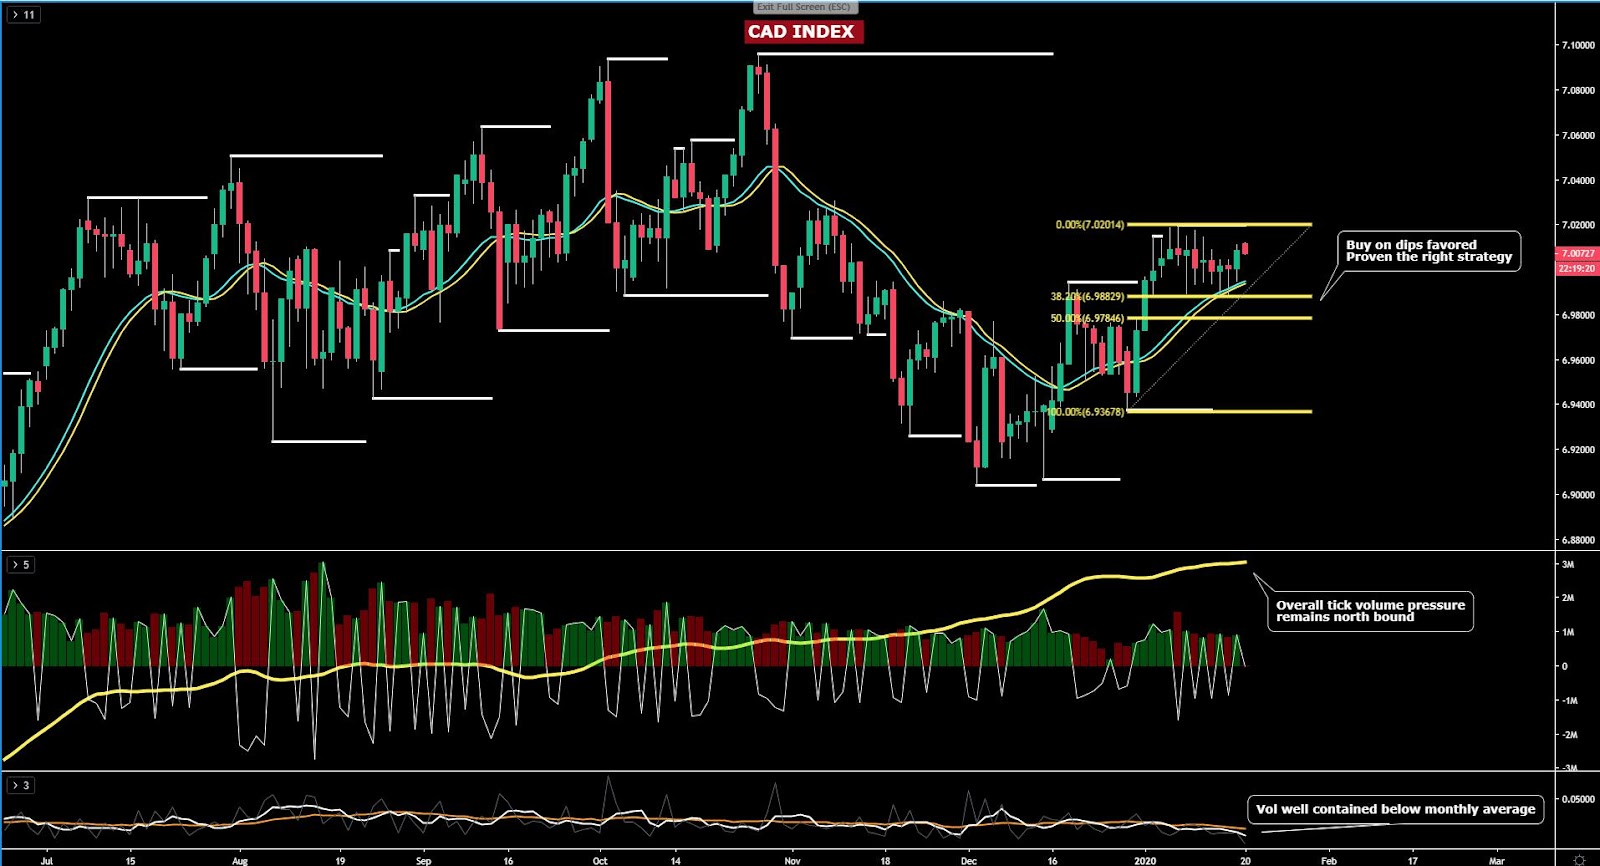
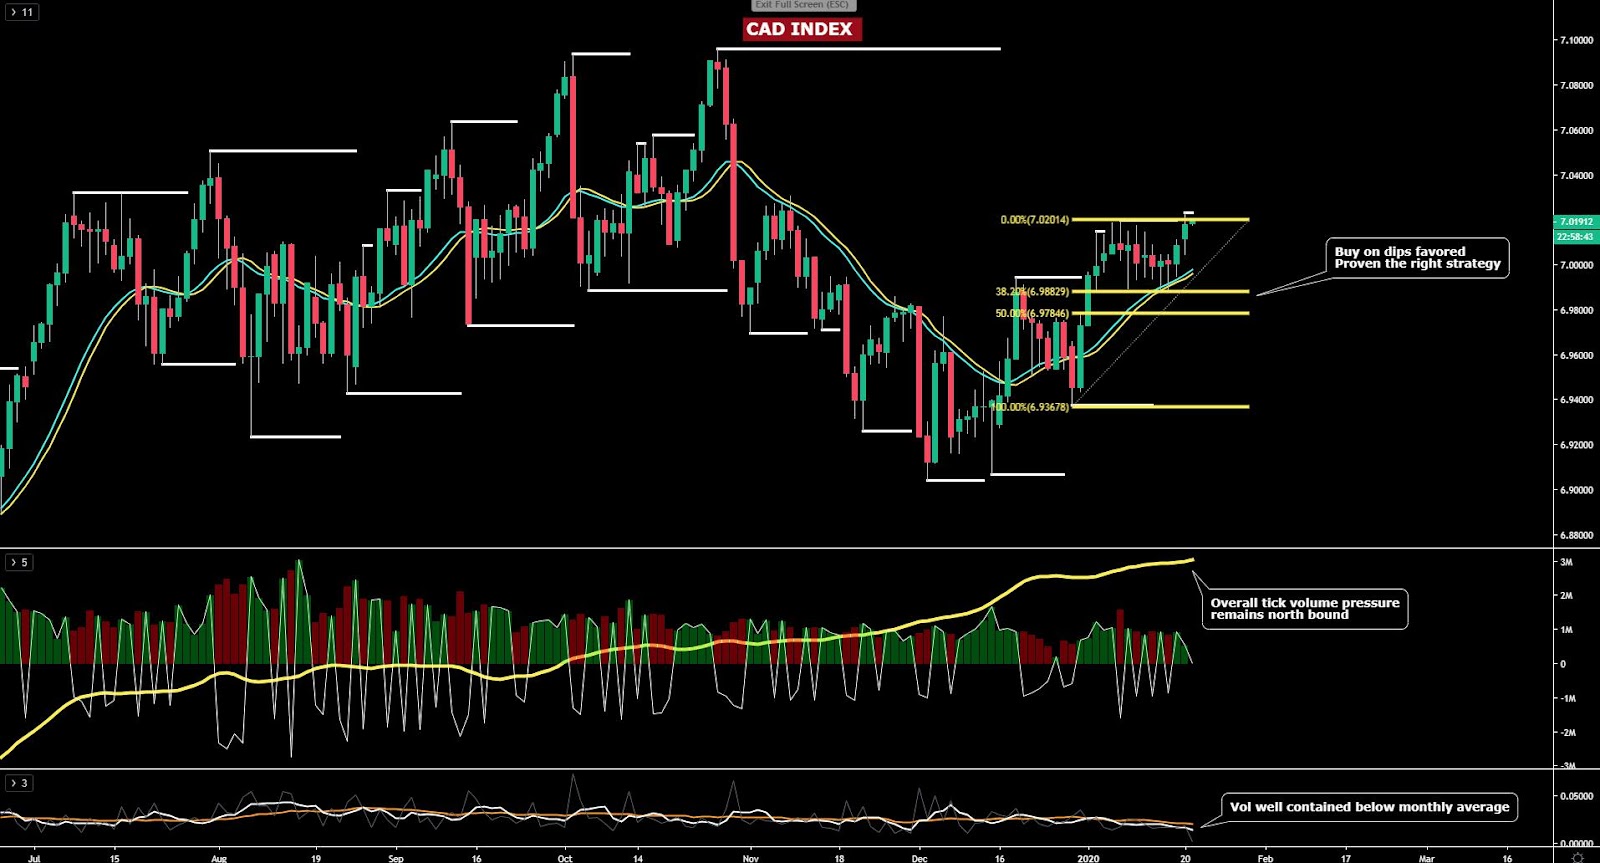
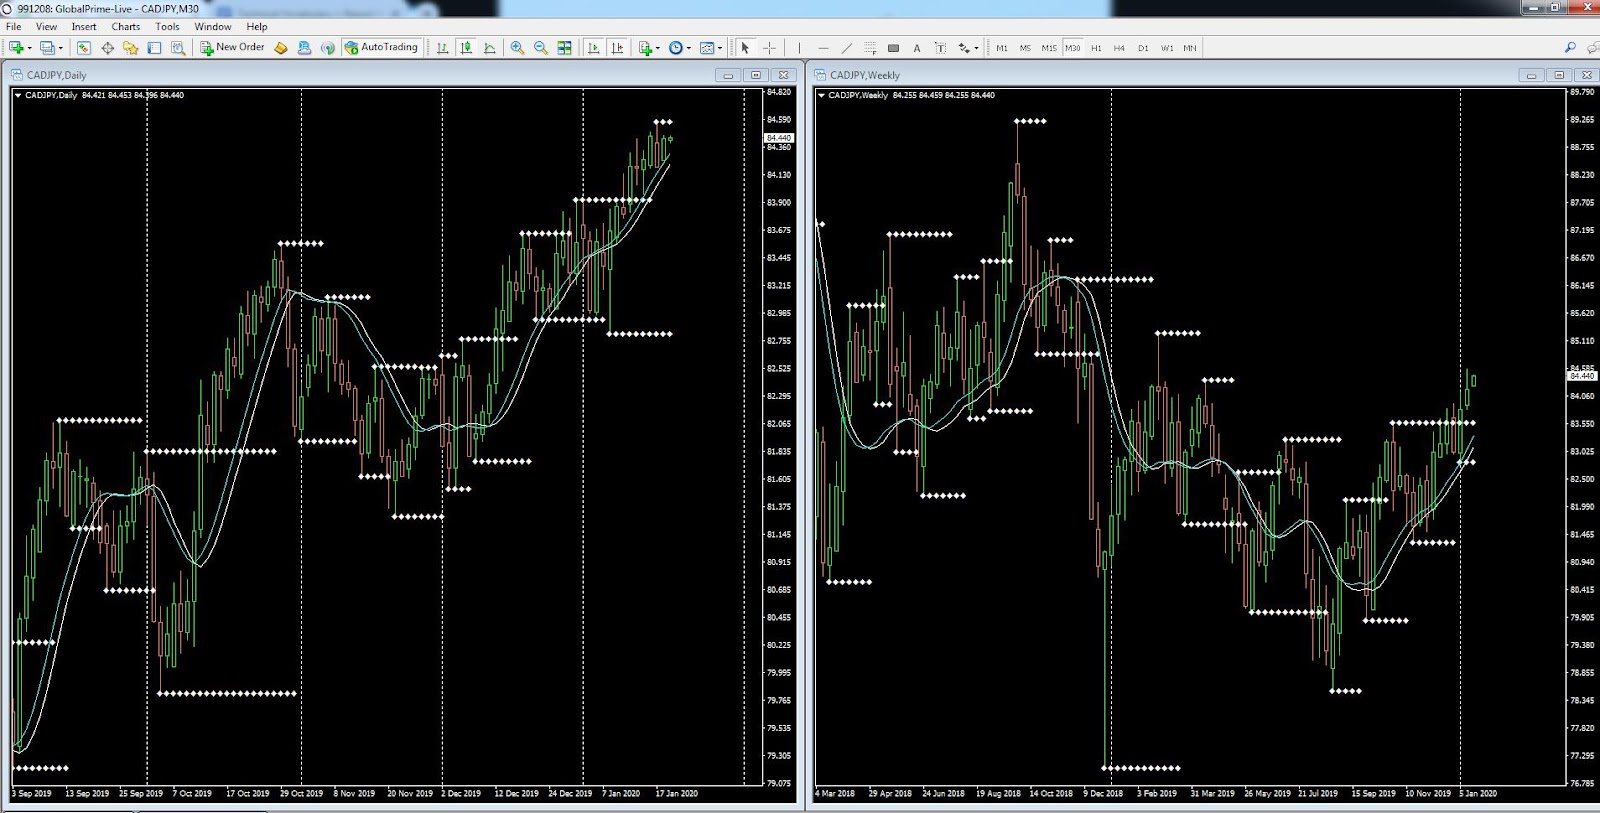
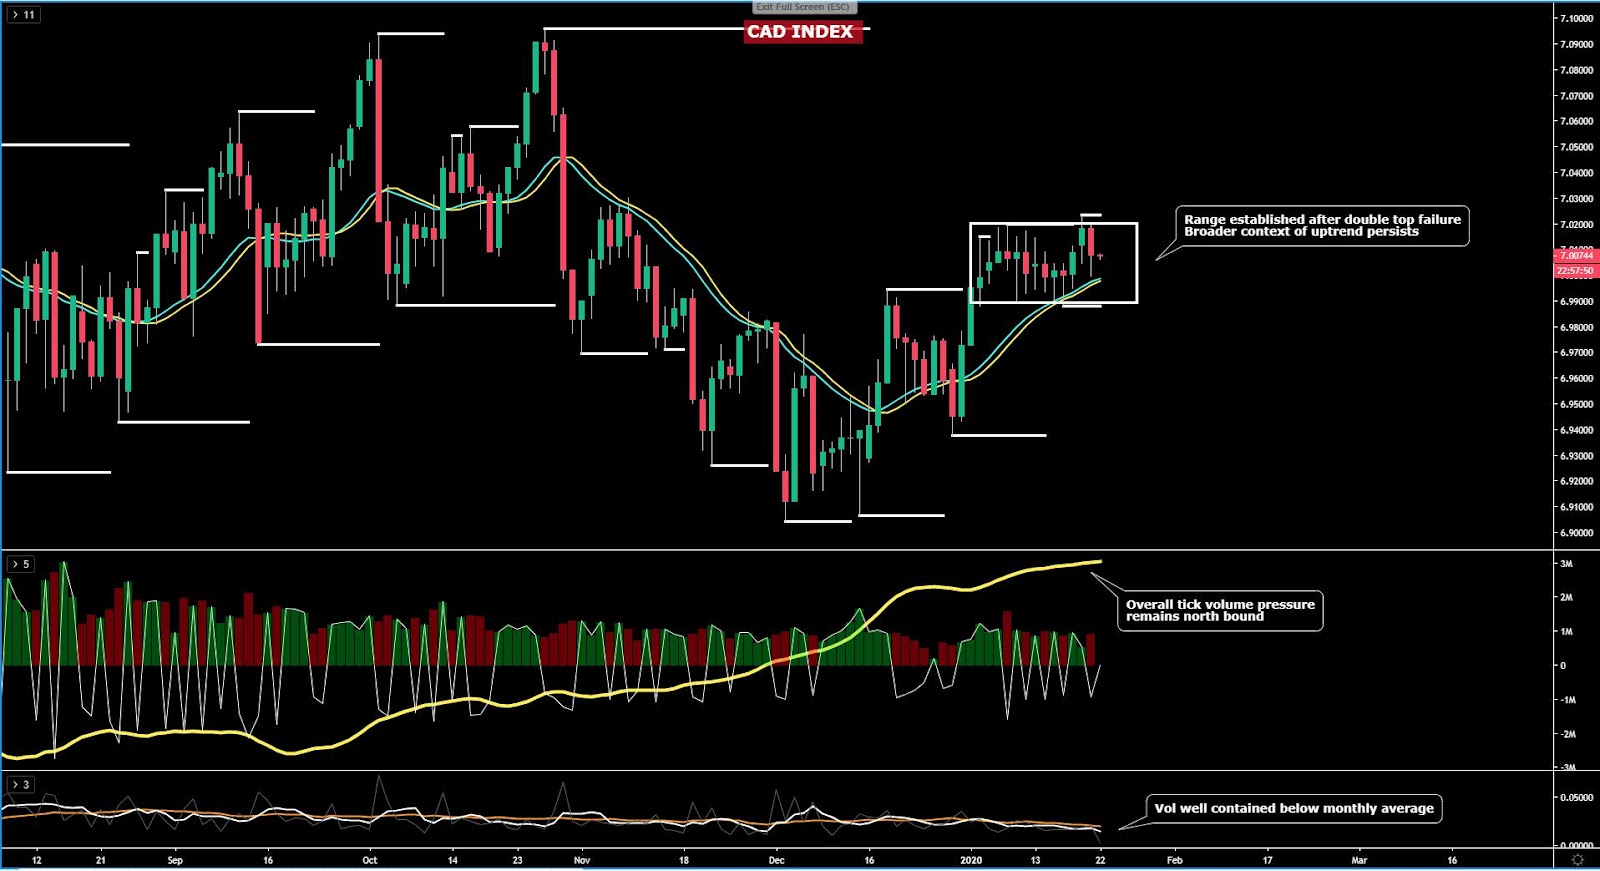
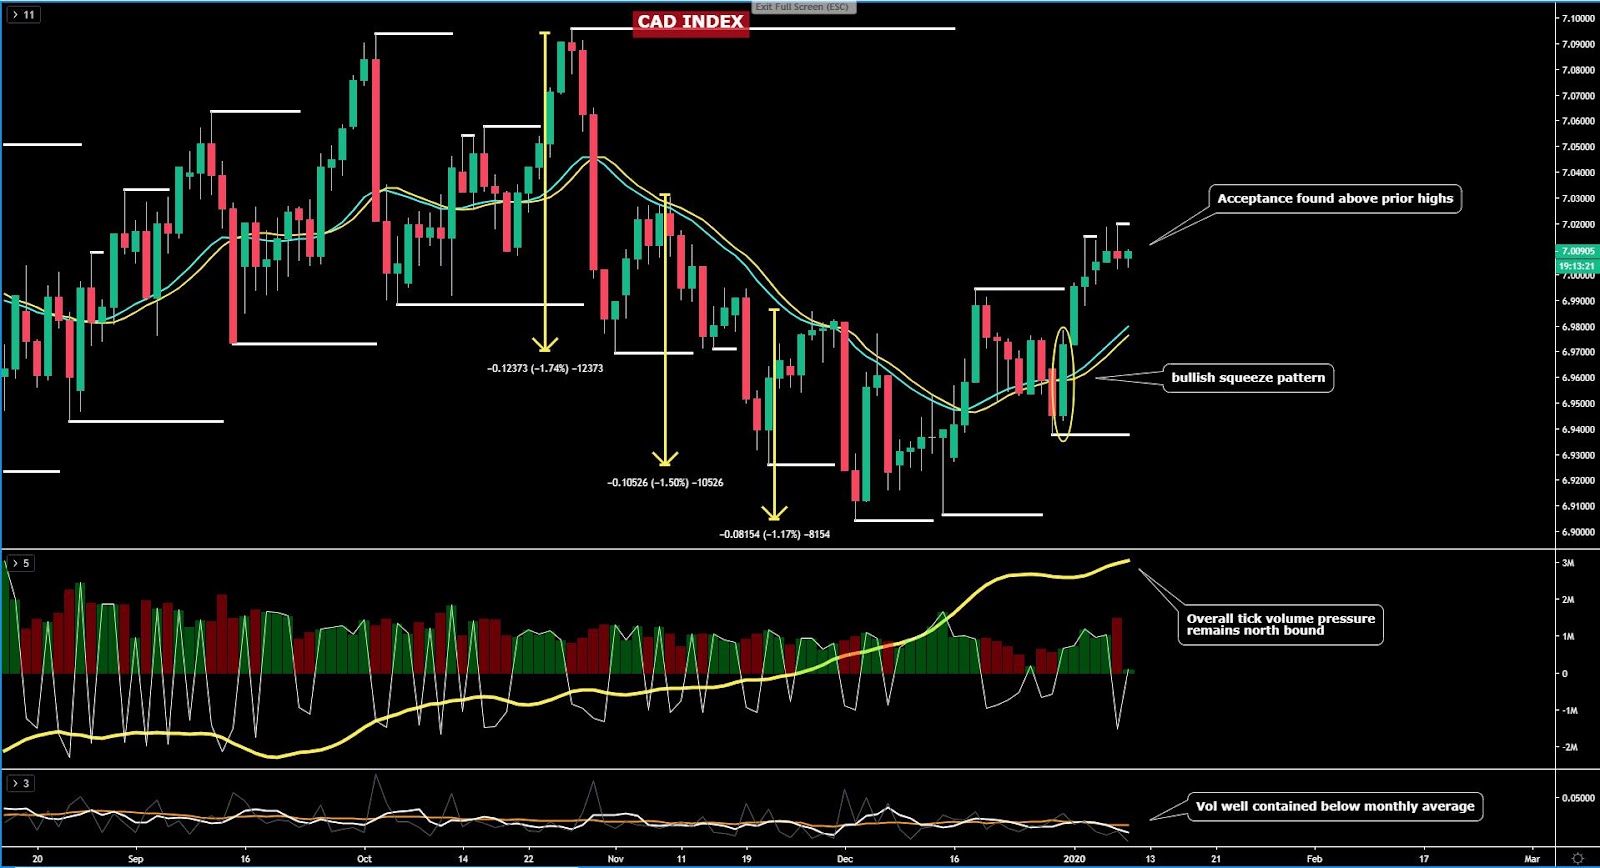
The CAD index is the best positioned to keep extending its gains in the following days/weeks. The index shows ideal conditions to jump on the bandwagon of the currency to scalp this market intraday or if you are a trend following traday, then it also satisfies the pre-requisites. Engaging in the accumulation of CAD long inventory has the backing of the price structure, the smart money flows via the enhance moving average, the aggregated tick volume trend, even the relatively low volatility in the index when compared to the monthly historical is another positive as those looking to capitalize on trends prefer this one to develop in a low vol fashion. The CAD, at an index levels, paints a storyline very much in congruence with my bullish view on the currency, predicated on the fact that the BOC is one of the outlier Central Banks still paying a relatively much higher interest rate than the rest of the G8 FX space. The seasonals for the CAD are also positive, averaging over 0.33% of gains in Jan for the past 36 years.
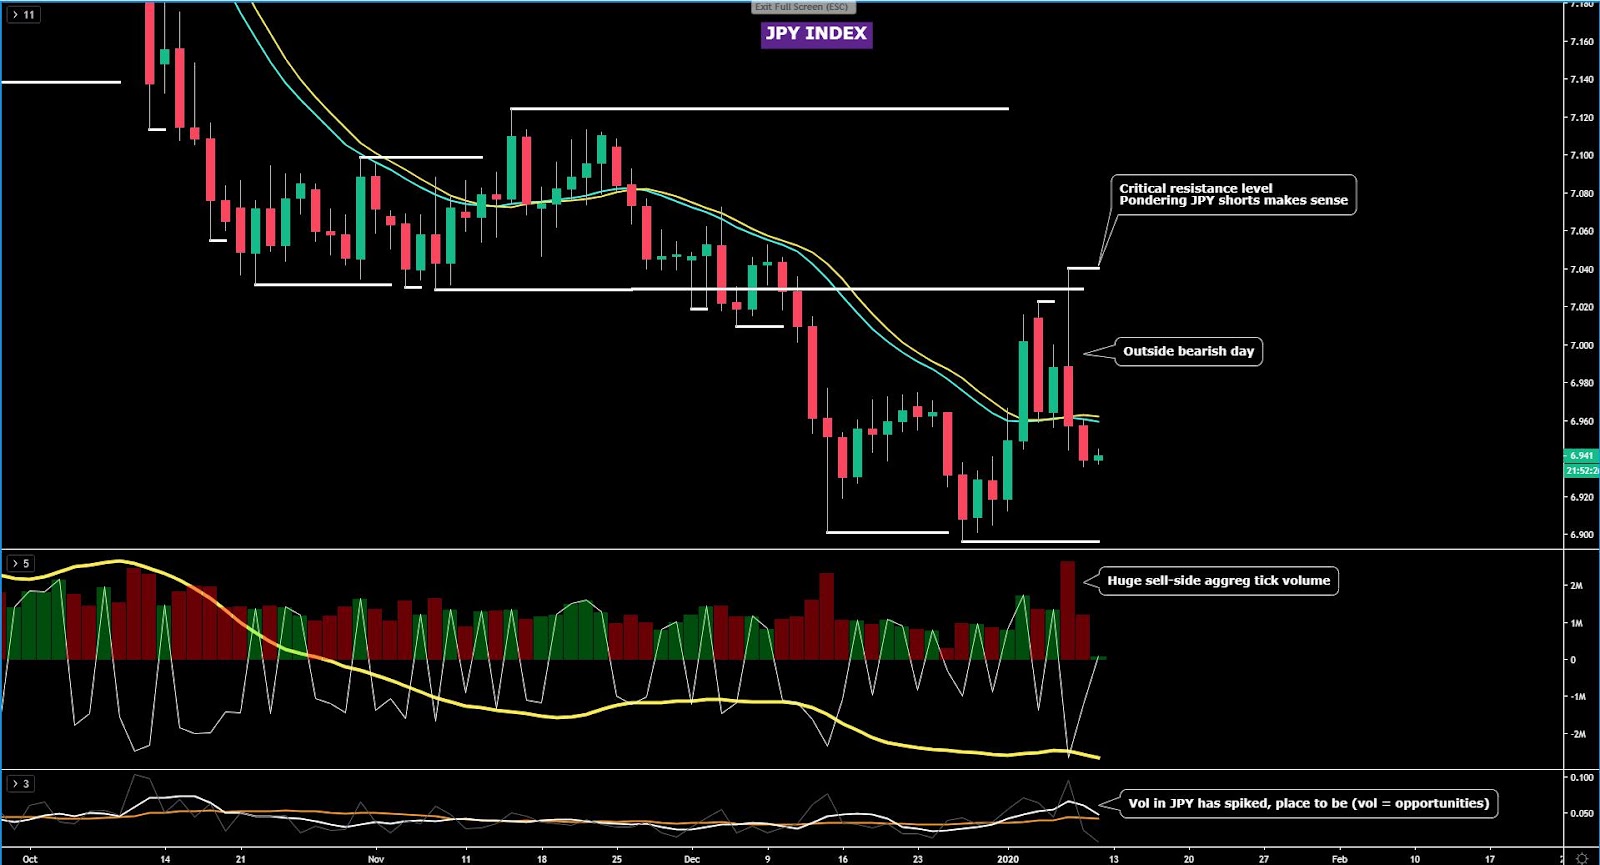
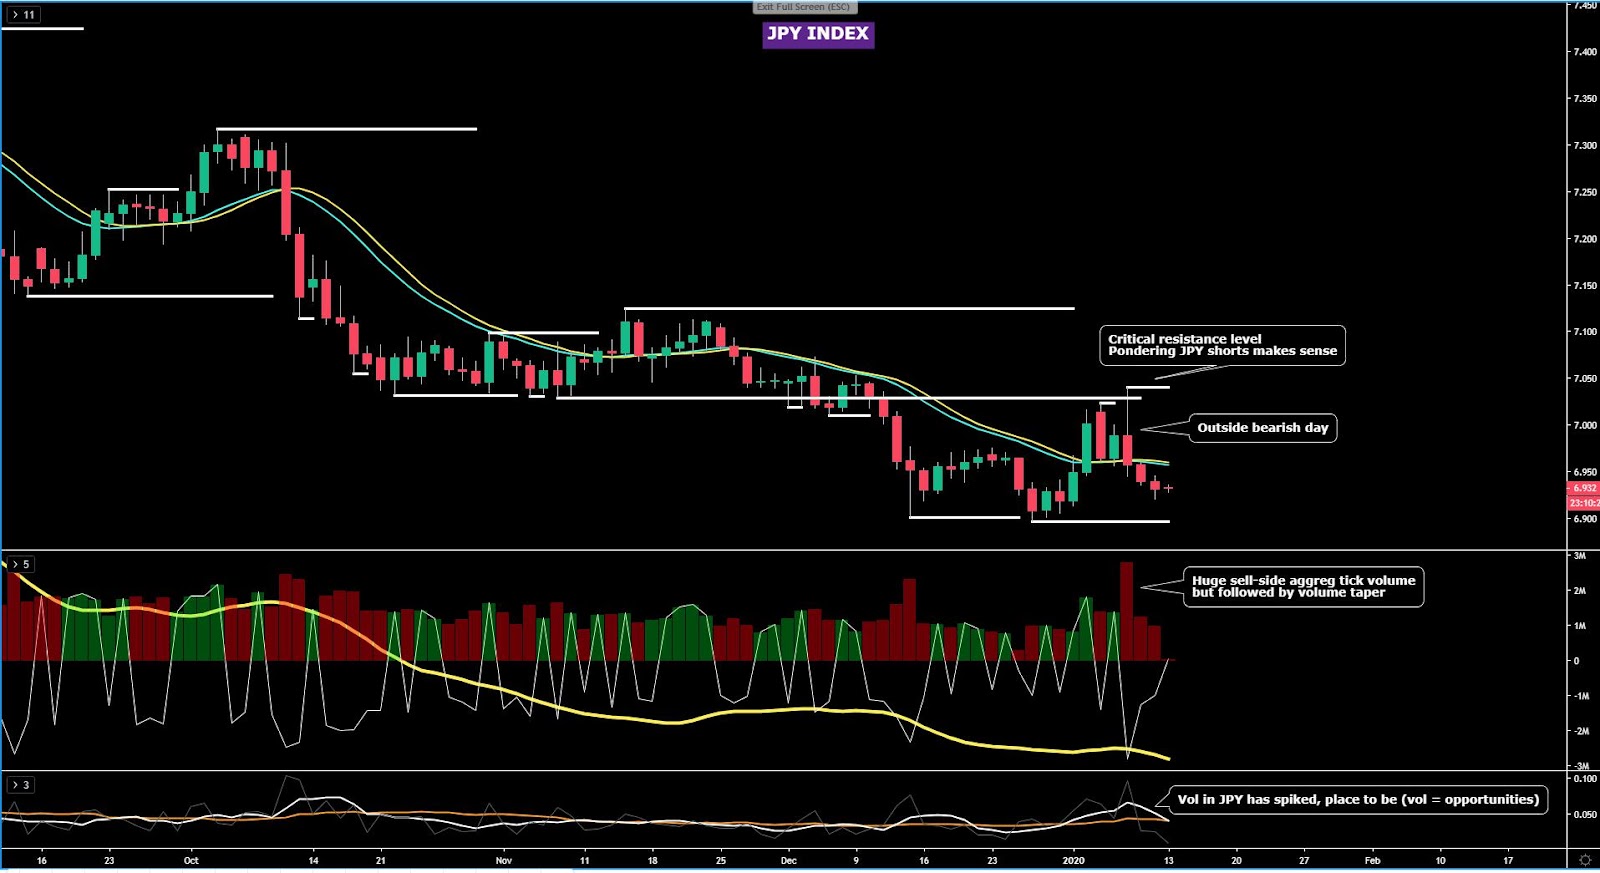
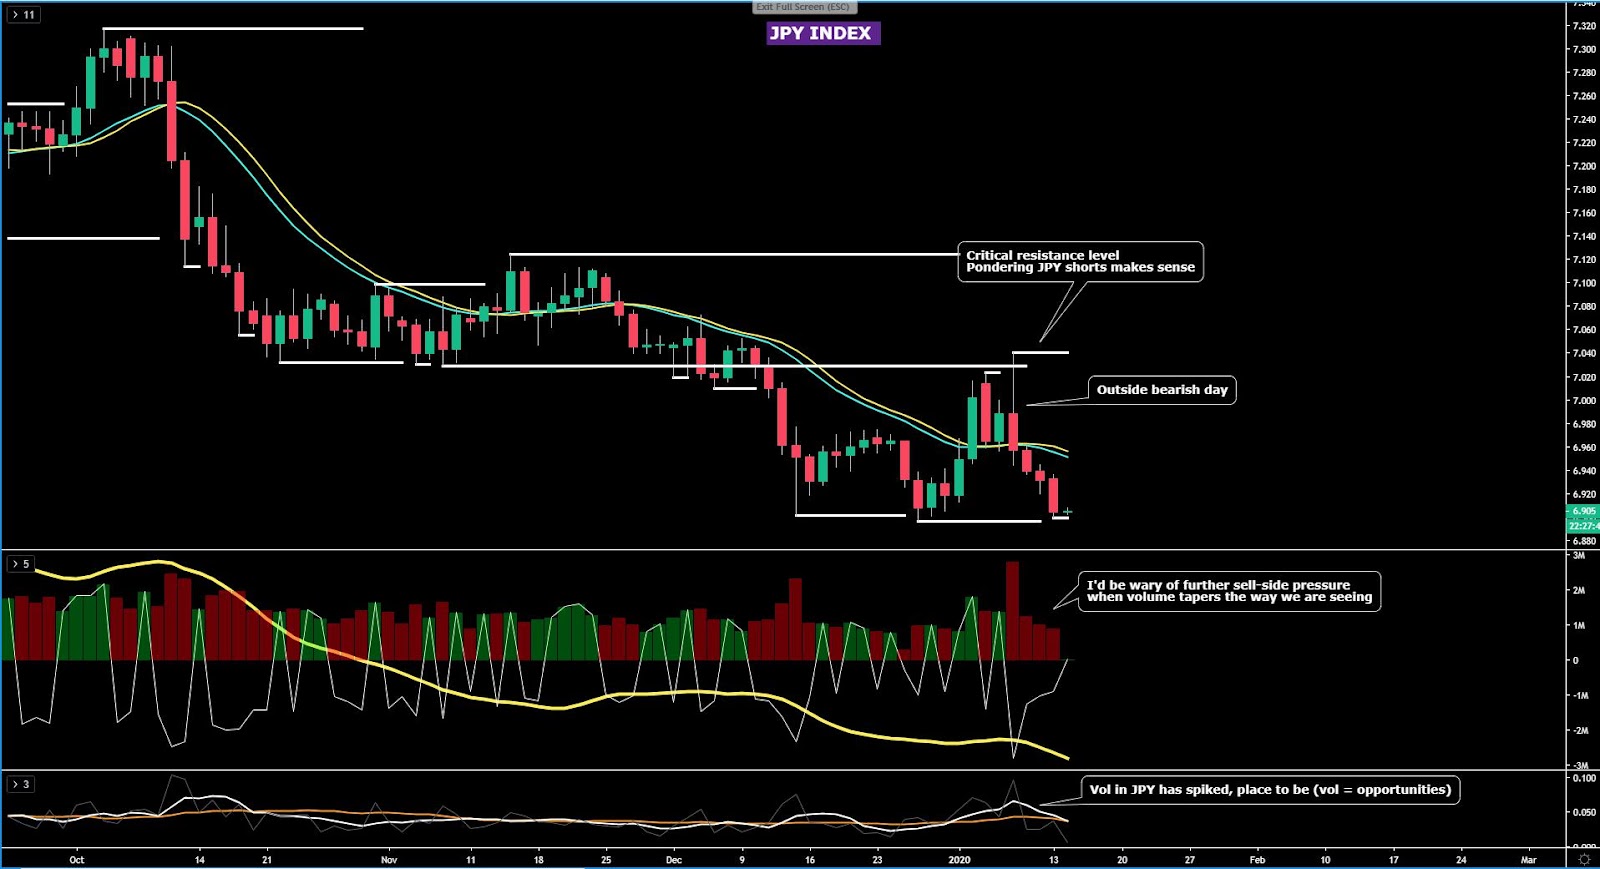
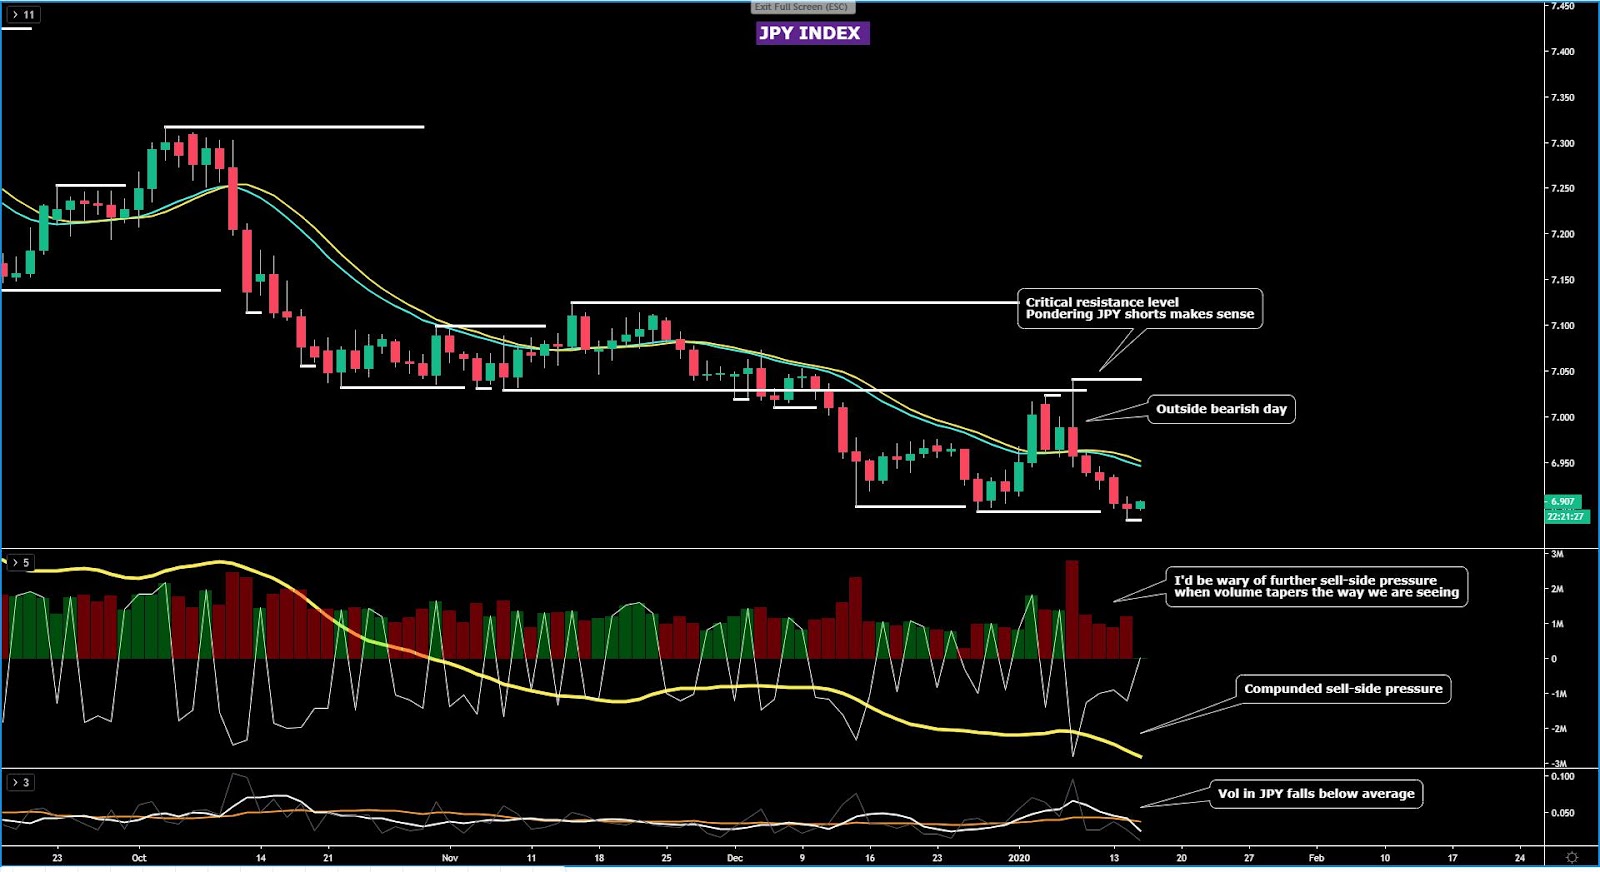
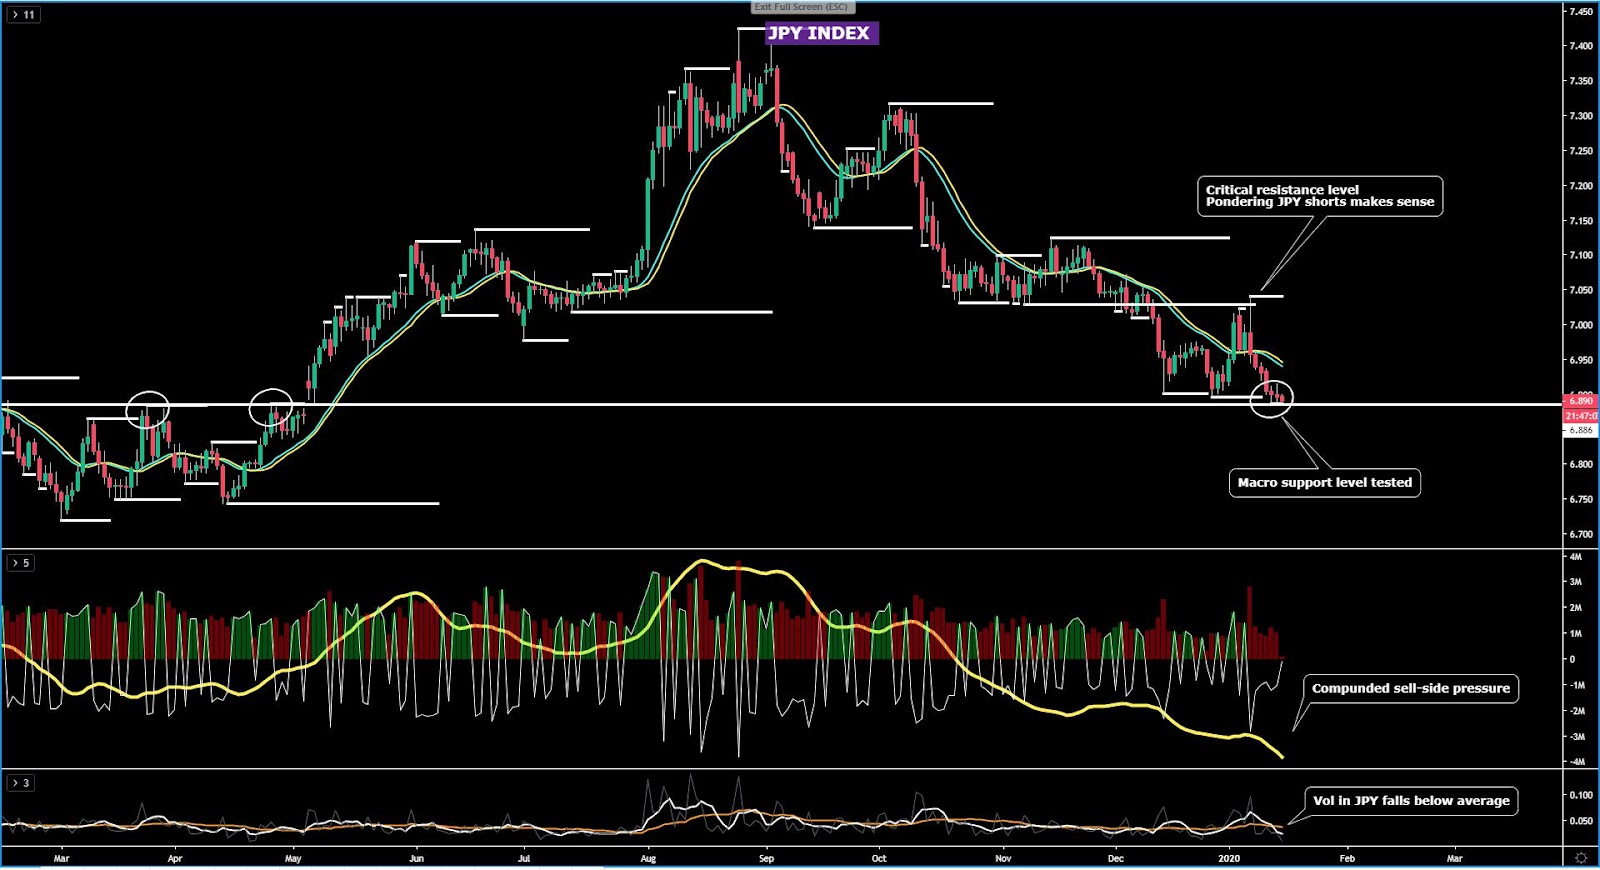
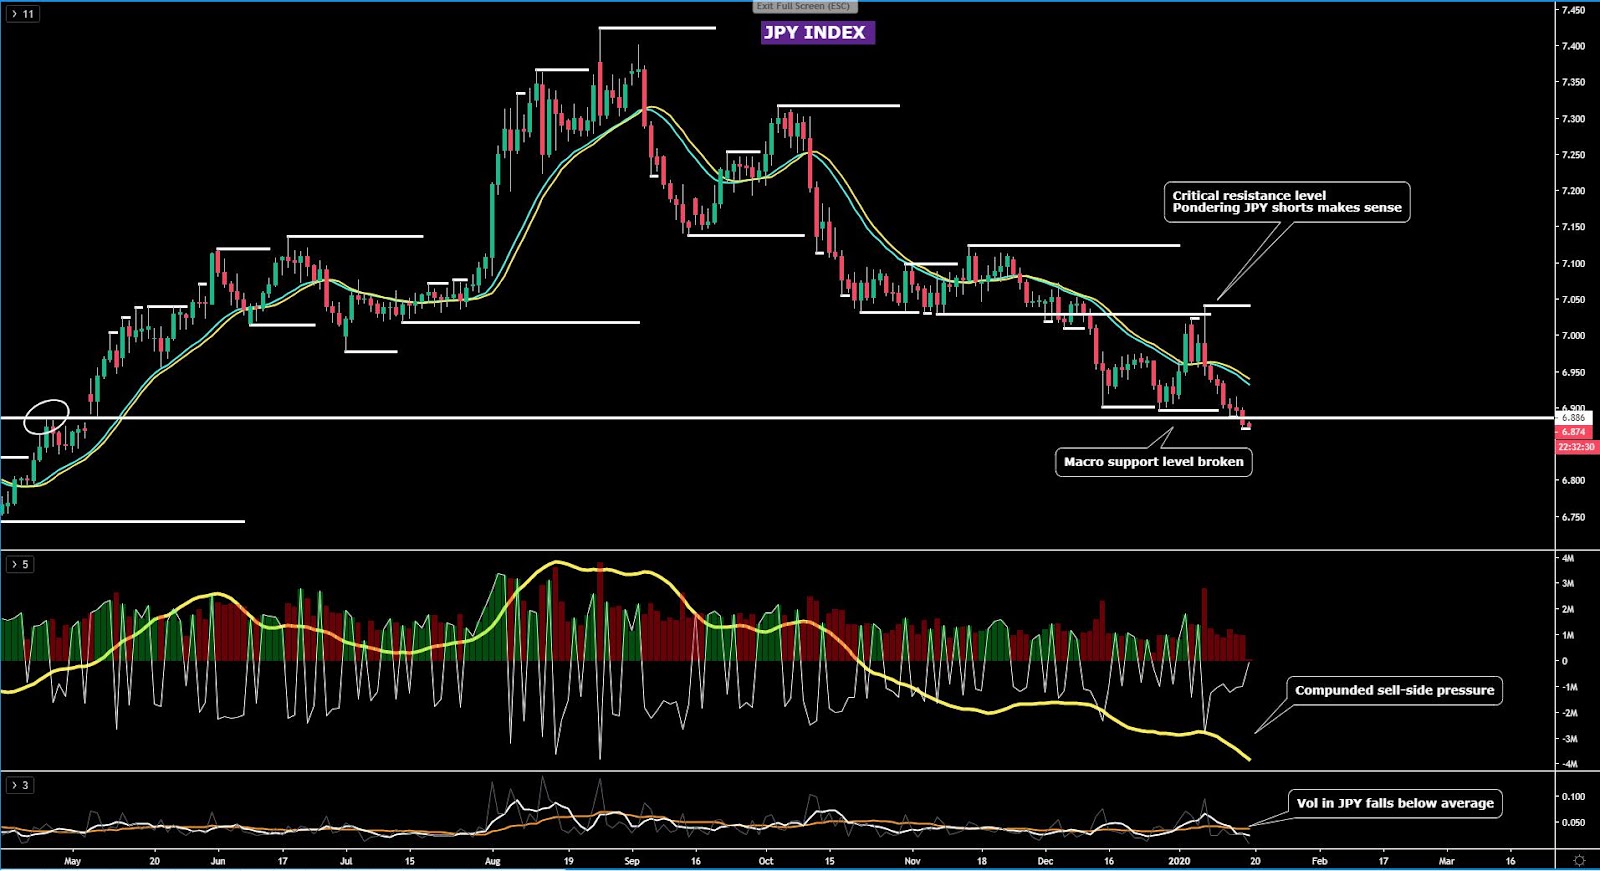
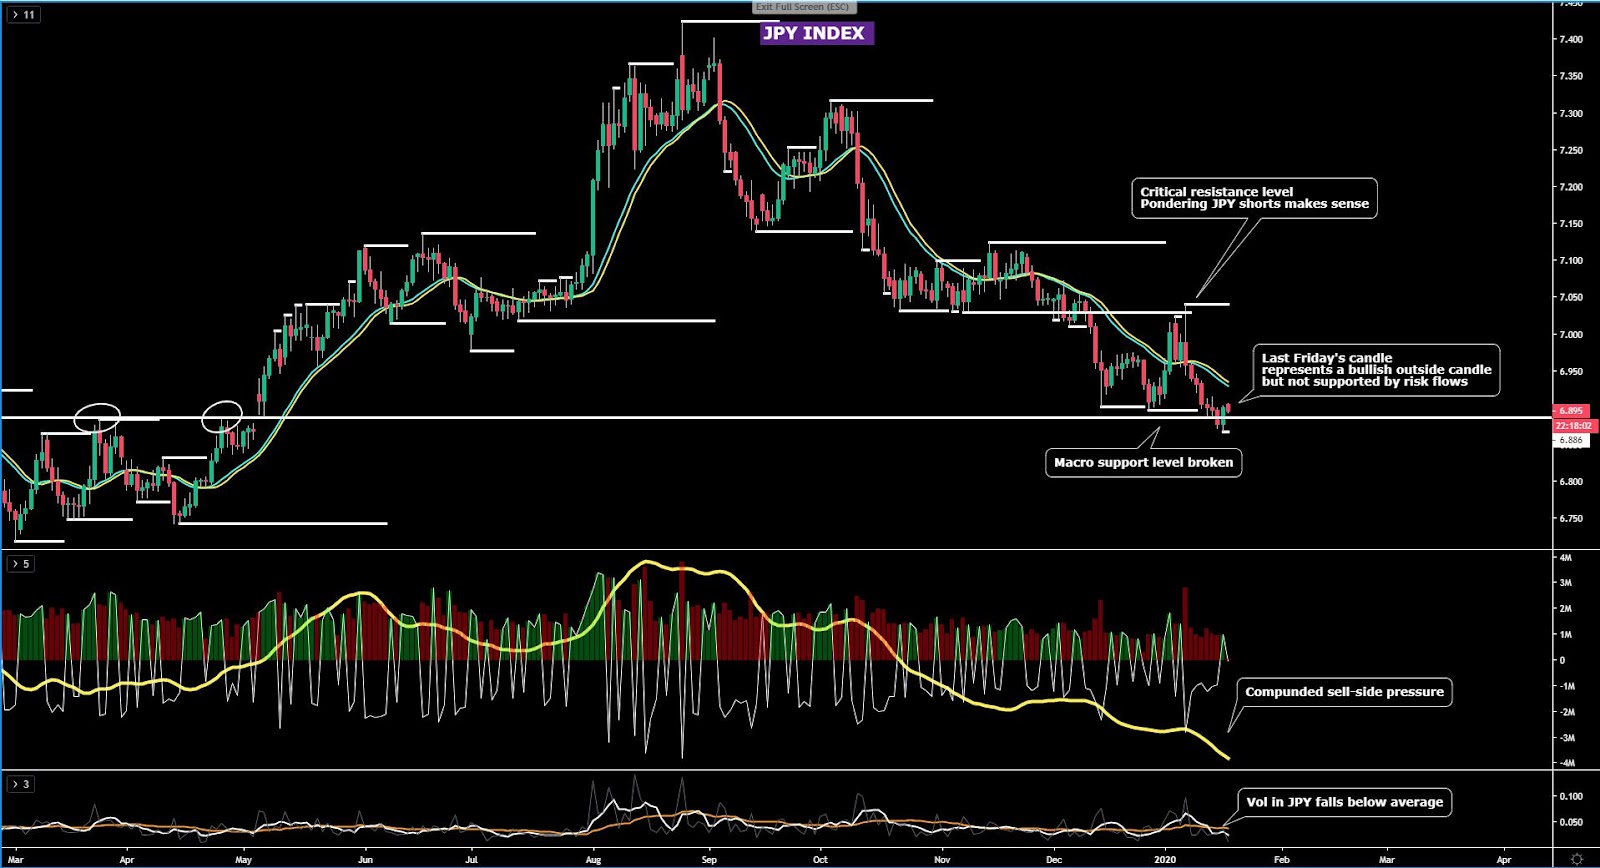
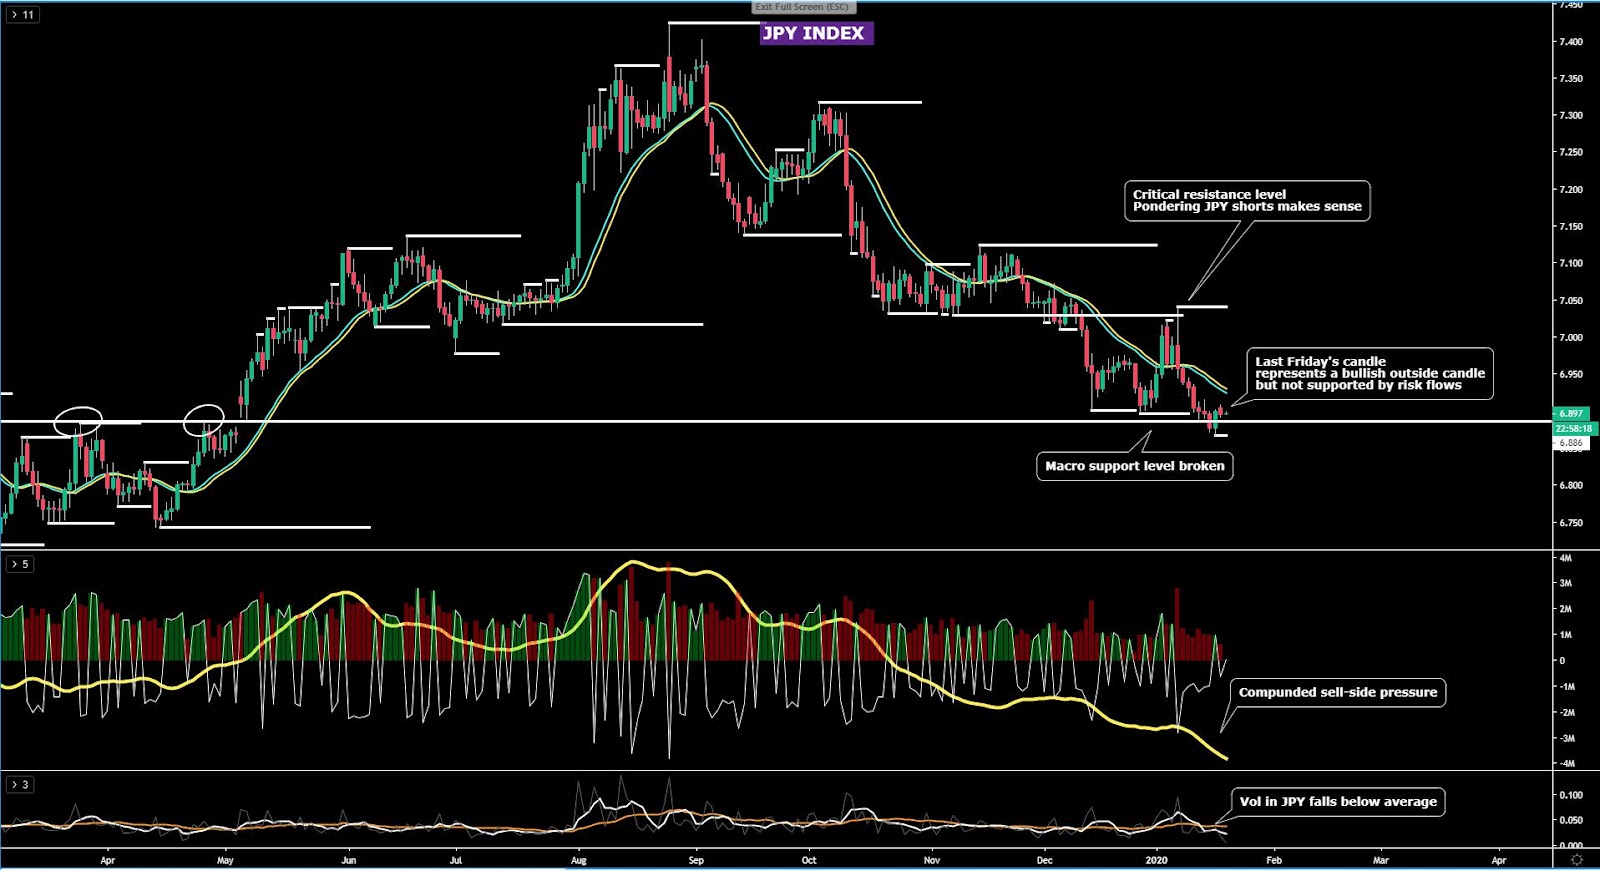
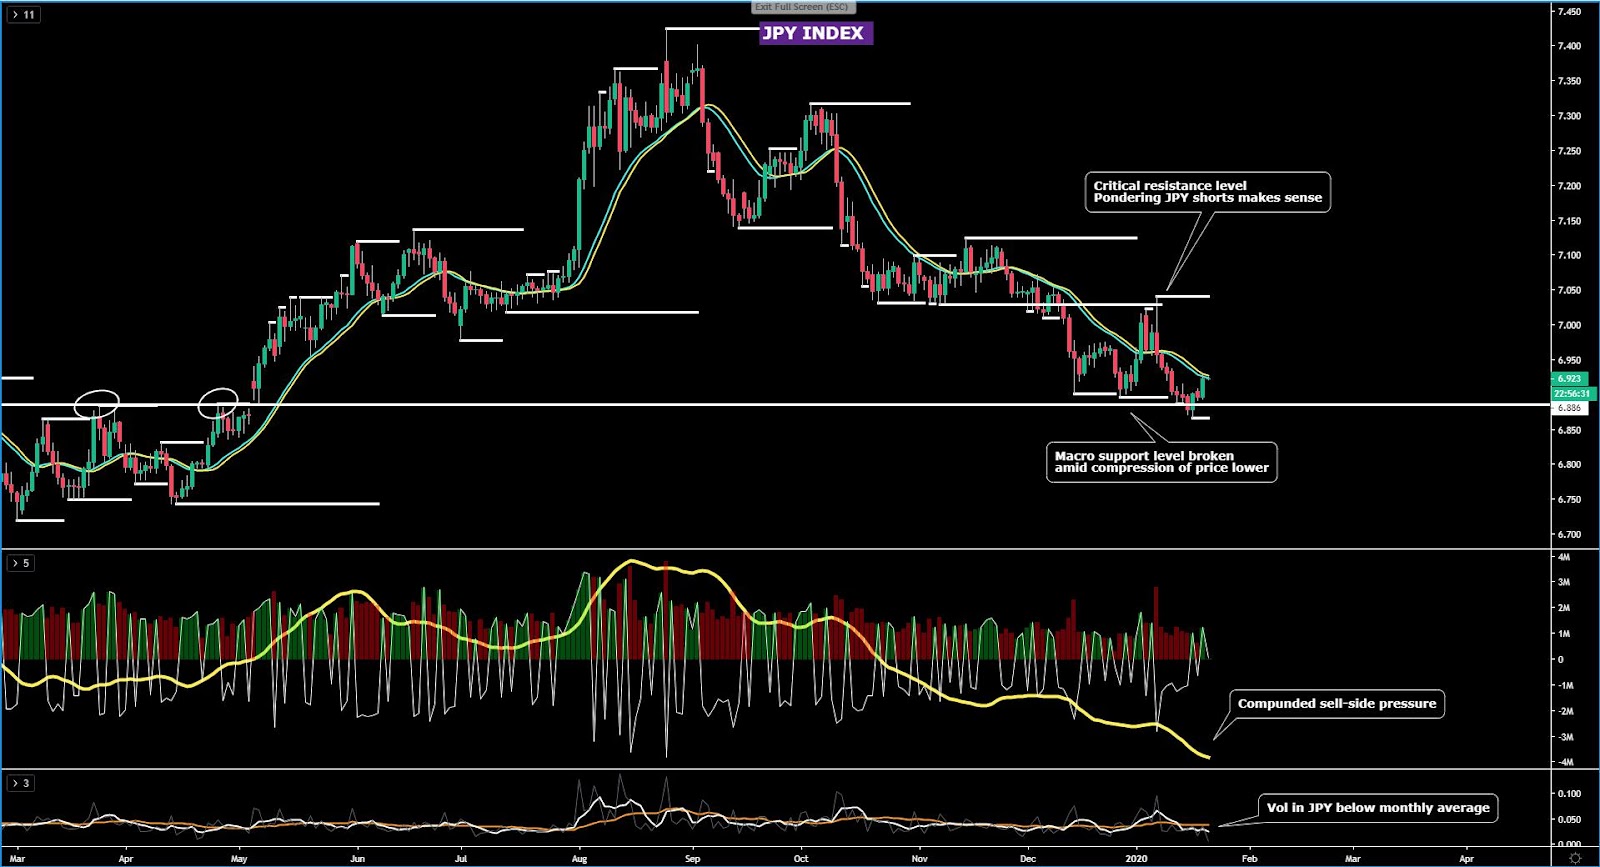
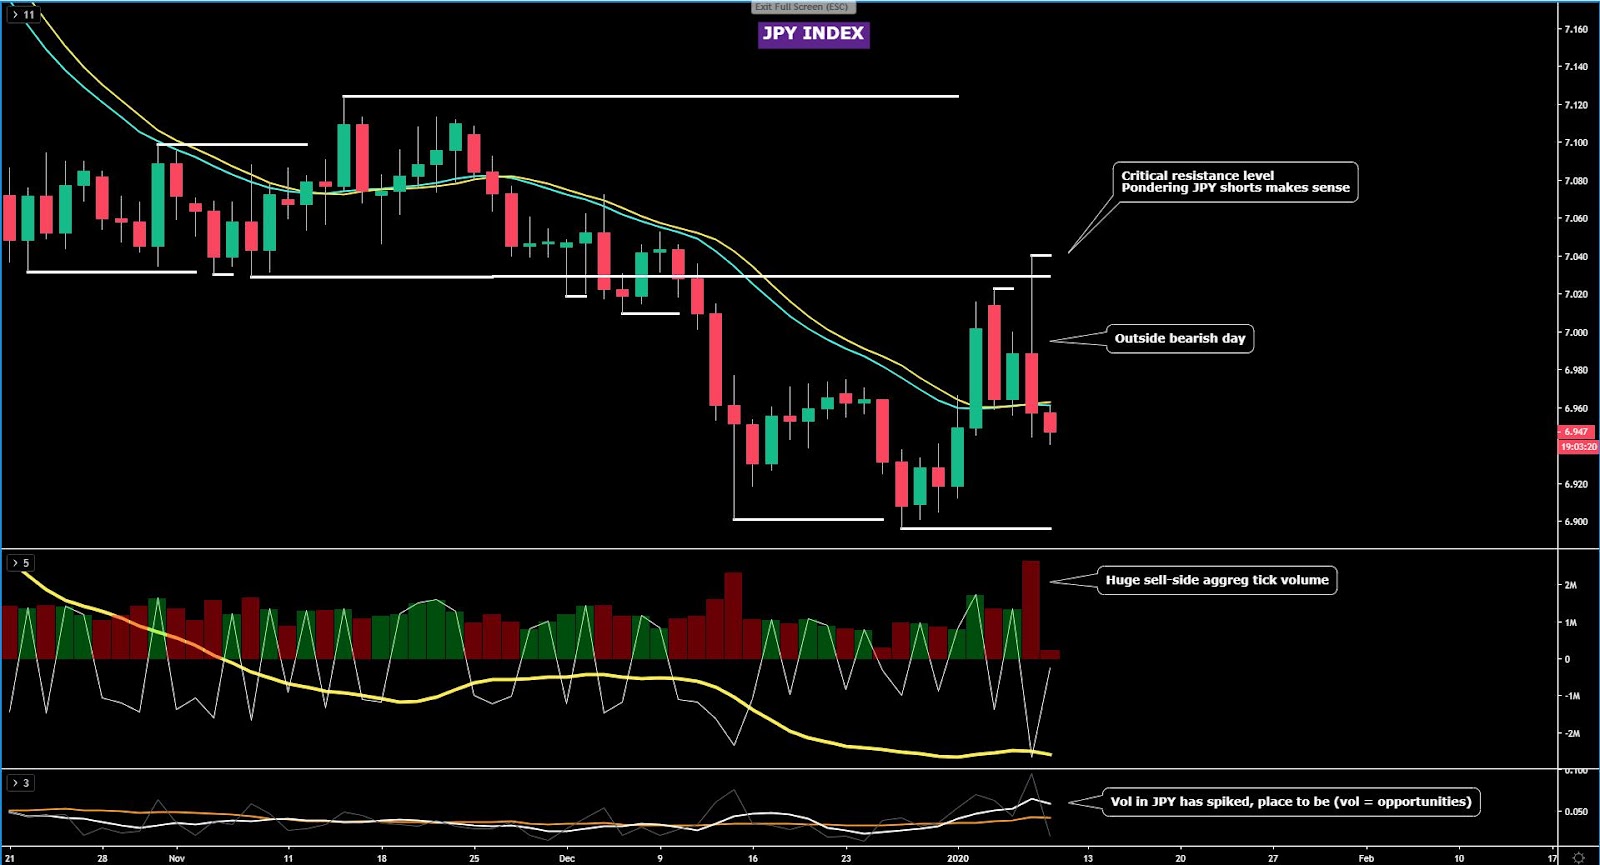
The JPY index has printed a sizeable bearish outside day candle that accomplishes on its own right the purpose of guiding us in the next probably direction (down). Price action candles of this high-quality calibre are few and far in between and widely scattered, so we must pay attention. The candle negates the bullish price structure and brings back into focus a retest of the previous lows in line with the dominant flows as per the smart money flows (enhanced MA). The aggregated tick volume is also screaming that the commitment to lower the valuation was very high. Remember, while the seasonal pattern for the Yen averages +0.25% in Jan since Jan ‘82, the preponderance of evidence so far is that the currency may continue to struggle this month.
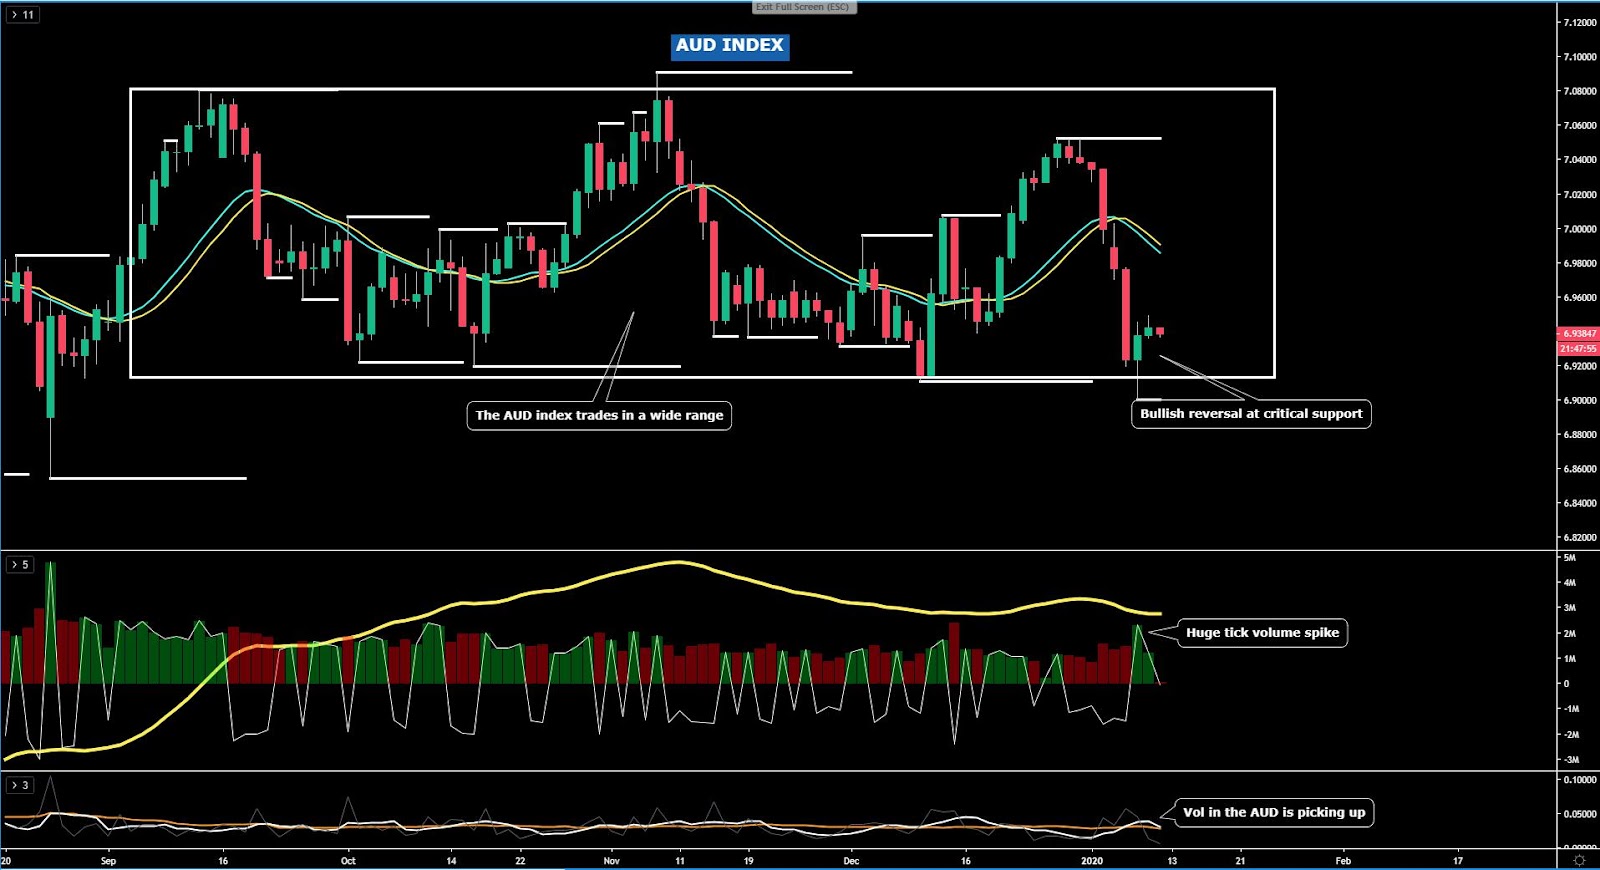
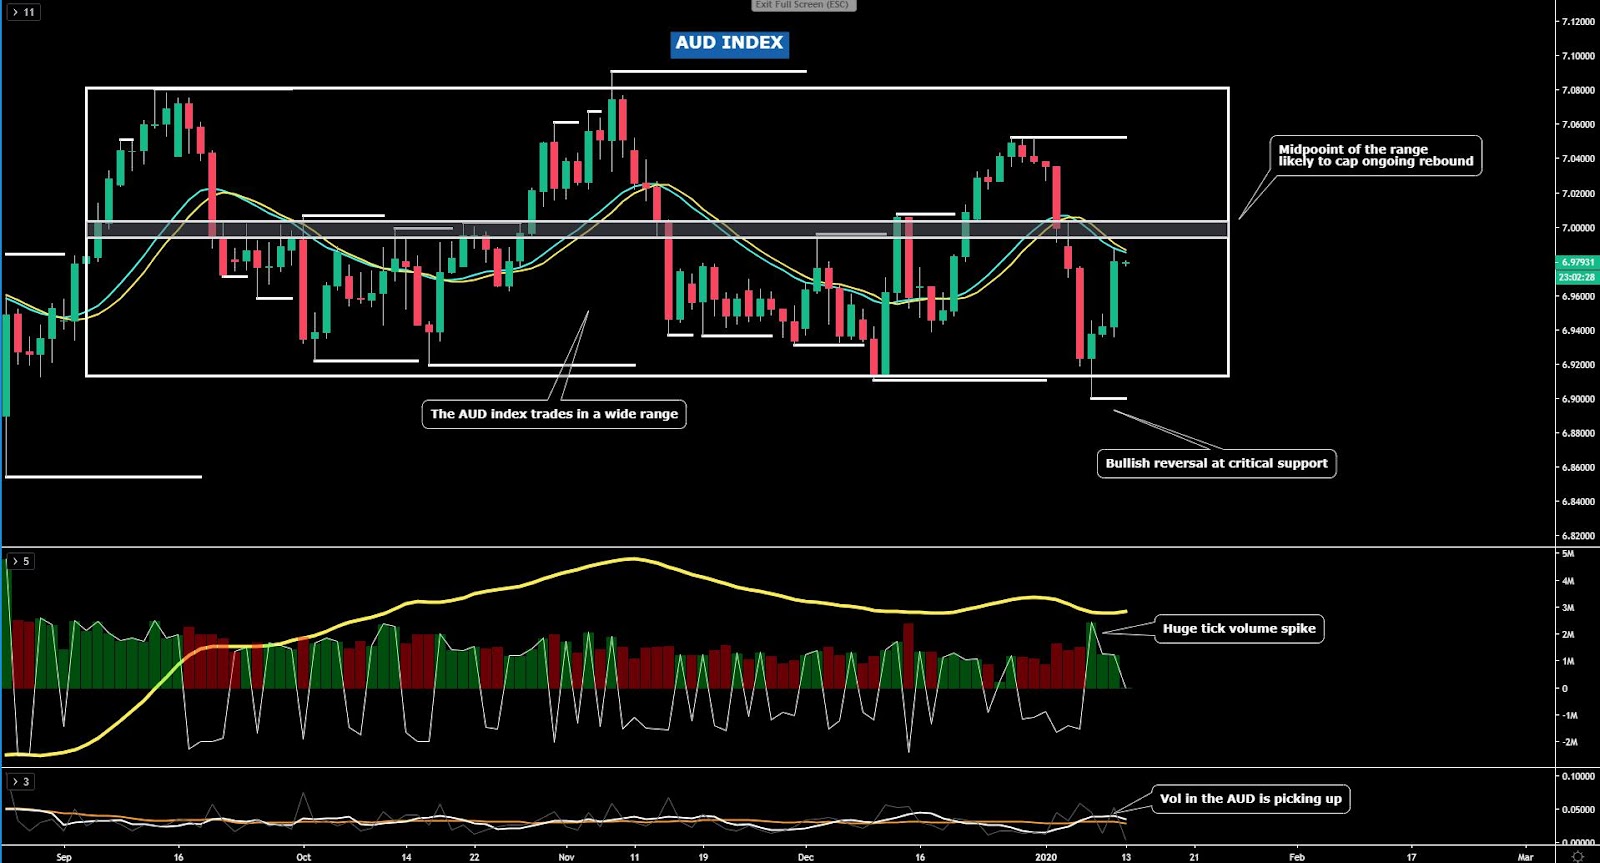
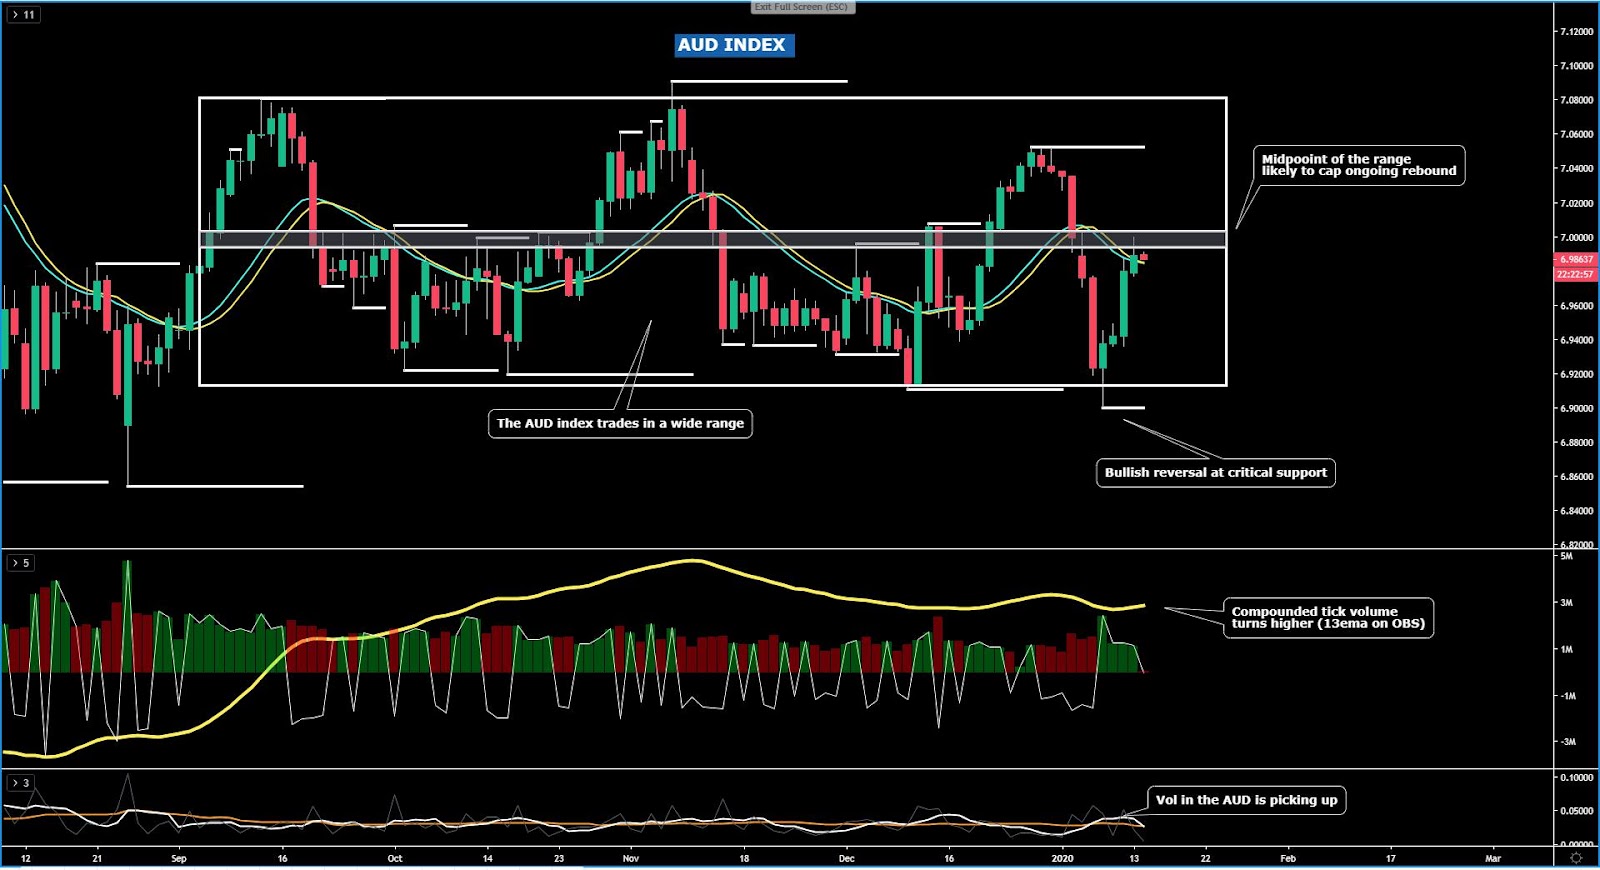
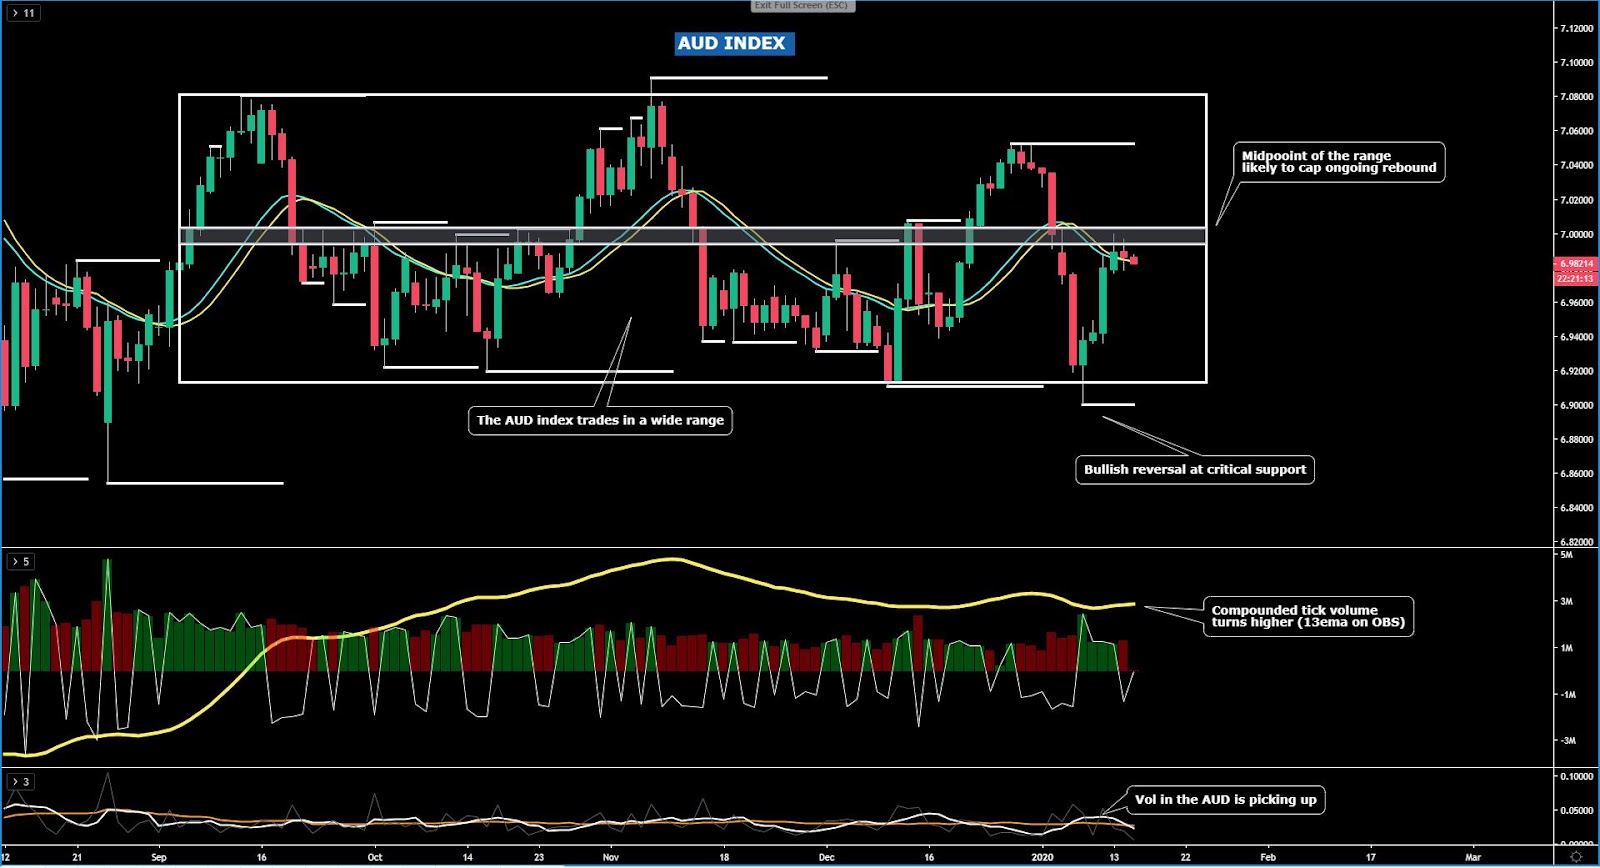
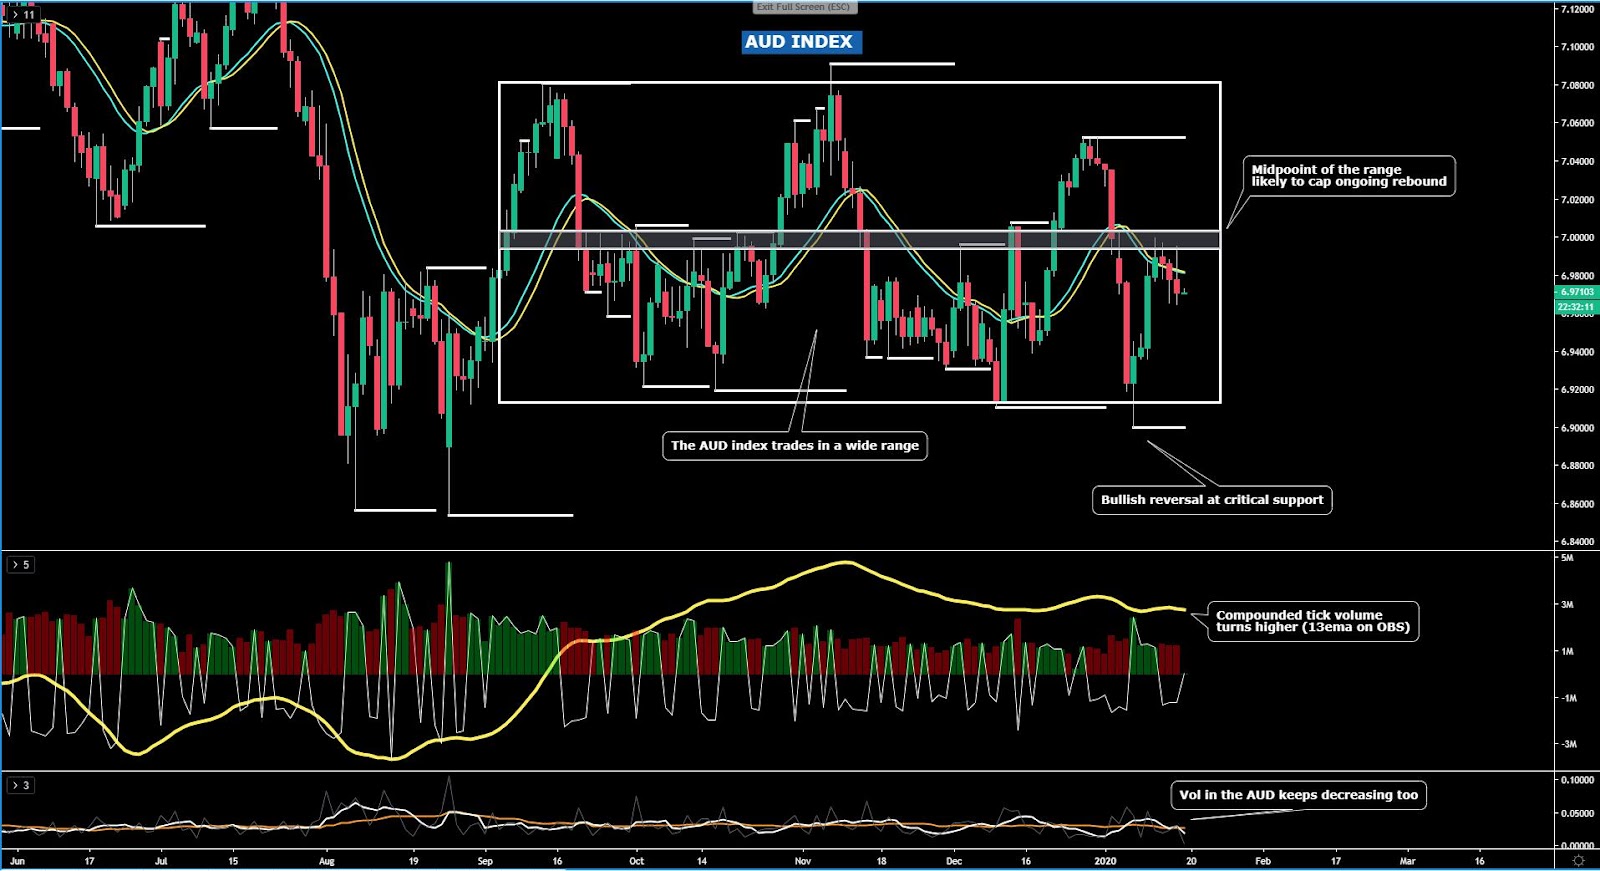
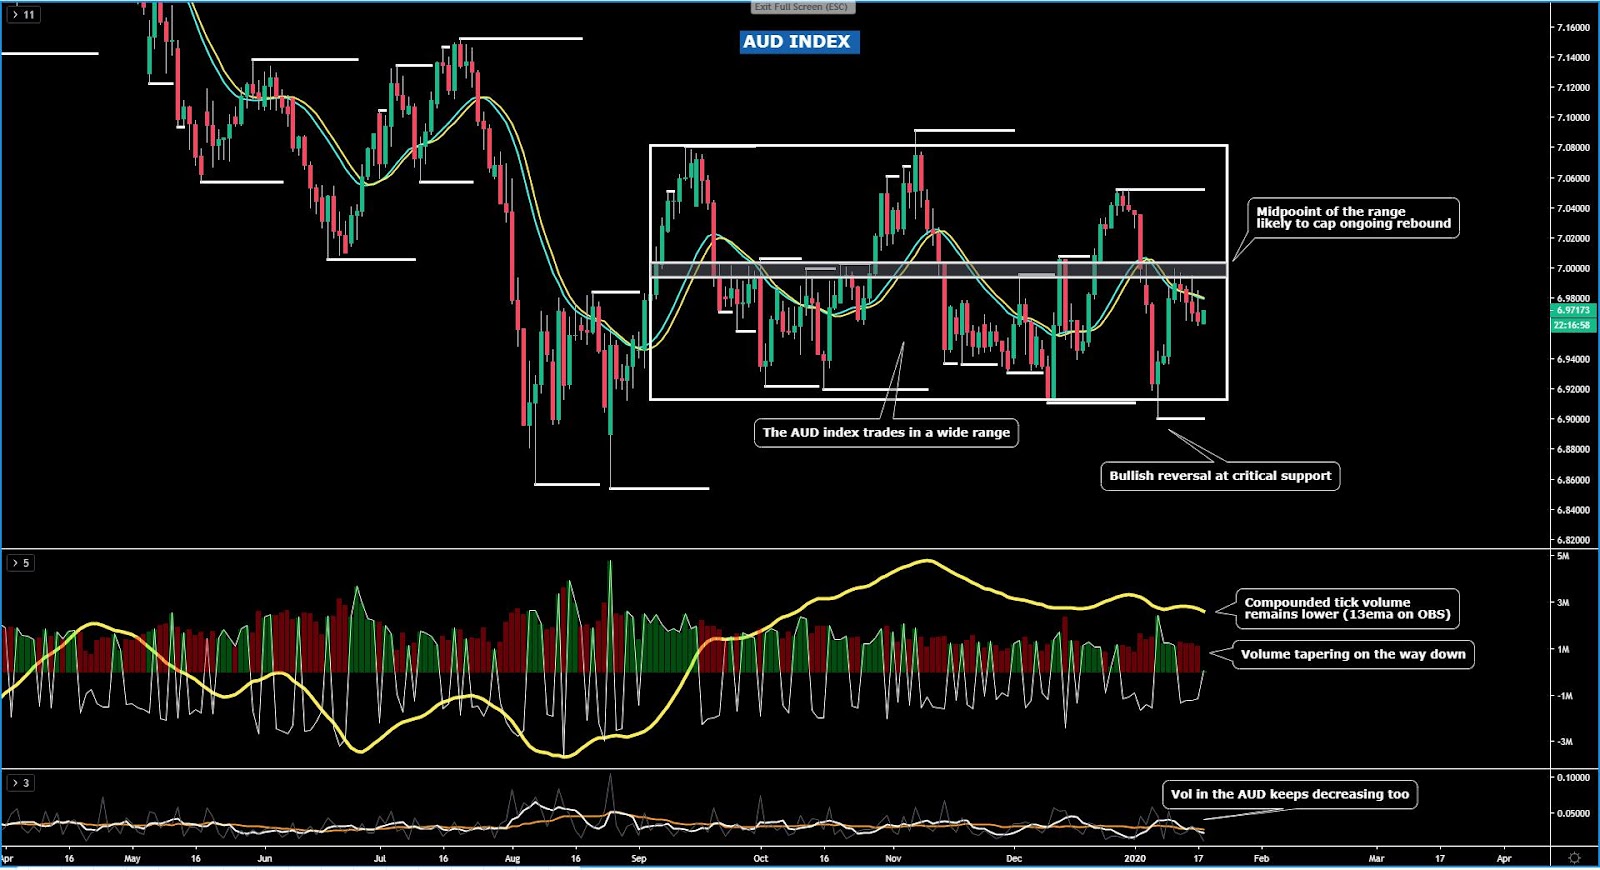
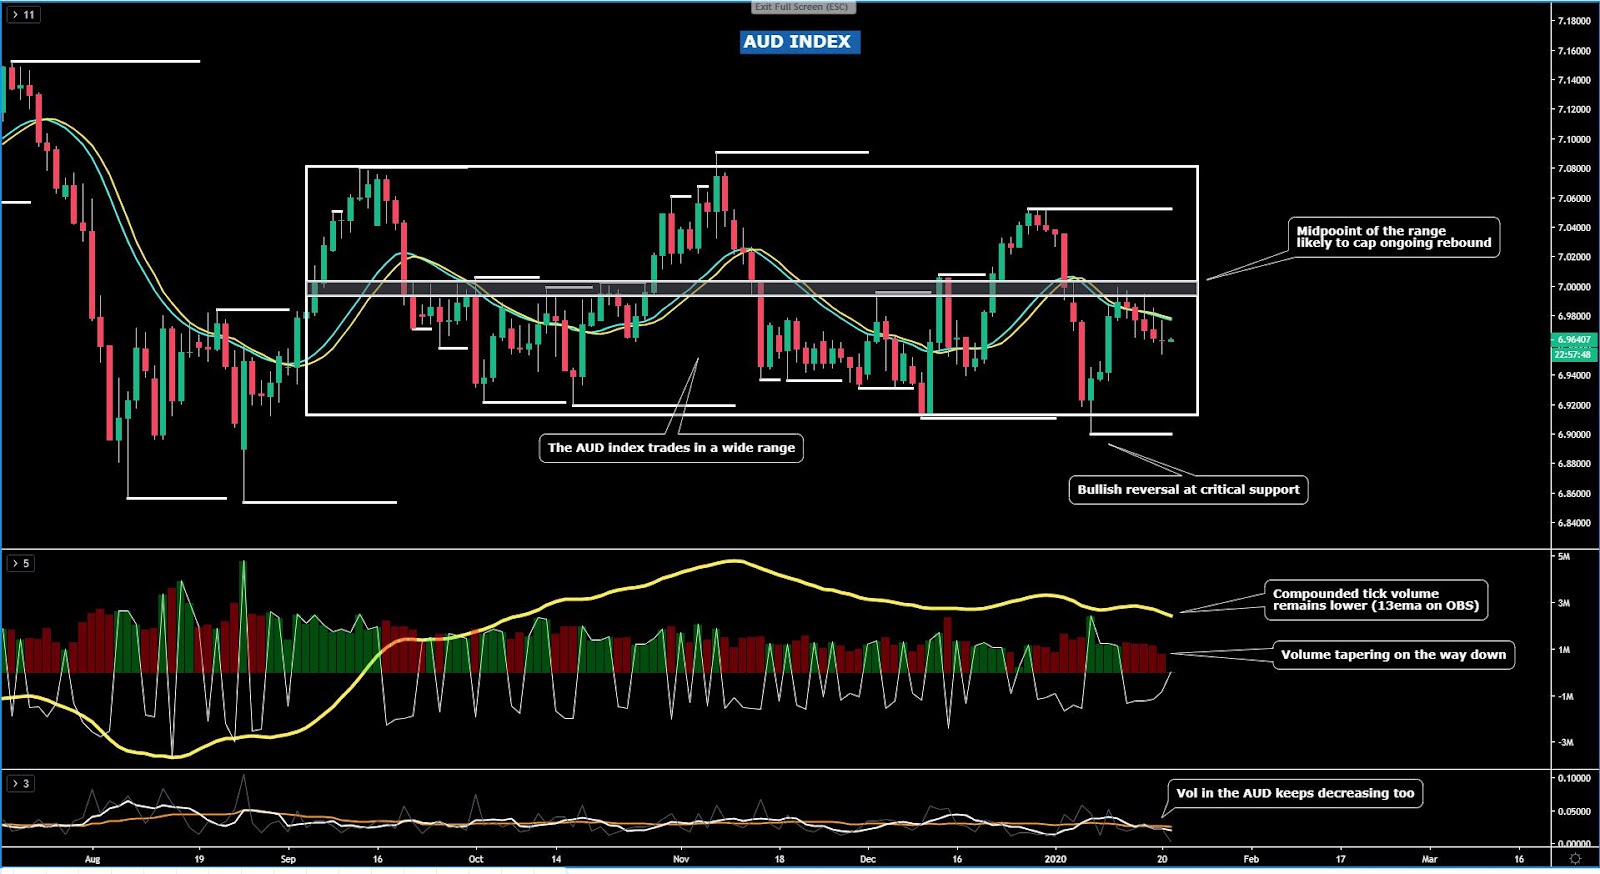
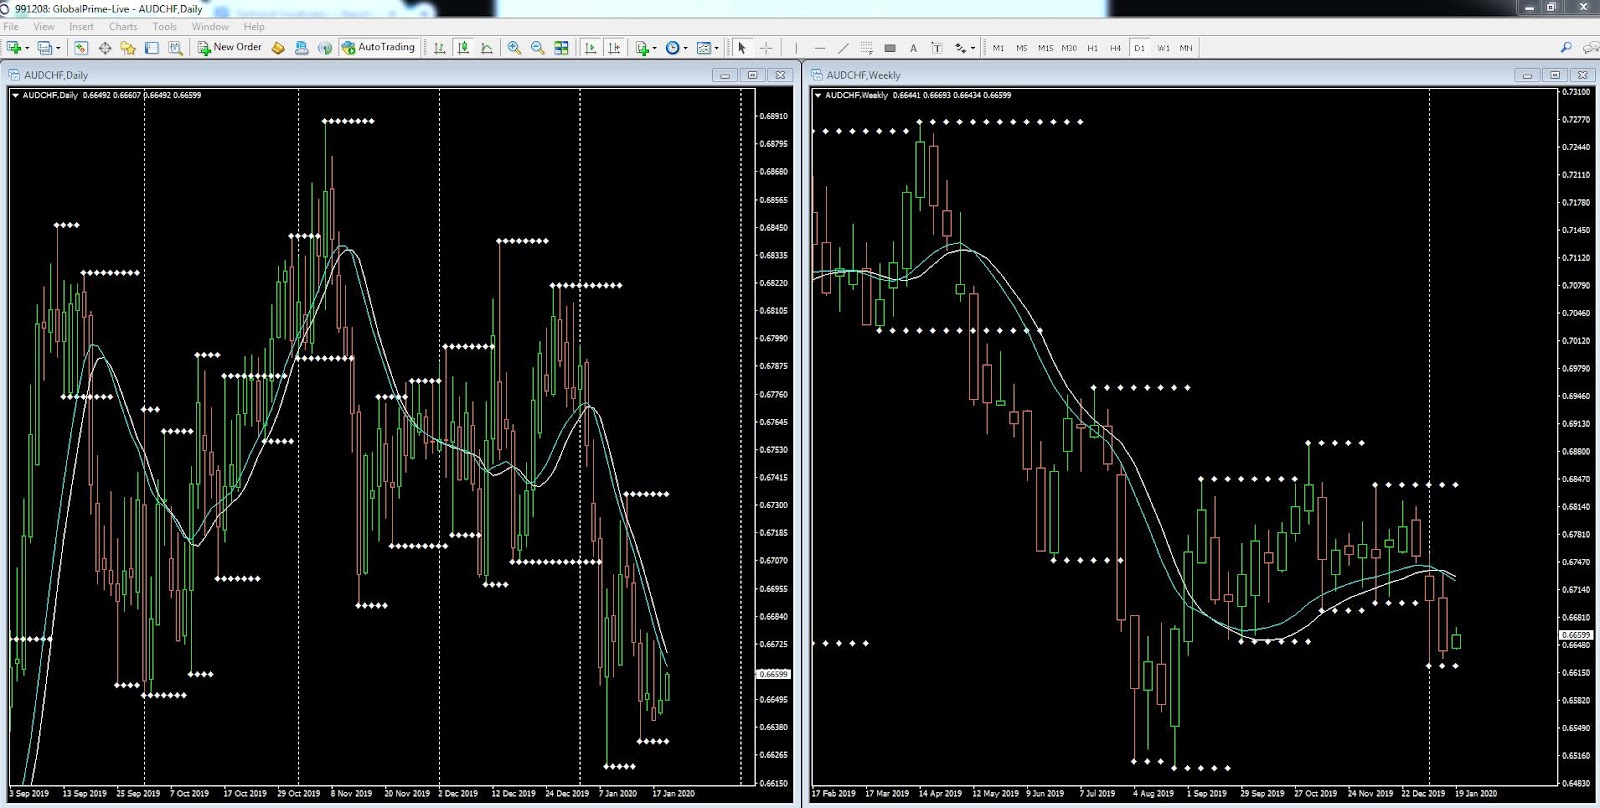
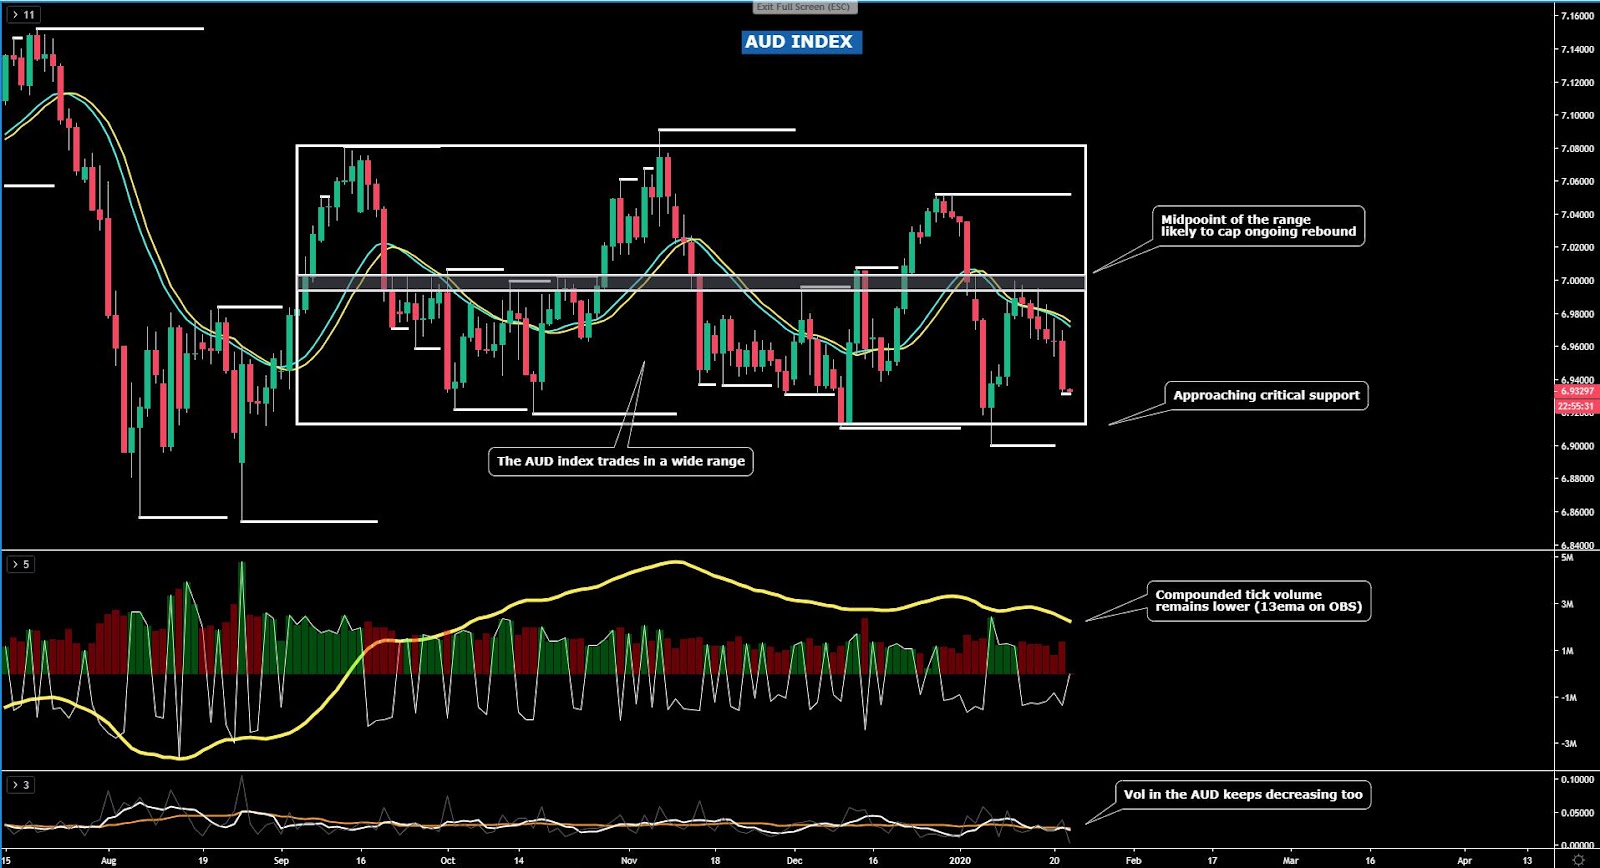
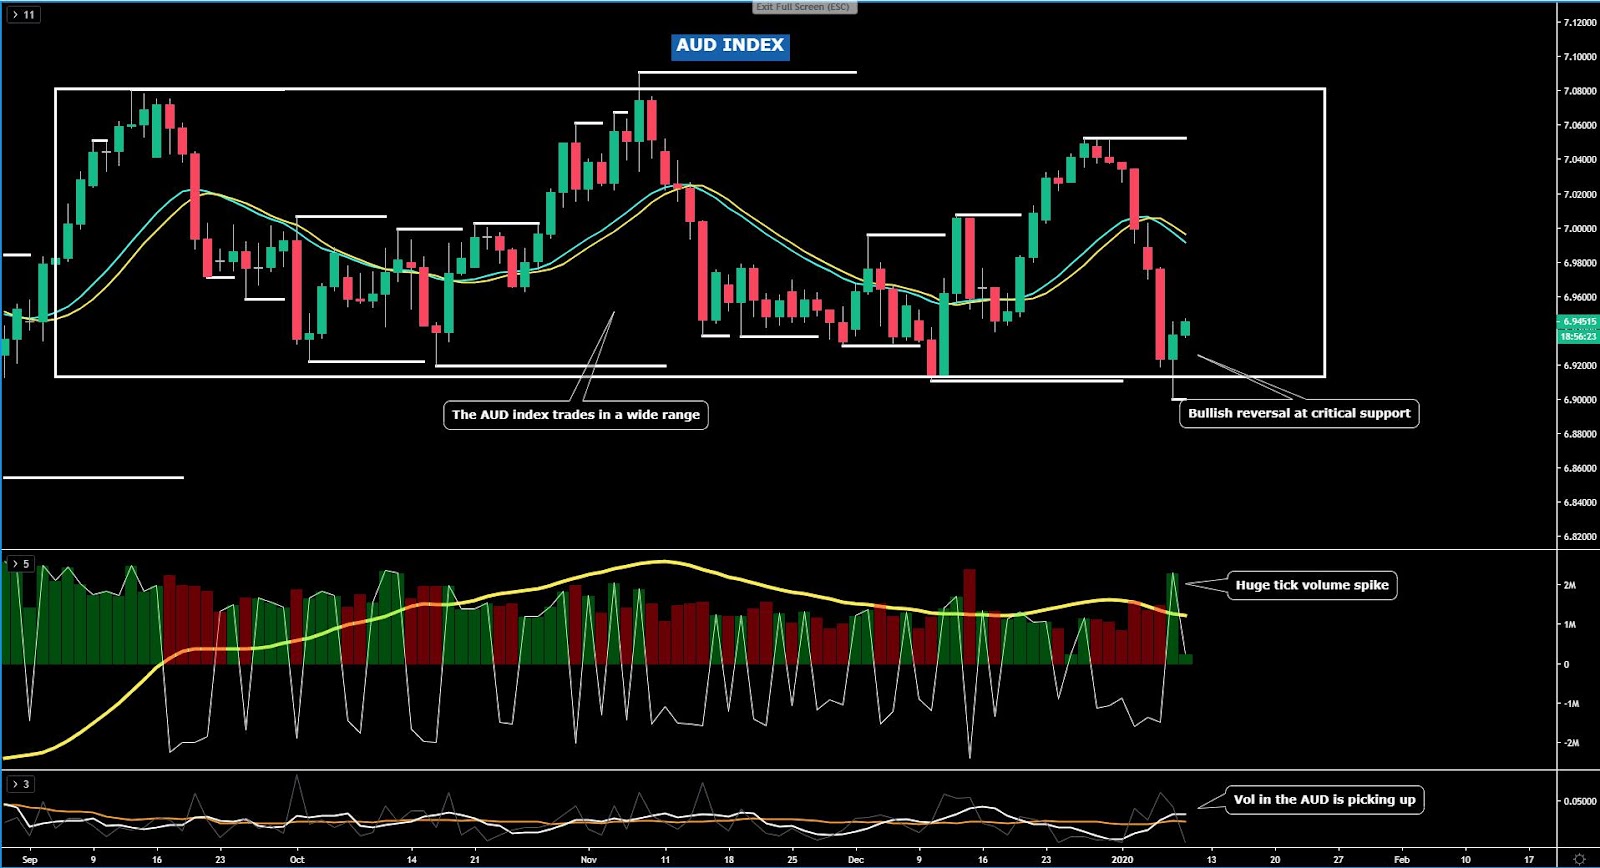
The AUD index offers a very enticing risk-reward to turn bullish from these lows. There is a case for the Aussie to build some legs from this critical level of support as it’s proven to be the most important base being respected since its first test back in early Oct last year. While the smart money flows are negative, be reminded that we are in the context of a wide range in the index (drawn in a white rectangle). The bullish pin bar off this key support carries the type of tick volume I’d personally like to see to cement this view about a tentative shift in flows. Besides the forex seasonal pattern is positive to the tune of +0.54% in Jan since the early 1980s.
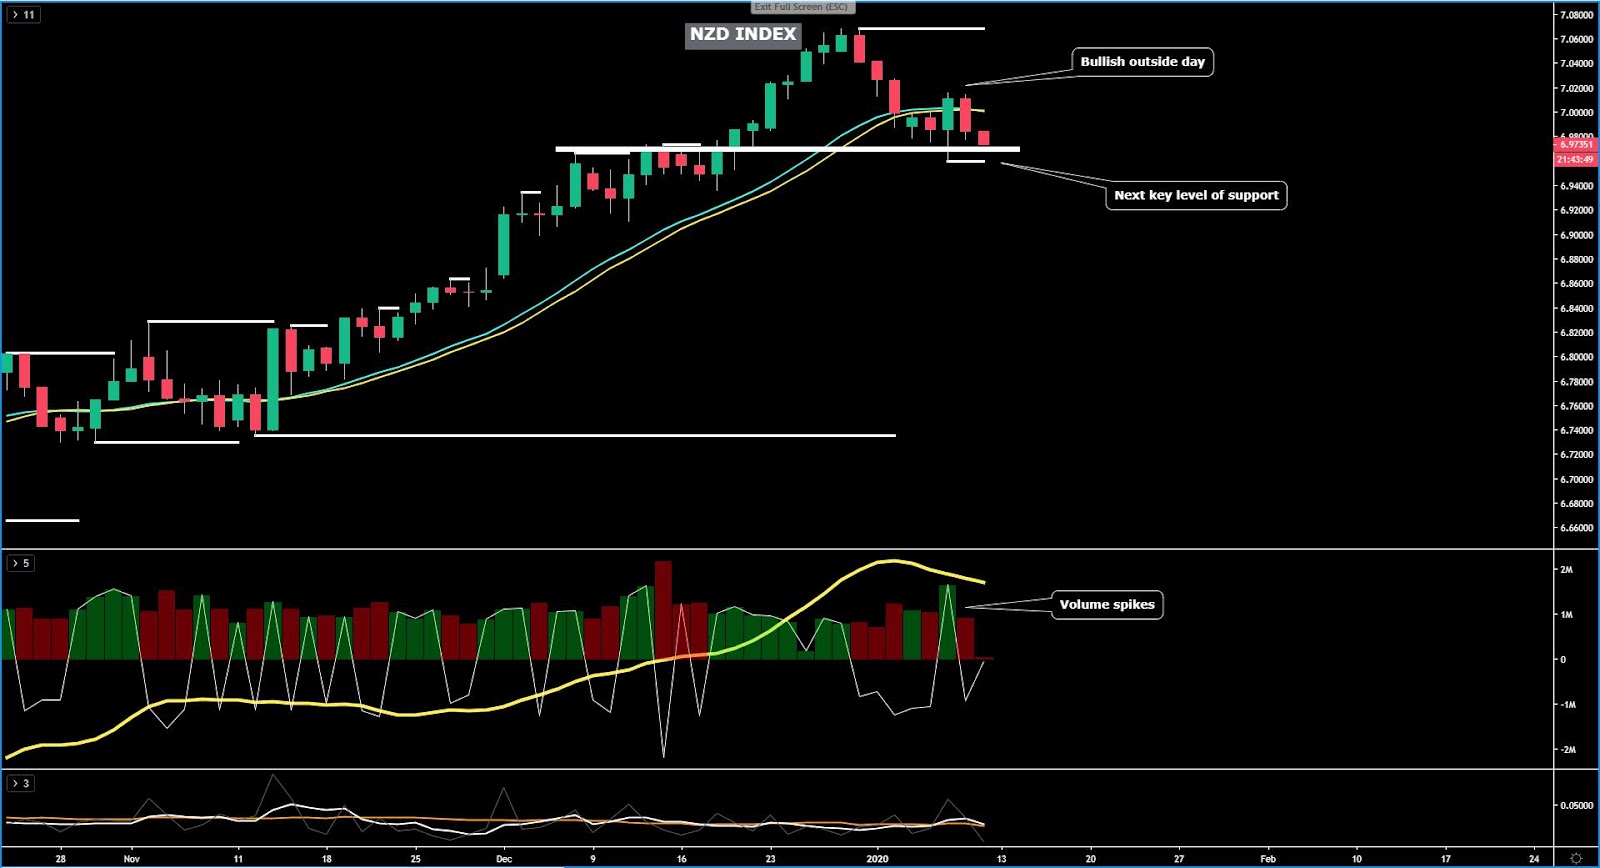
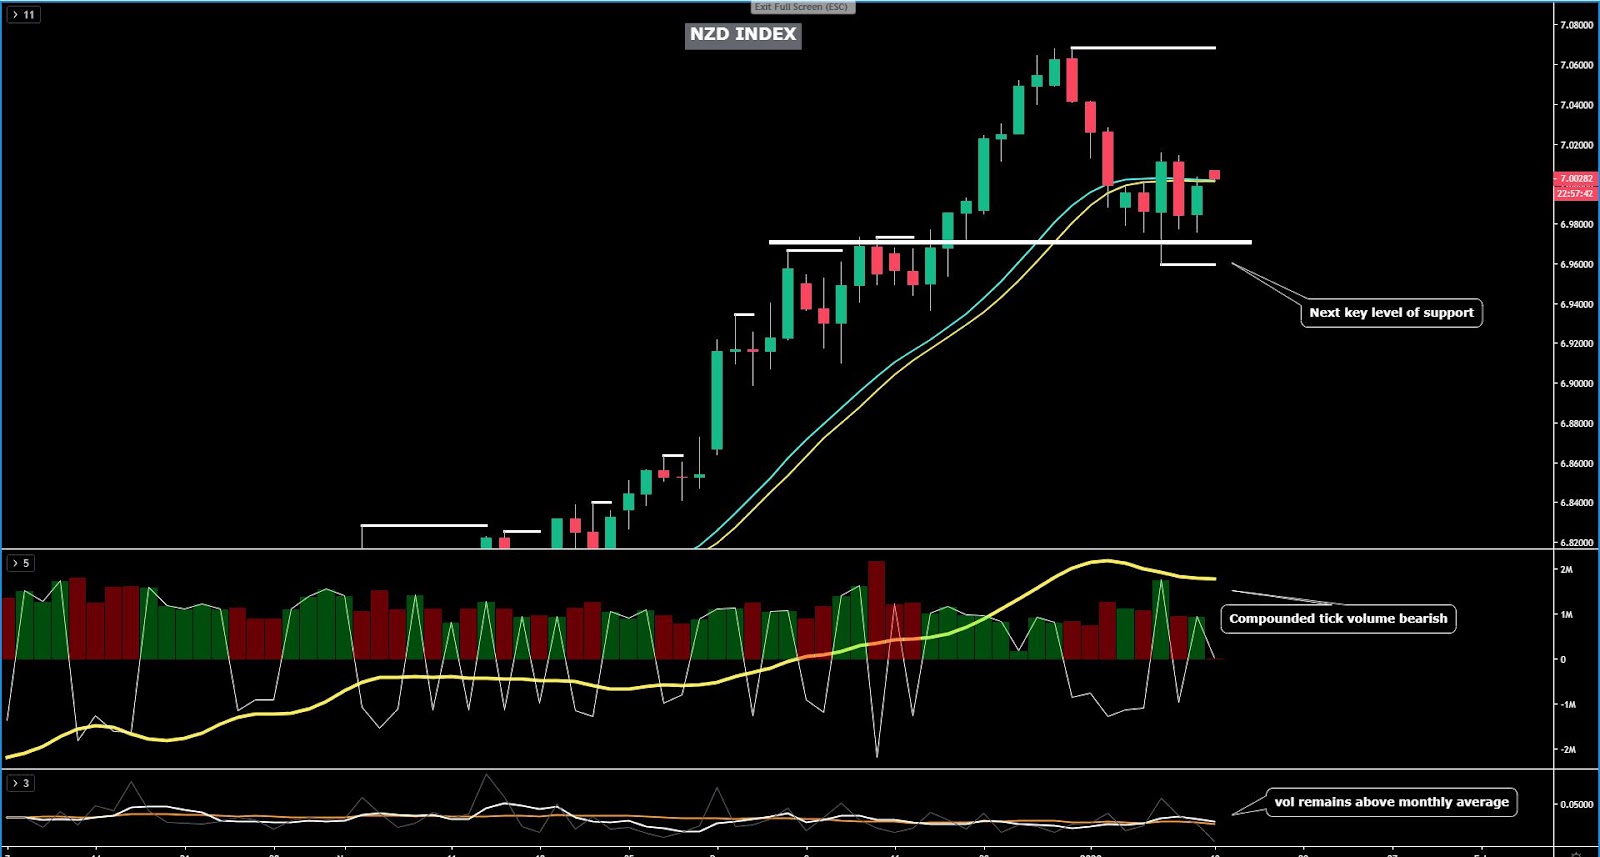
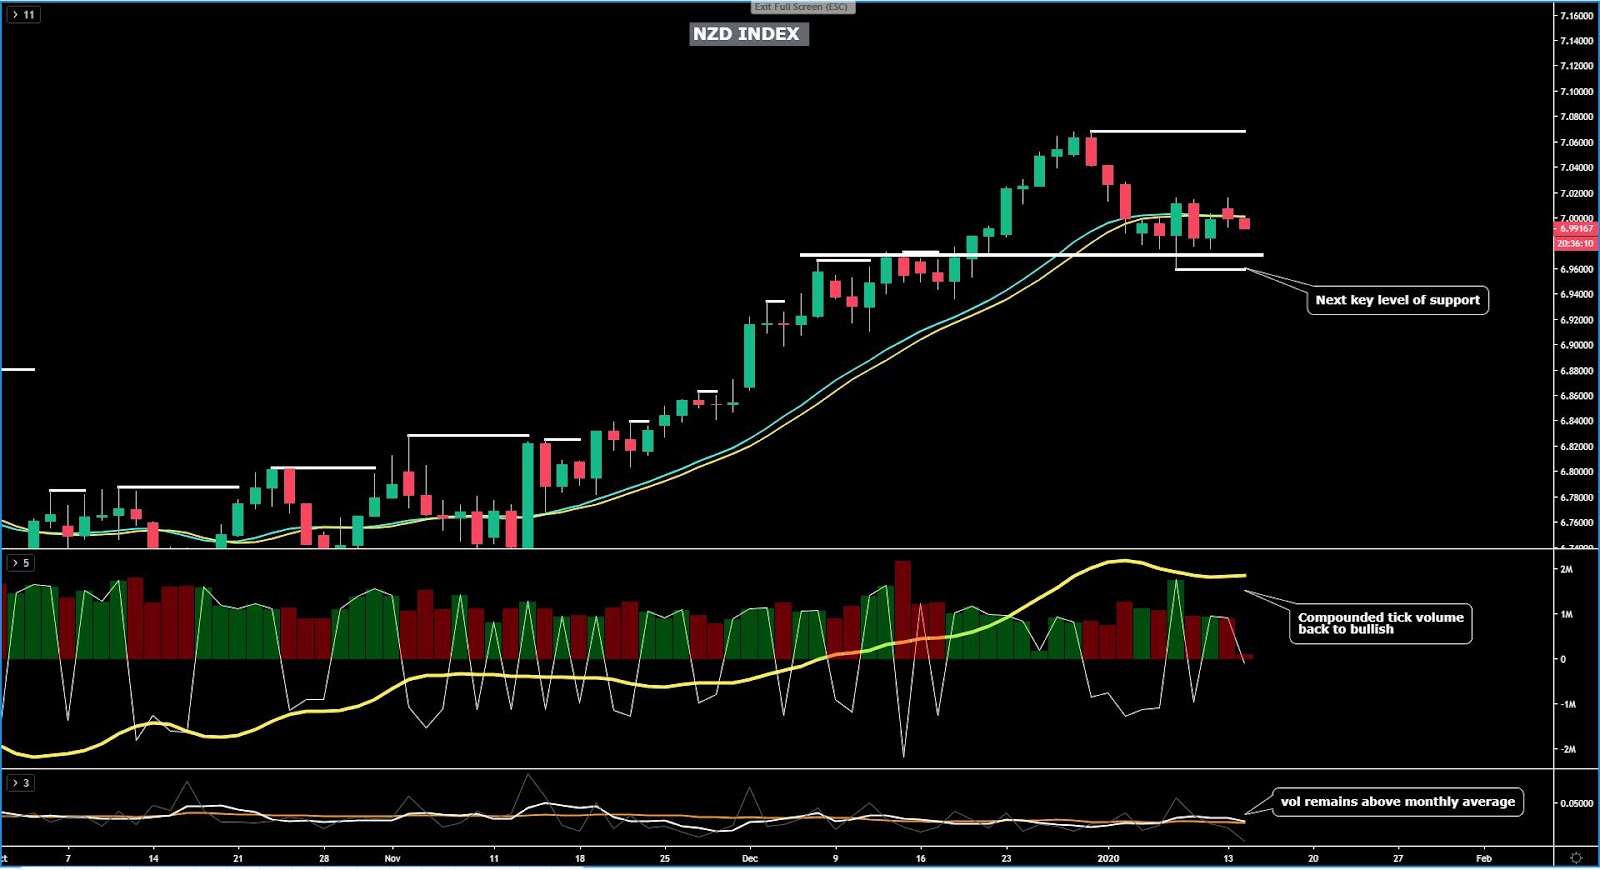
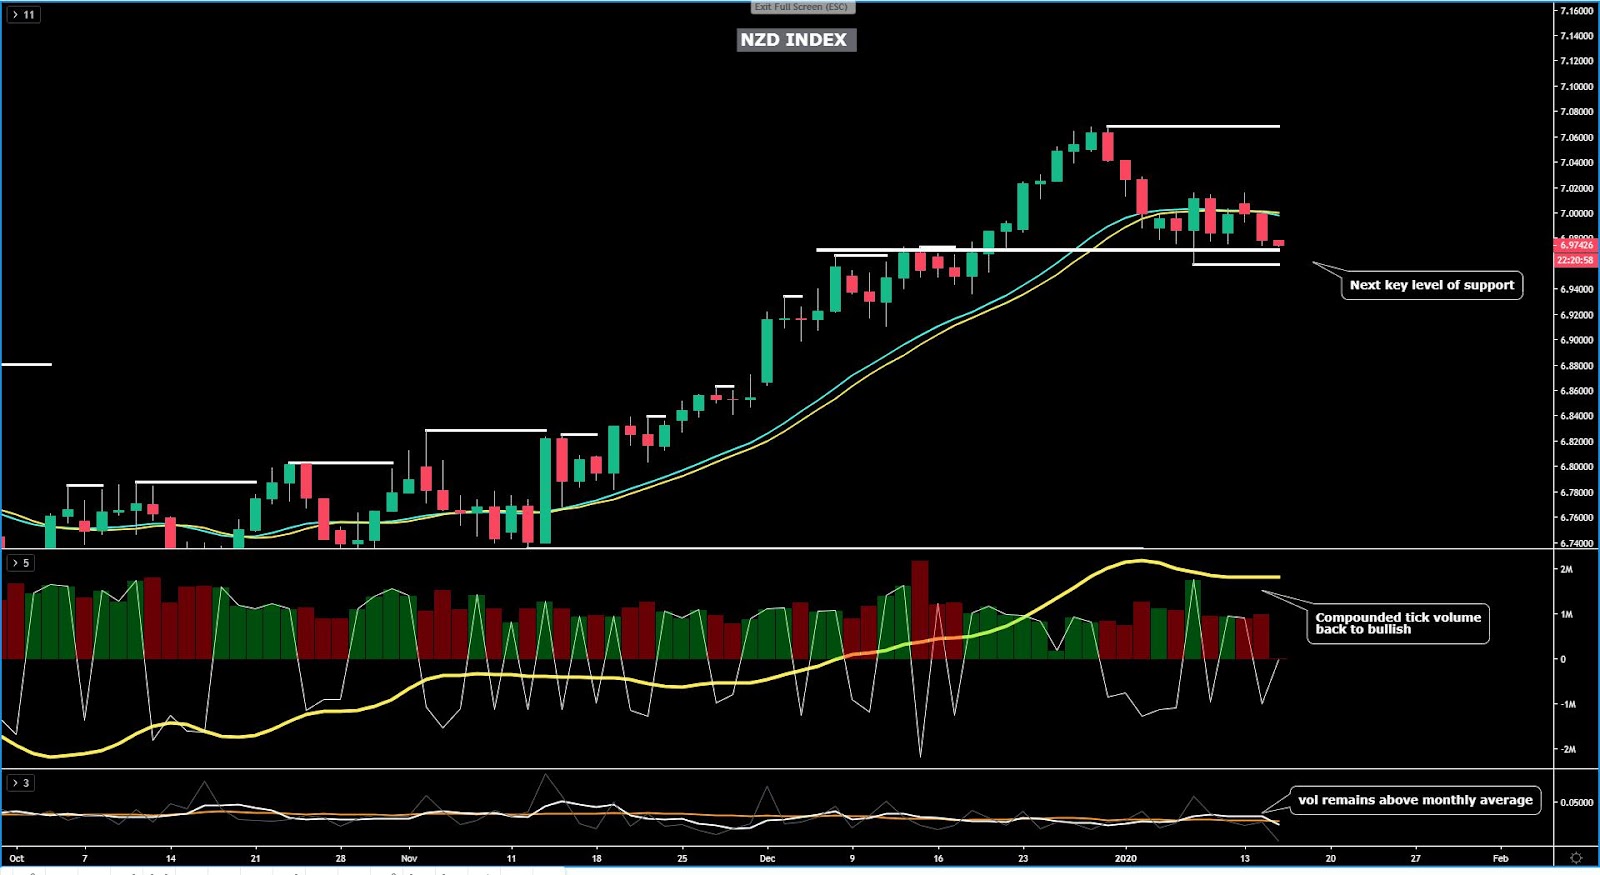
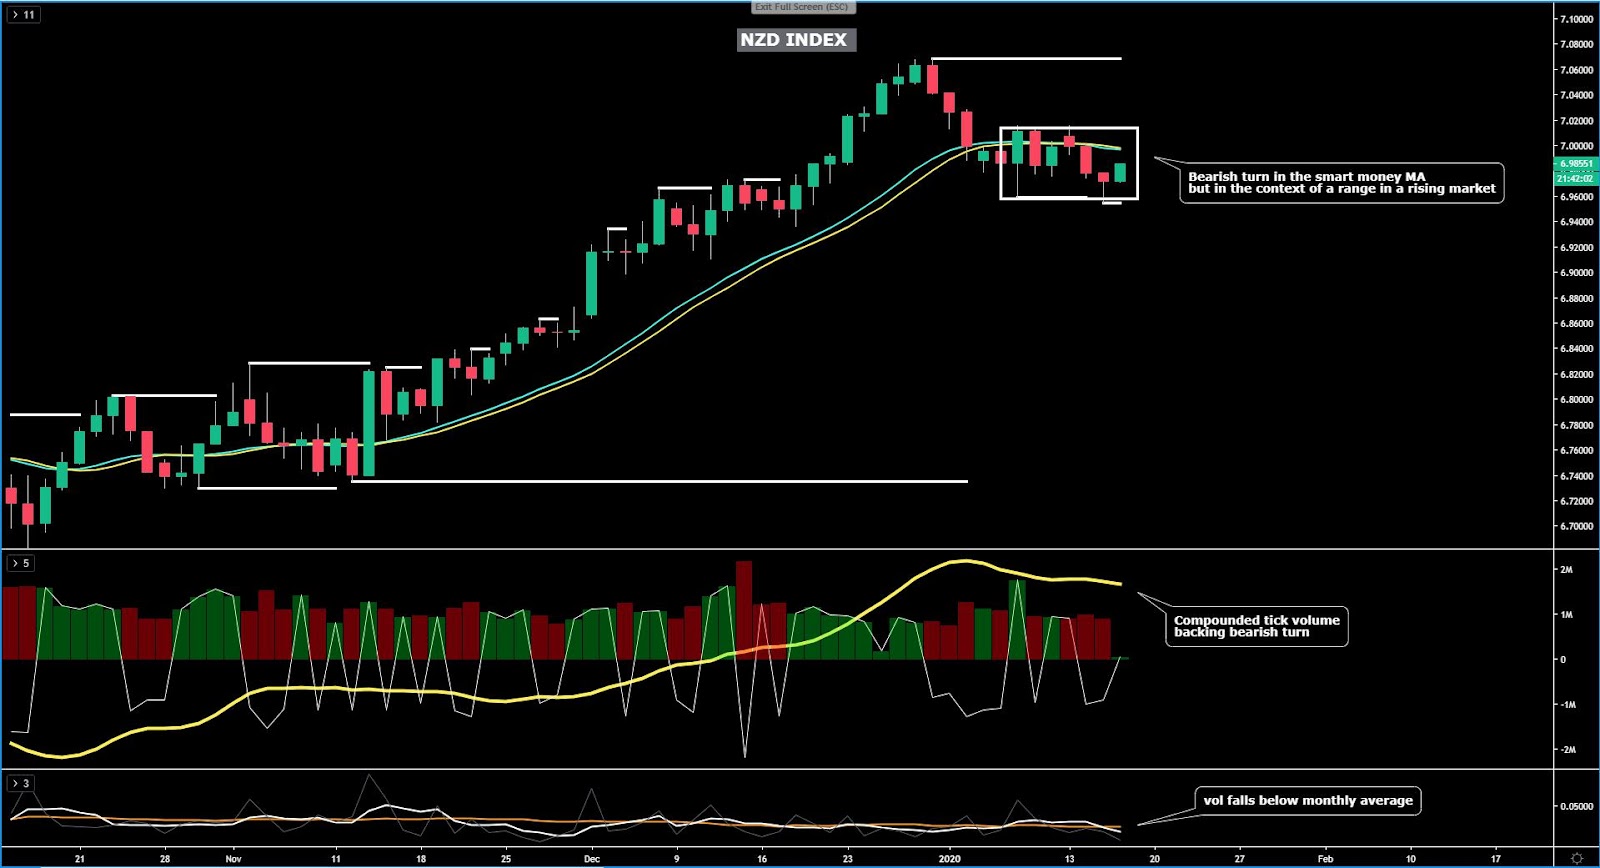
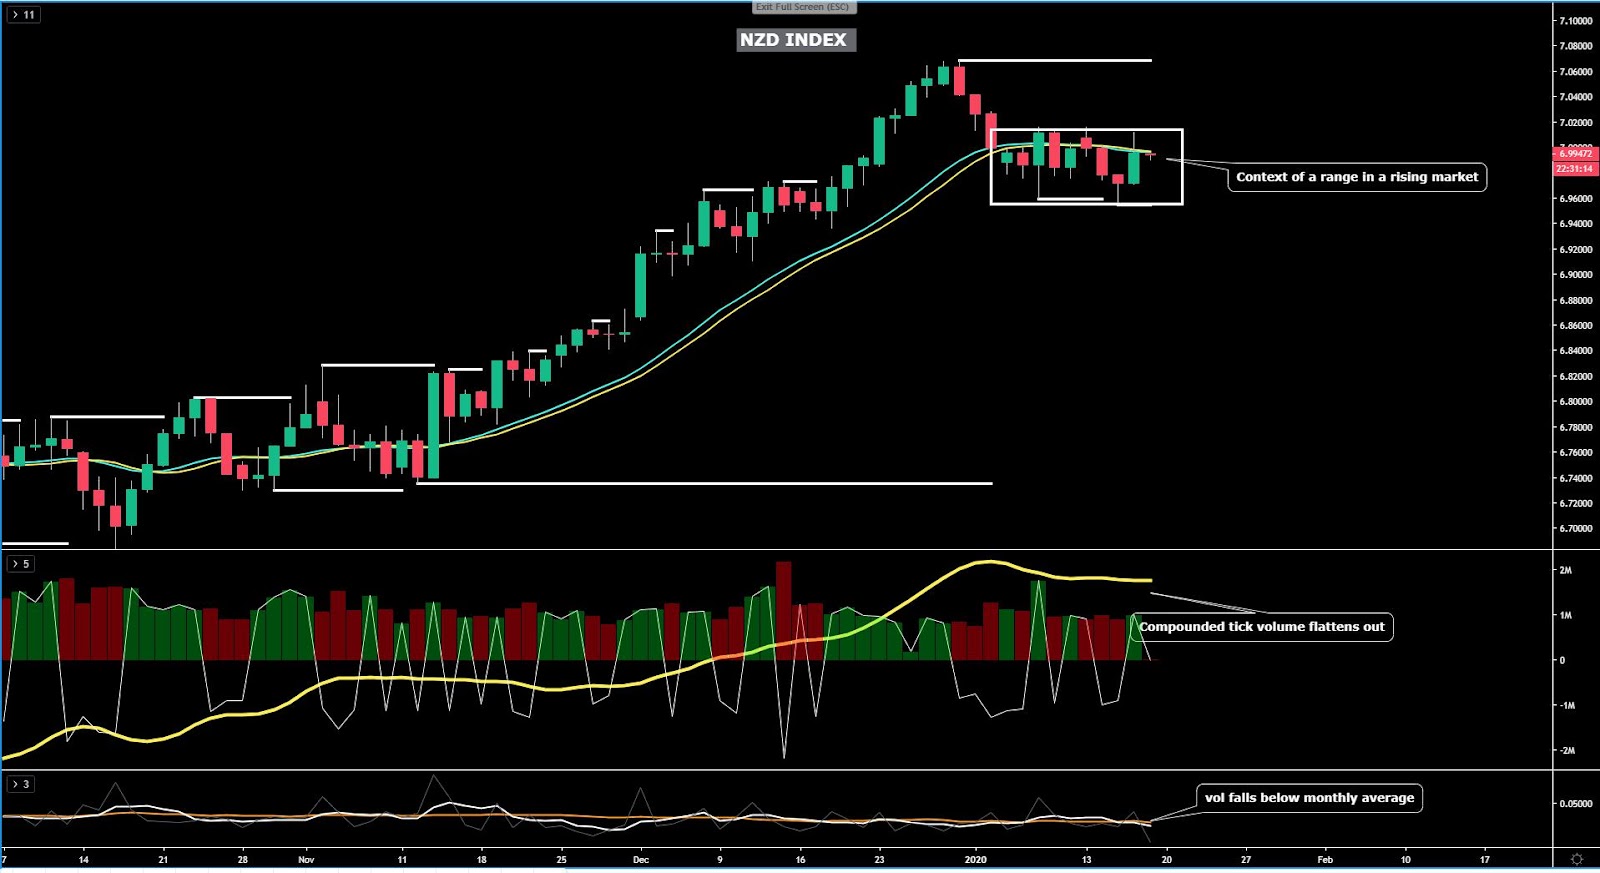
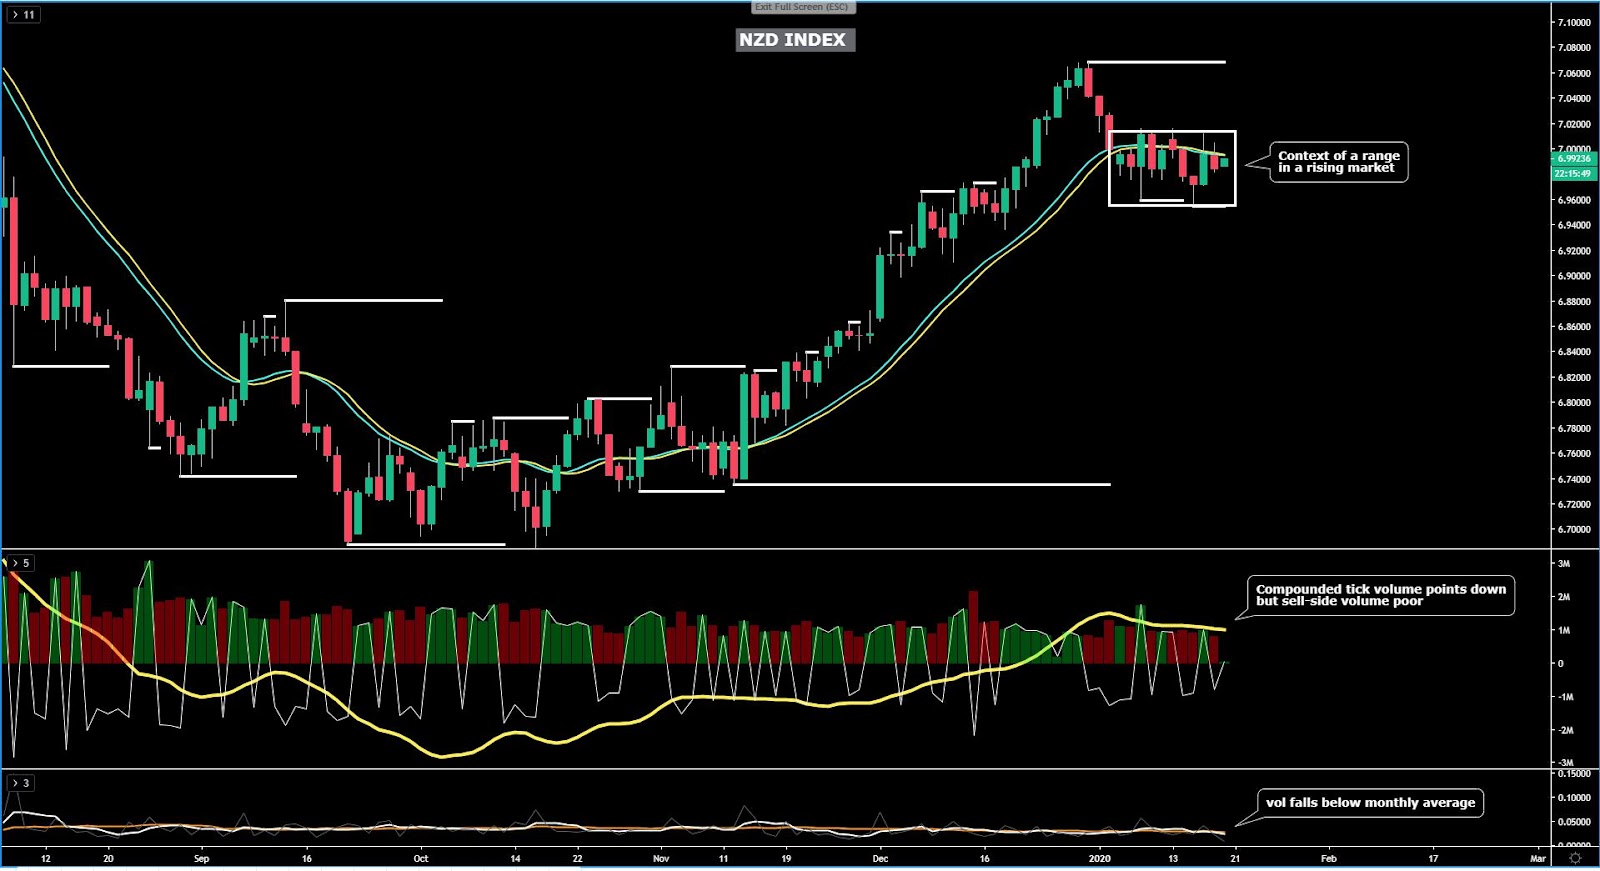
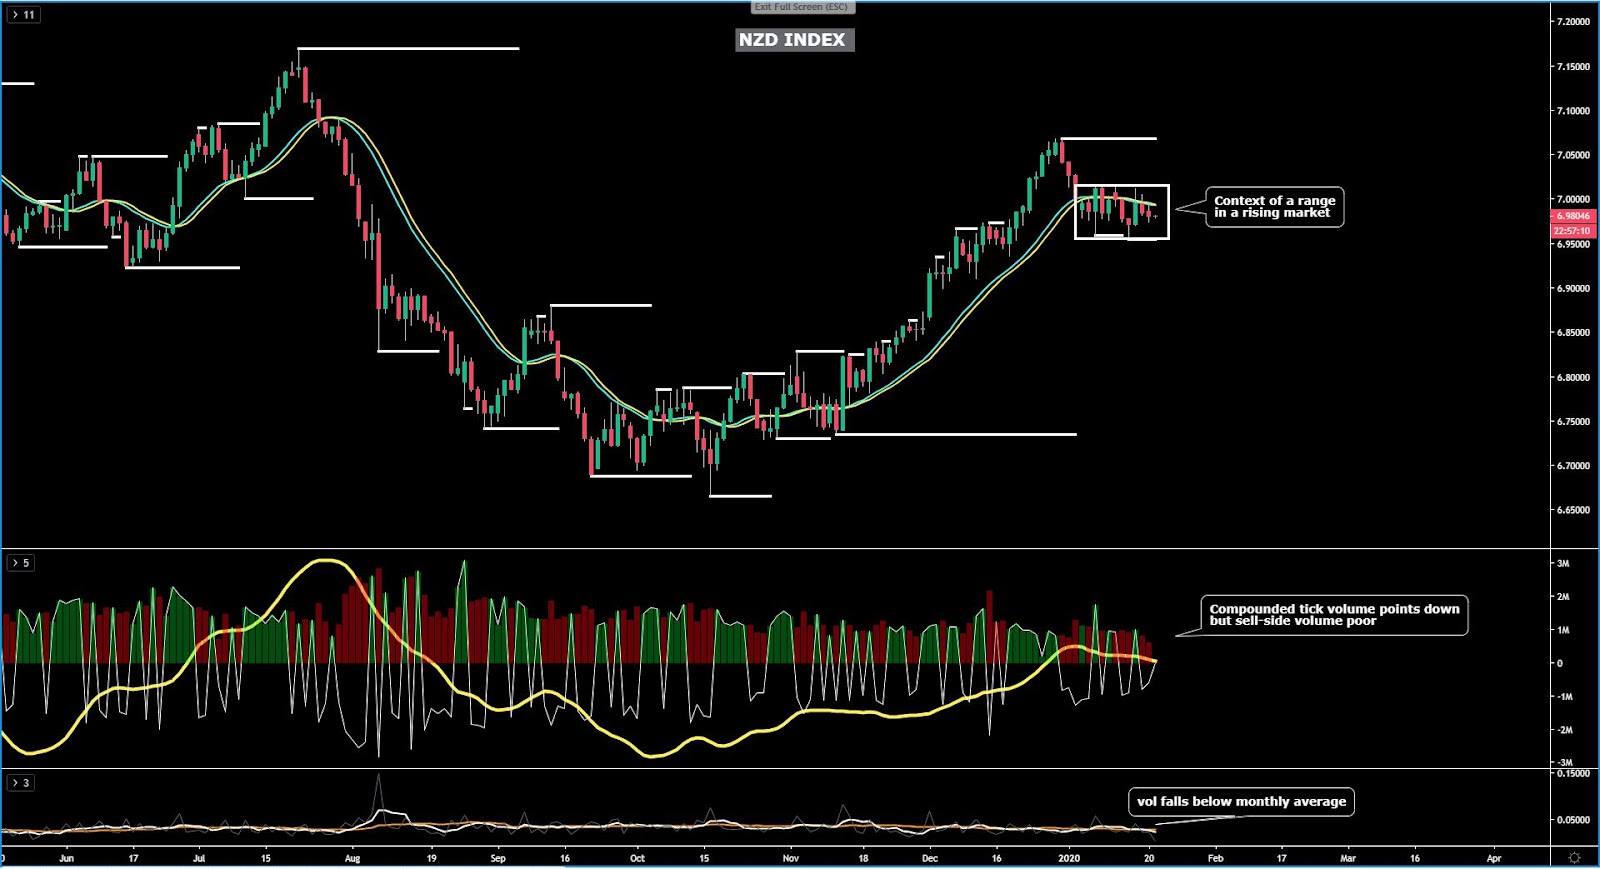
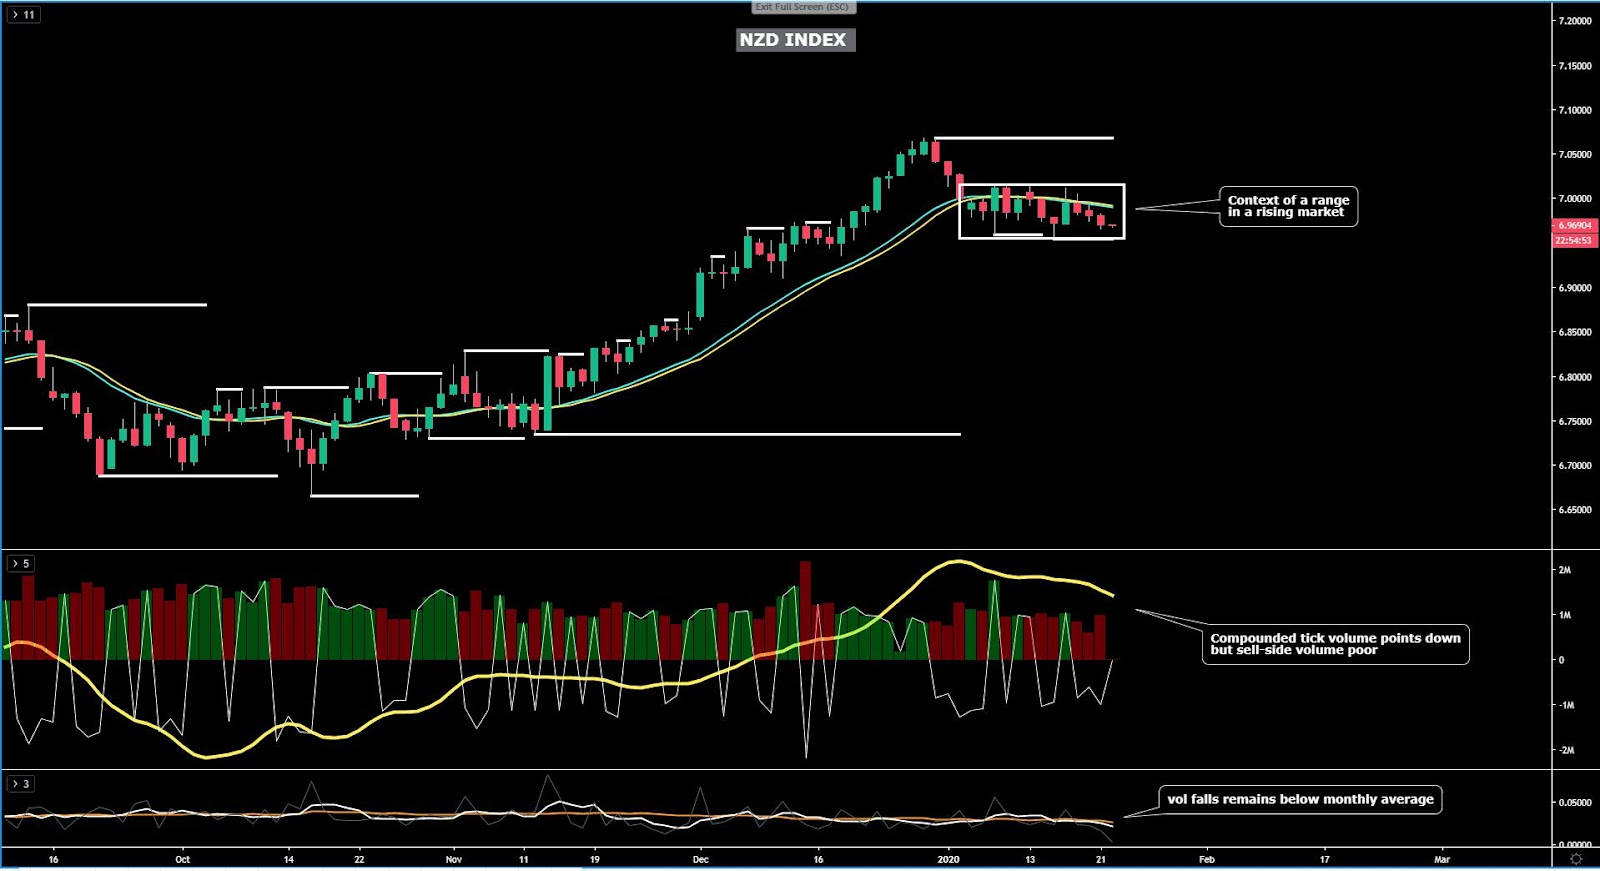
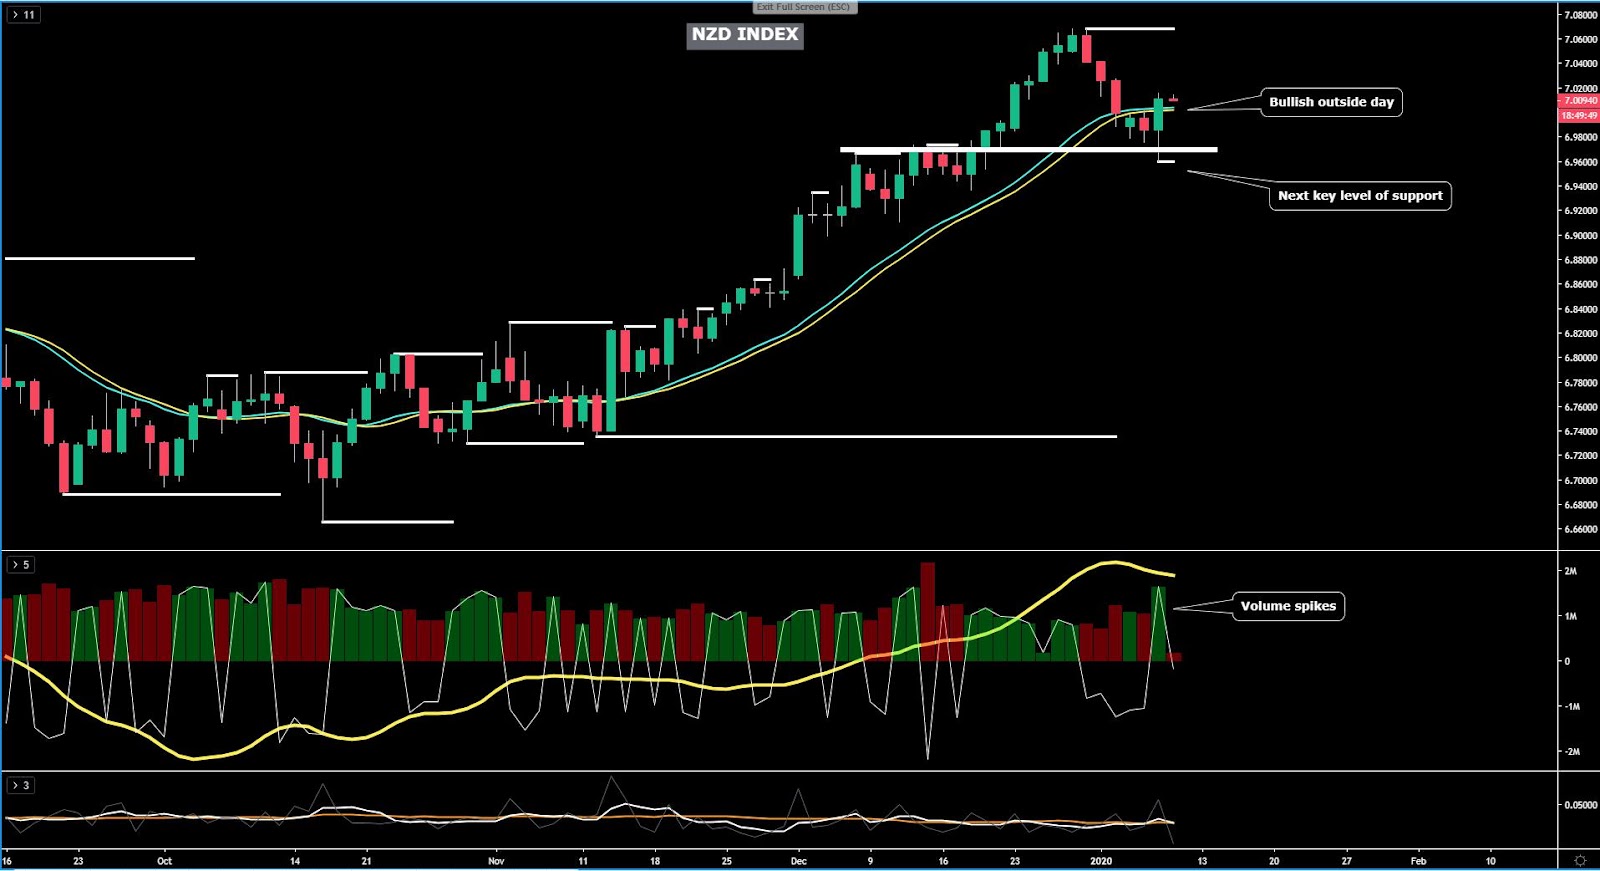
The NZD index has printed a commanding bullish outside day that implies the risk for higher levels, with my view being that a squeeze to its most recent trend high may be in the making. The price structure is supportive, as is the enhanced moving average tracing the dominant flows, with the tick volume also backing this bullish view. As the technicals stand, and with no fundamentals in NZ to distort the trend, playing against this currency is not a good move imo.
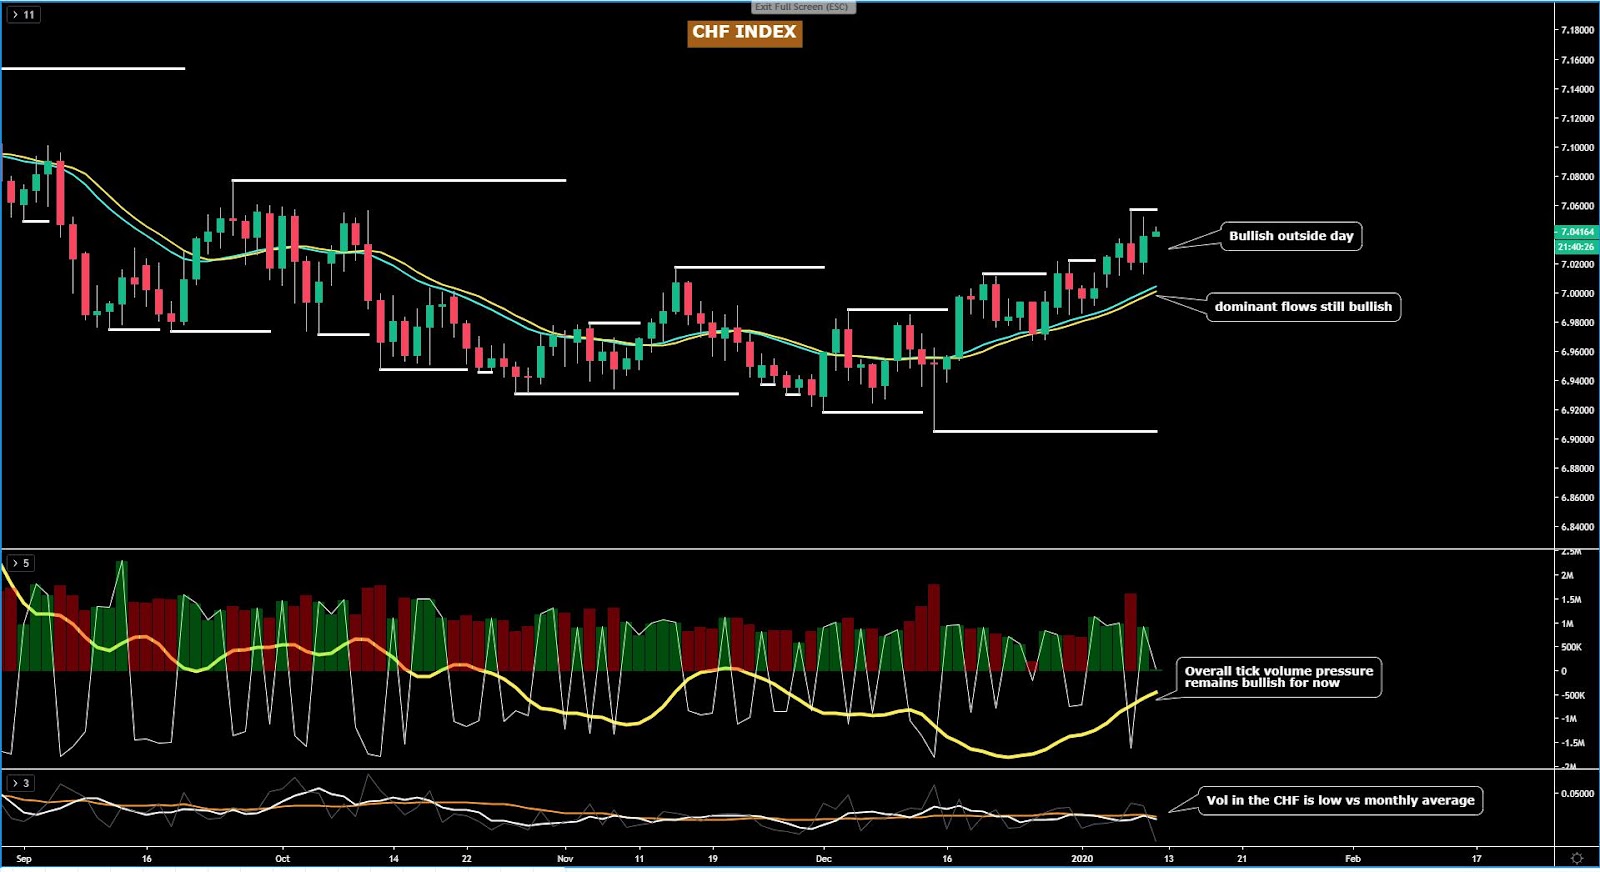
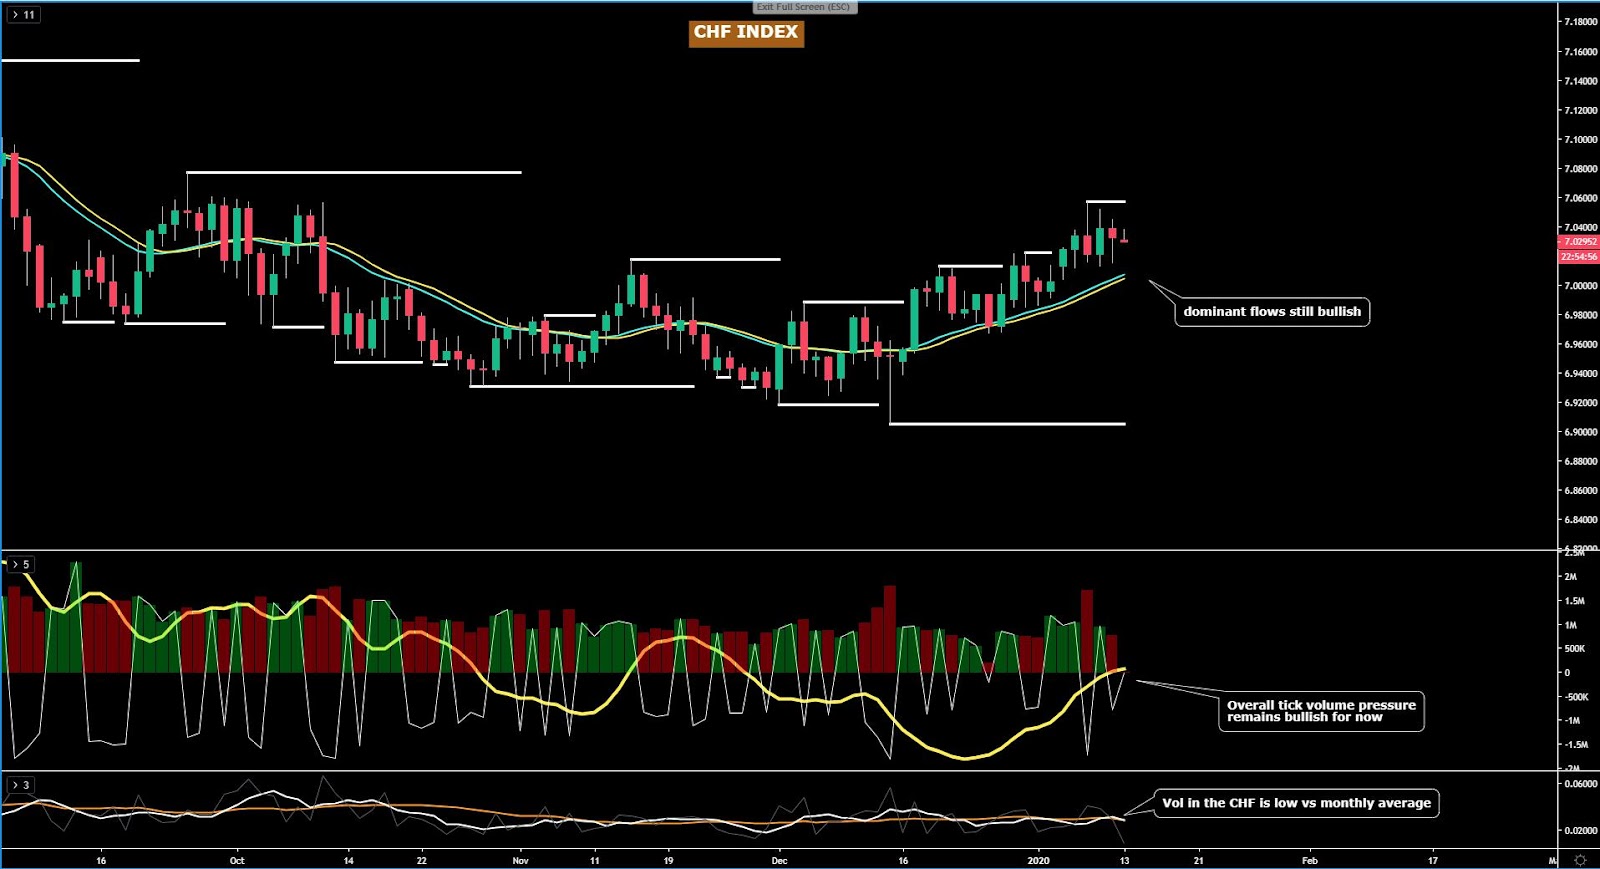
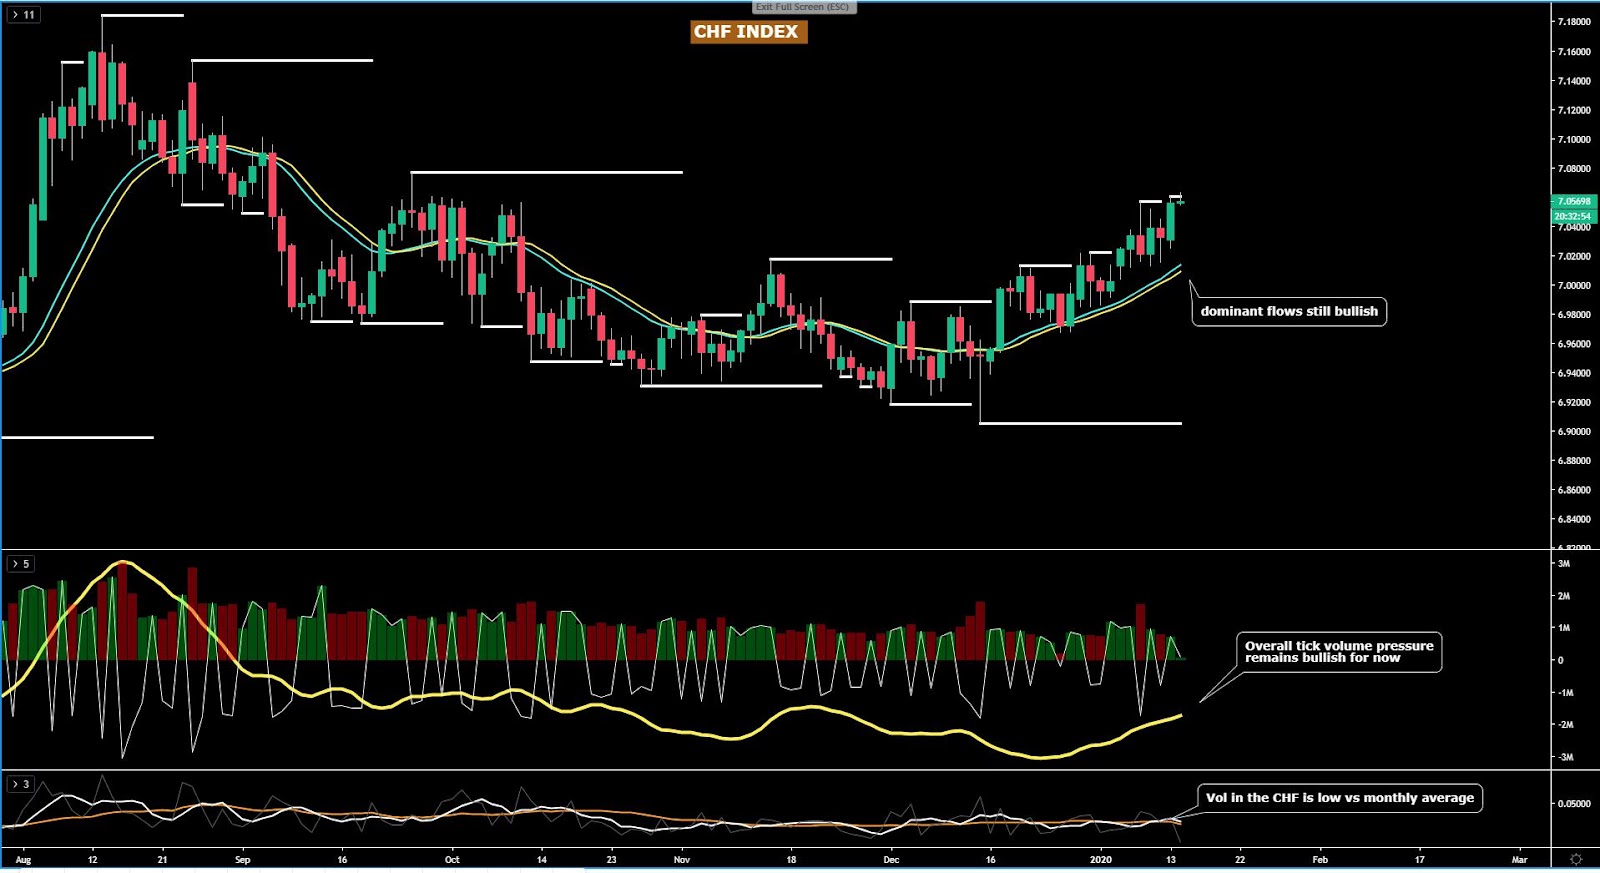
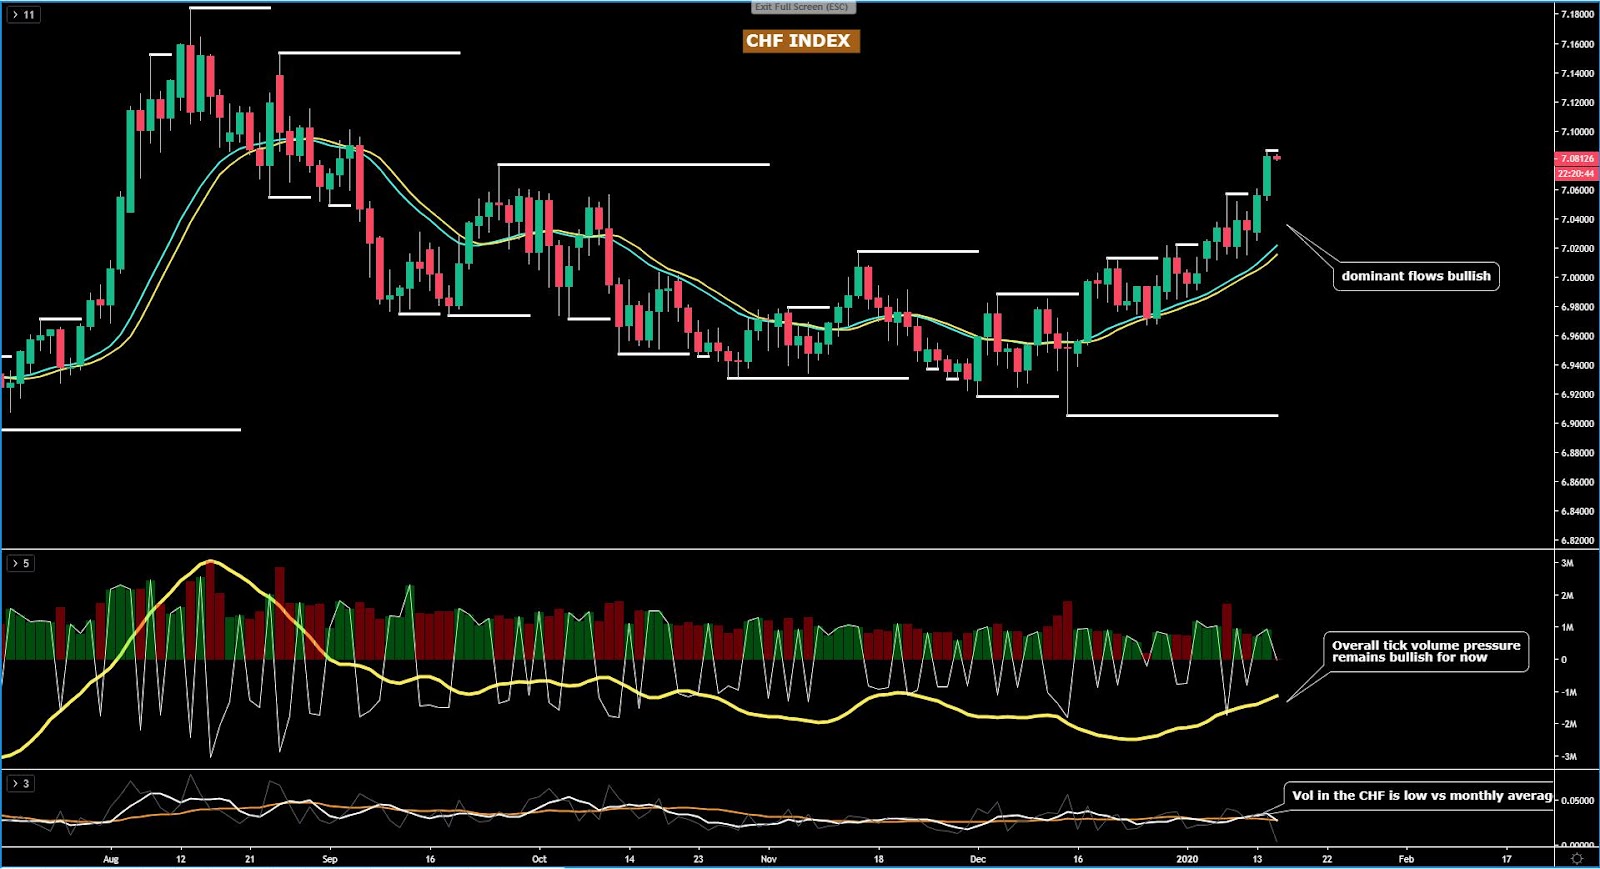
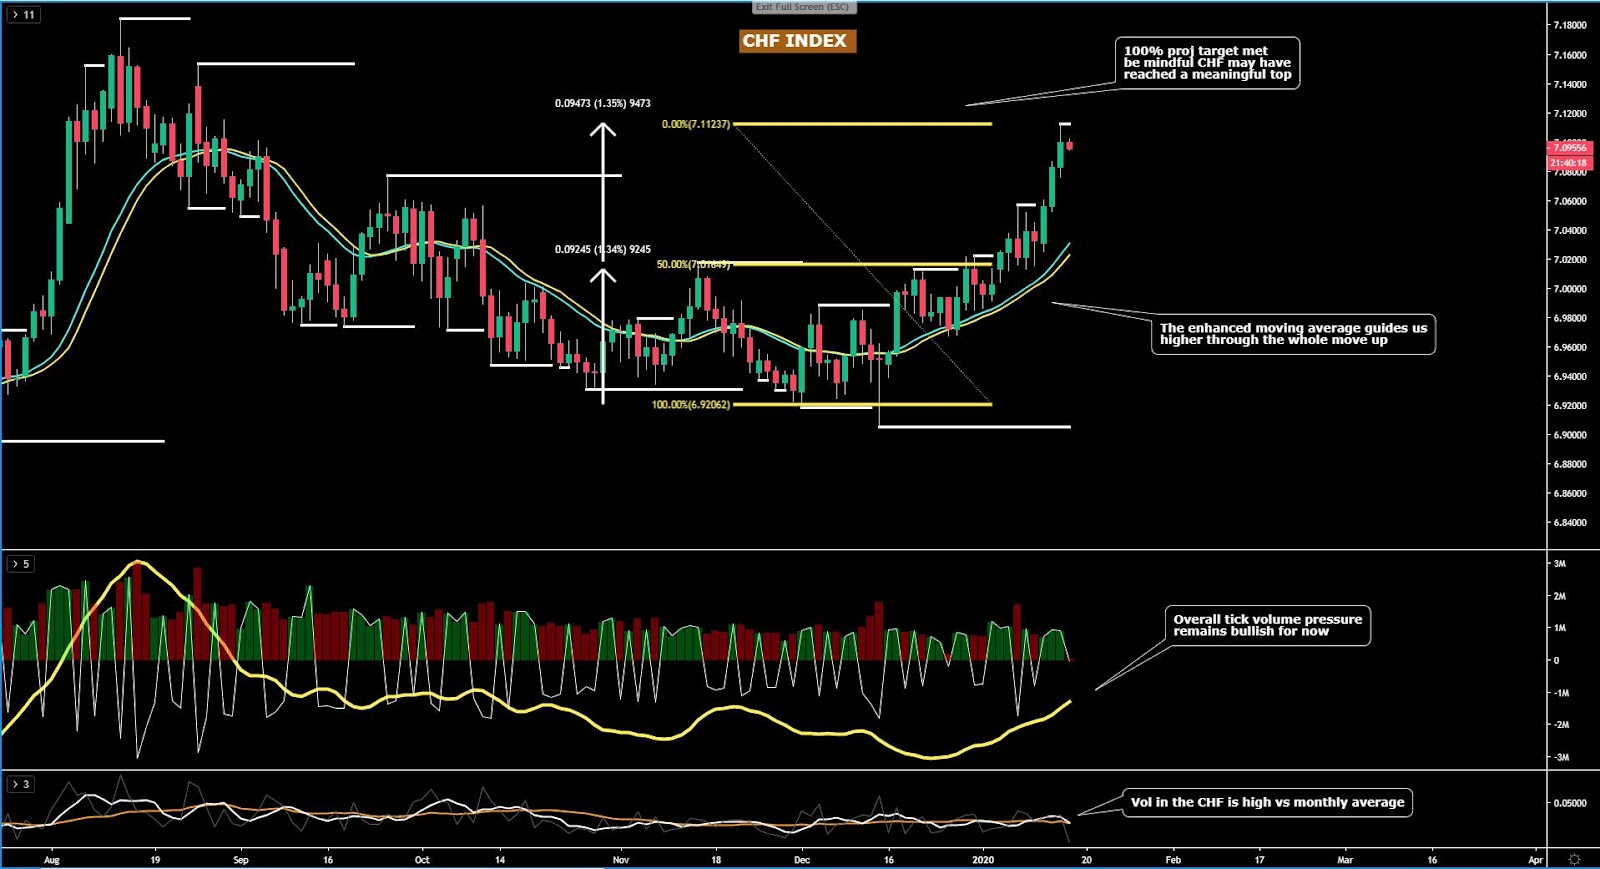
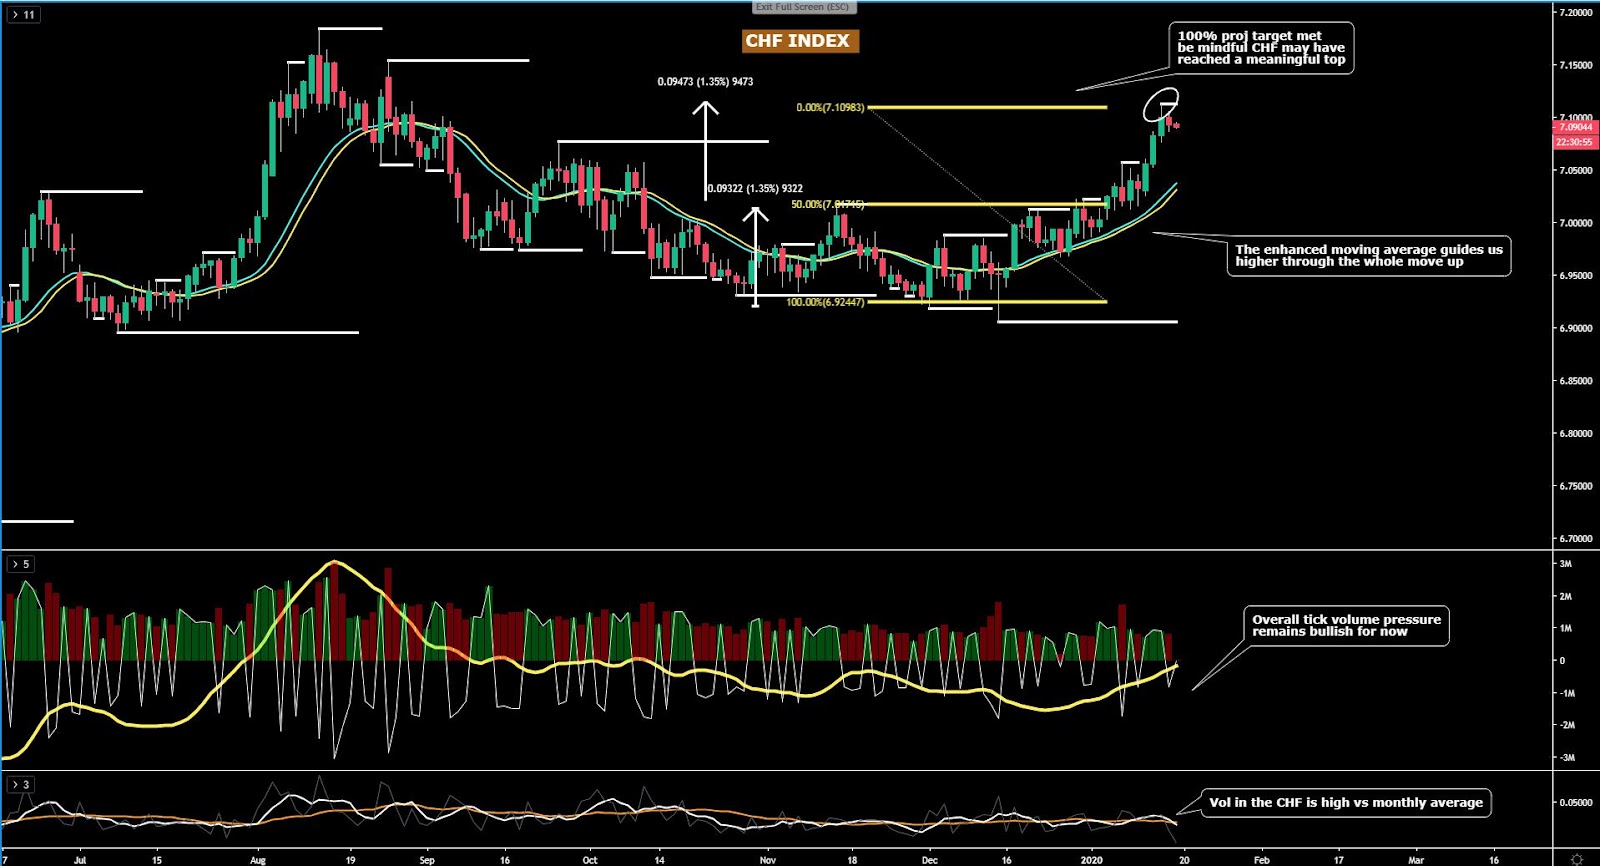
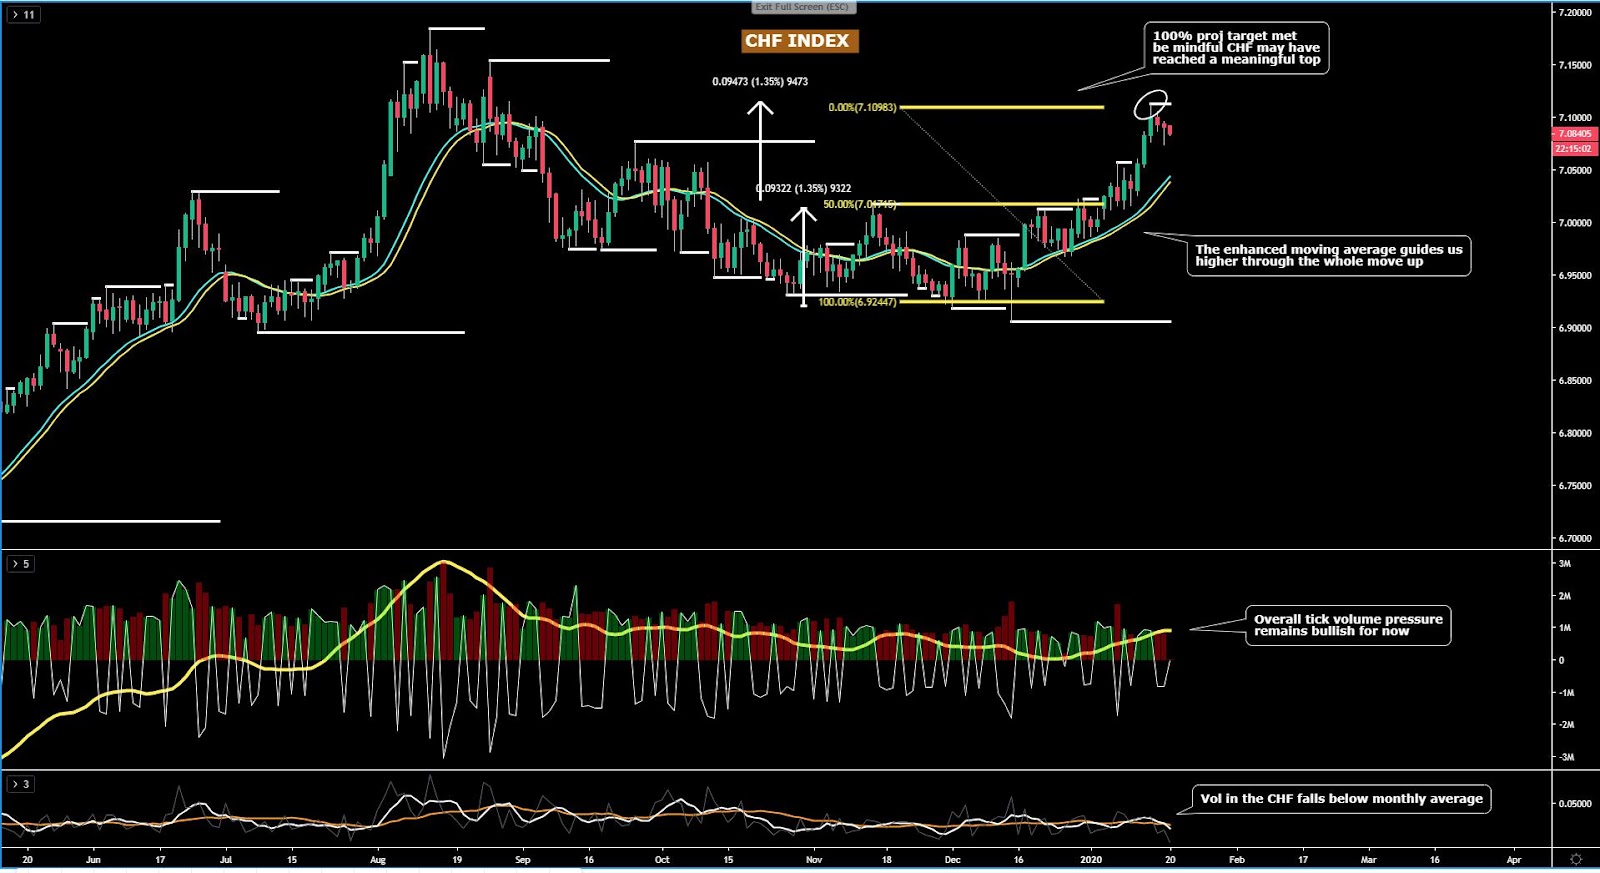
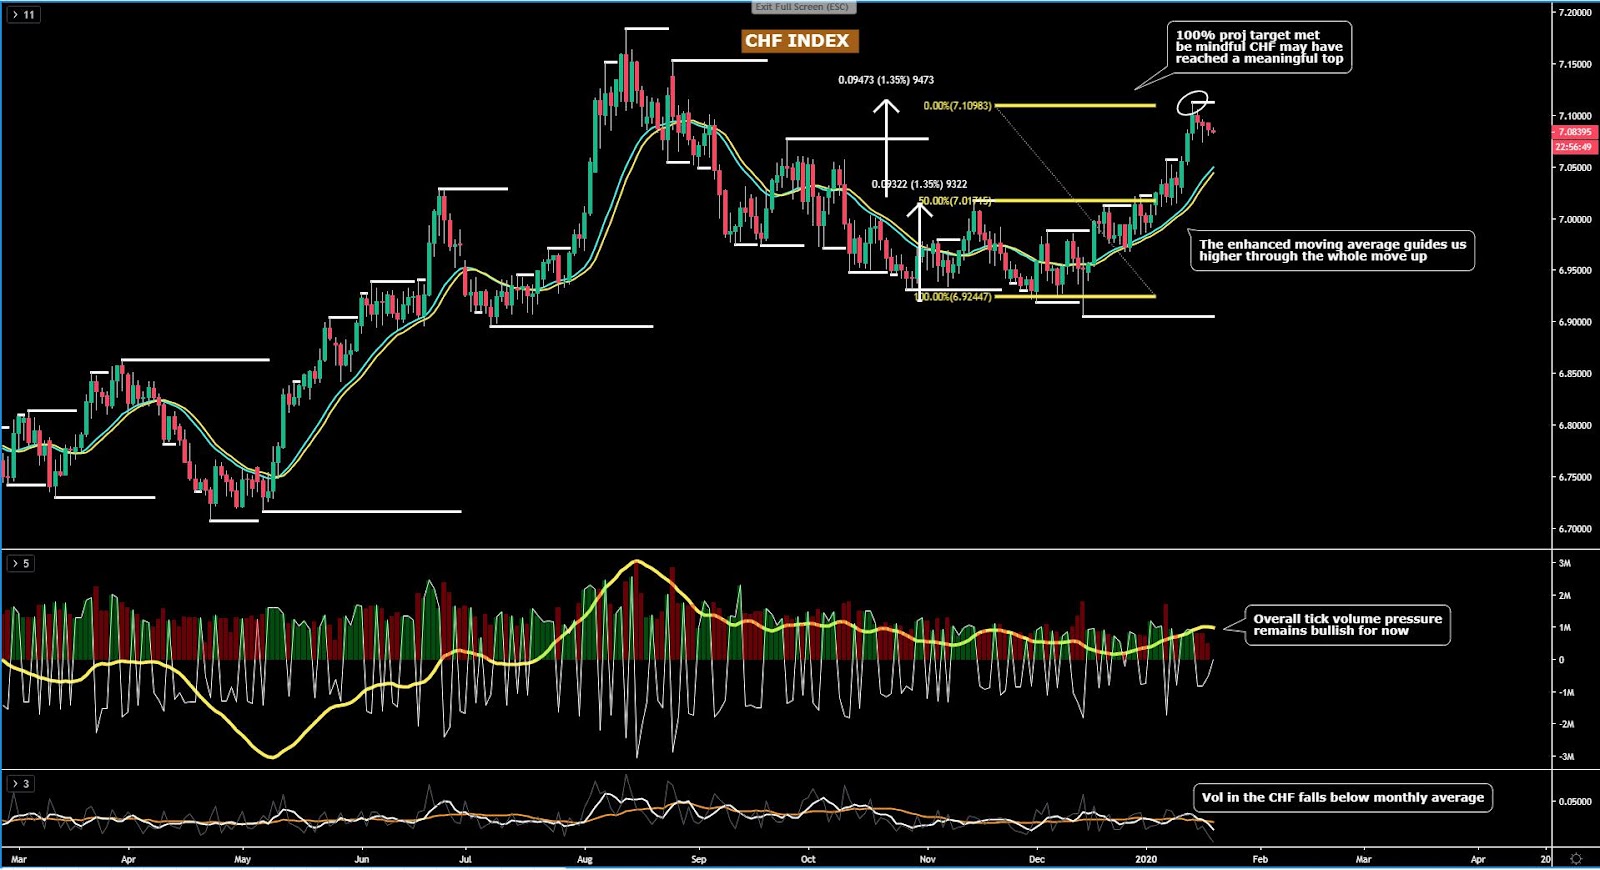
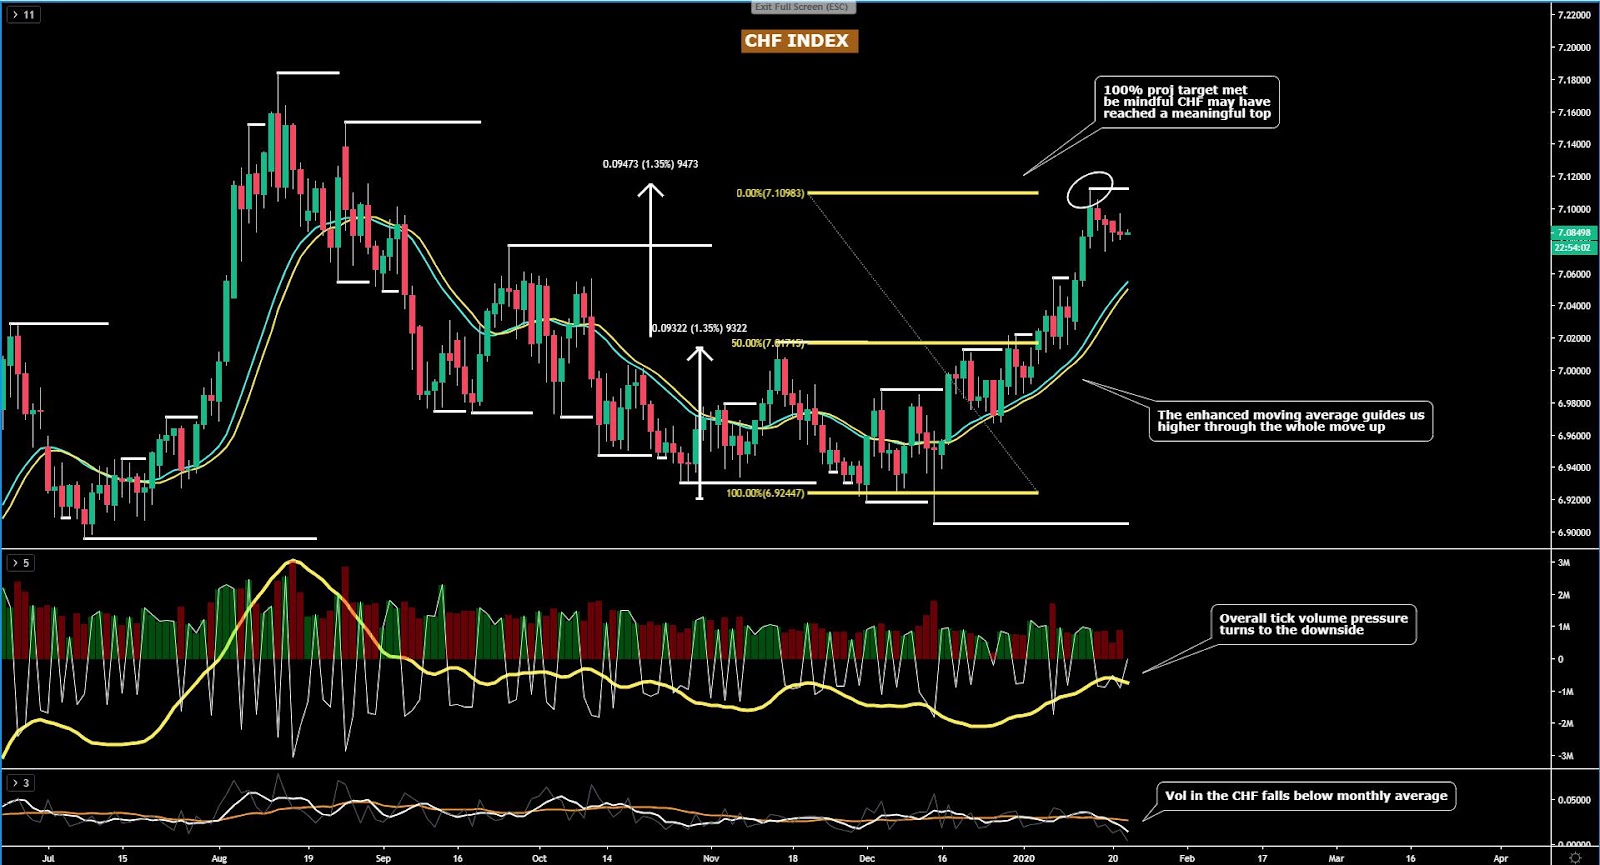
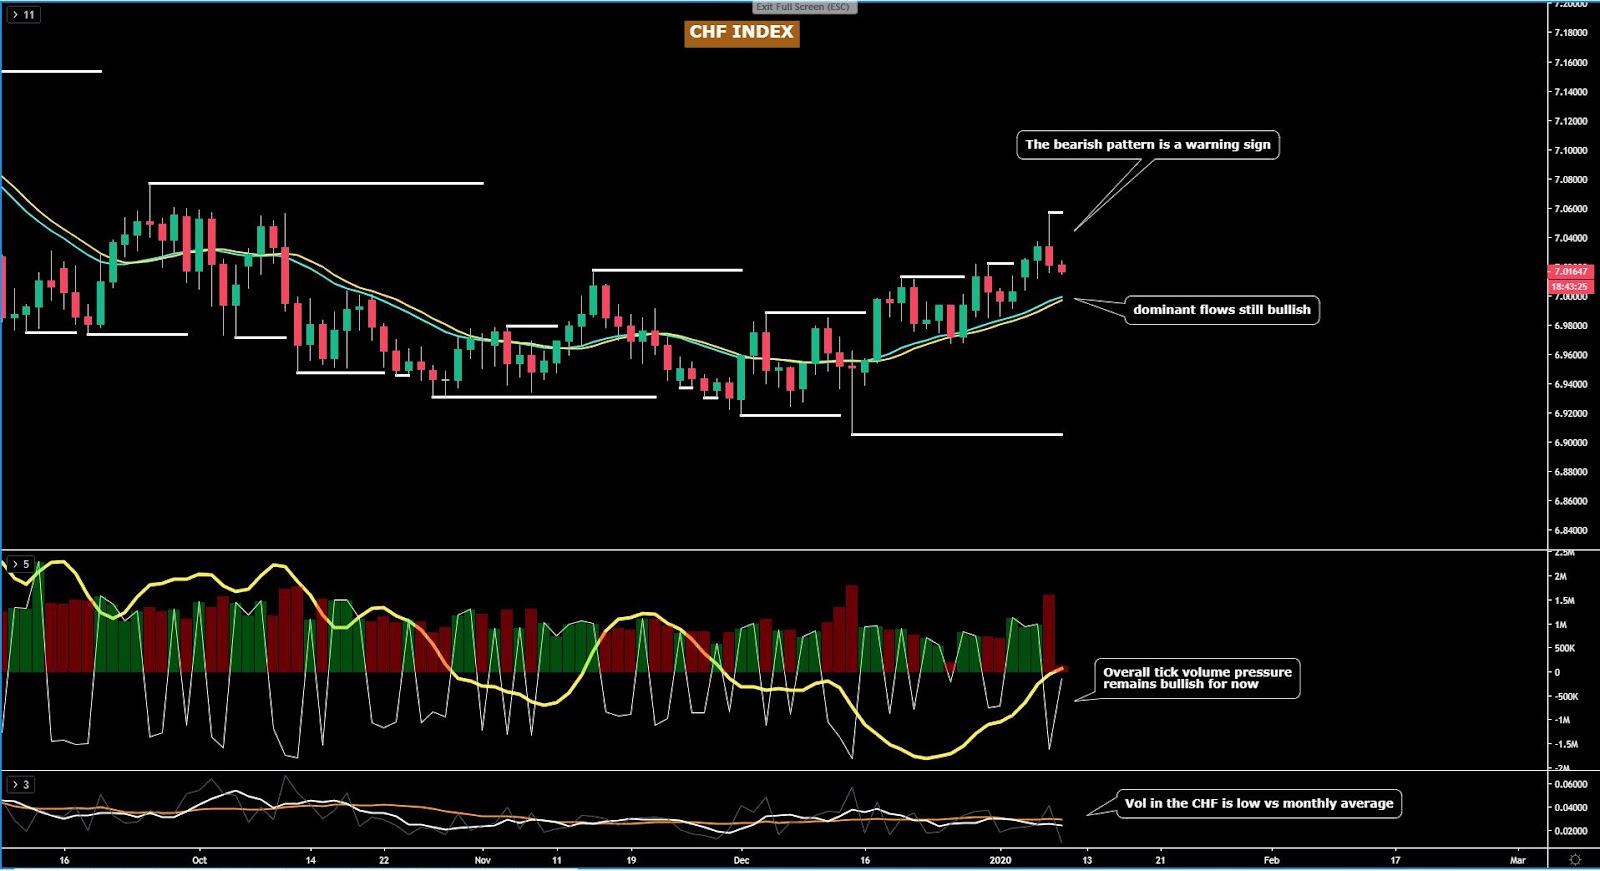
The CHF index shows a positive trend and even if the bearish outside day candle raises the prospects for a further setback, the chances for follow through in this market is less likely. If shorting the CHF, you’d be going against the smart money flows, the price structure and the aggregated volume pressure when we apply a 13ema to the OBV. There are way too many contradictory signals to make the case for a short-side bias. The forex seasonals for CHF are not encouraging, with losses averaging 0.53% in Jan since 1982.
Important Footnotes
Epic Risk-Off Unwinding, Blink And You Missed It
If, as a trader, you are yet to do the hard yards in financial markets, the last 24h provides a great opportunity to understand in all its splendor the dynamic and efficient nature of the markets. One hour it may look like all hell breaks loose, while in the next, the psyche can change in a dime. Find out in today's report the chronicles of what's happened and where do we stand in the FX outlook?
The Daily Edge is authored by Ivan Delgado, 10y Forex Trader veteran & Market Insights Commentator at Global Prime. Feel free to follow Ivan on Twitter & Youtube weekly show. You can also subscribe to the mailing list to receive Ivan’s Daily wrap. The purpose of this content is to provide an assessment of the conditions, taking an in-depth look of market dynamics - fundamentals and technicals - determine daily biases and assist one’s trading decisions.
Let’s get started…
- Quick Take
- Narratives in Financial Markets
- Recent Economic Indicators
- Dive Into FX Chart Insights
- Educational Material
Quick Take
Most of the volatility on Wednesday was concentrated along the Asian hours. Initial panic selling triggered by the prospects the US declaring war to Iran were relatively quickly met with the realization that such idea was unjustified judging by the delay for Trump to make any formal statement. What set out to be a very cloudy outlook for risk-sensitive assets shifted into an epic short-squeeze that lasted until the final hours of New York. If, as a trader, you are yet to do the hard yards in financial markets, the last 24h provides a great opportunity to understand in all its splendor the dynamic and efficient nature of the markets. One hour it may look like all hell breaks loose, while in the next, the psyche can change in a dime. After the headlines broke out of an attack to US personnel in Iraq by Iran, it became a binary outcome to figure out. Without much fact-checking available, the immediate premise was that Trump would need to strike back (war?), leading to a sudden fall in equities, bond yields, buying of Yens, Swissies, Gold. However, as Trump delayed its appearance with an official response until the next day, it acted as a revealing clue that an escalation of the conflict was probably not on the table. As Europe and American markets came online, the U-turn day kept playing out, only to get a final boost as Trump downplayed the attack with market friendly headlines.
The indices show the performance of a particular currency vs G8 FX. An educational video on how to interpret these indices can be found in the Global Prime's Research section.
Narratives In Financial Markets
* The Information is gathered after scanning top publications including the FT, WSJ, Reuters, Bloomberg, ForexLive, Institutional Bank Research reports.
A short-lived scare after all... What looked like terrifying prospects of a war breaking out between the US and Iran had the Iranian-led missile attacks against air bases housing US troops in Iraq claimed any casualties, turned out to be, at the end, the precursor setting the stage for an epic short squeeze in risk. As a consequence, assets most sensitive to risk dynamics, the likes of the Japanese Yen, the Swiss Franc, Gold, Oil, equities, bond yields, displayed major V-shaped rotations.
Delay for Trump to respond main driver to unwind positions: Initially, the fear and uncertainty of the unknown (what the US response to the Iranian attack would be), led to an immediate panic selling in markets during Asia. However, evidence that no US lives were accounted for in the attack, alongside the delay by Trump to respond (main driver in the risk recovery), led to a quick re-assessment that the panic selling was unfounded. The short-squeeze was well and alive and the recovery in risk never looked back.
Trump backs off from direct confrontation: During the early hours of Wednesday in the US, it was confirmed via a speech by the man himself, that Trump won’t be seeking further confrontation with Iran for now, set out the perfect storm for leveraged trading (risk seeking) to make a huge comeback.
Trump applies pragmatism given the circumstances: In the much-awaited Trump speech, the US President addressed some of the most pressing questions. But the bottom line, and the binary outcome to trade markets in a volatile day, was the admission that the US and Iran tit-for-tat retaliation may be over. This became obvious when Trump stated “Iran appears to be standing down, which is a good thing.” If one wishes to get deeper insights into the key highlights of the speech, I recommend this BBC report.
Iran's action an act of saving face: After the dust settled, a Reuters report surfaced that it was Iran’s strategy from the get go to deliberately sought to avoid US military casualties in strikes, citing US and European sources. The strike, therefore, was more symbolic than anything else, acting as a “warning shot”. This looks, therefore, to have been a tactic to save face by Iran without going to war, and as long as they believe it has served its purpose, that’s what matters to gain certainty that Iran is now done messing around with the US military capabilities. Besides, Iran stated that they'll stop attacking if there is no response from the US, according to US media in Tehran.
US VP Pence postpones speech on Iran: Further evidence that the US intends to de-escalate the tensions in Iran for the time being, is the fact that a scheduled speech by US Vice President Pence on Iran, was postponed. Vice President Pence was scheduled to speak on Monday 13 January at the Foundation for Defense of Democracies' National Security Summit in Washington.
Market ready to re-calibrate its focus? After this final and somehow bizarre ‘showdown’ orchestrated by Iran, financial markets might be on the cusp of moving on to re-calibrate the focus where it matters. This means the attention may finally move away from the inconvenience of having the constant headline-drips of US-Iran conflict to instead re-focus on the global outlook and trade with China and the US set to sign the trade deal on Jan 15.
Comprehensive trade deal with the EU virtually impossible: The series of Brexit-related news put pressure on the GBP on Wed. UK PM Johnson met with the EC President von der Leyen. While the British politician remains stubborn in that a deal must get done by the end of 2020, the EU stands by its firm believe that such a scenario is near impossible. The EU and UK will have to prioritize what they want agreed by the end of 2020, assuming there is no extension to the transition period. In looks likely that the UK will be seeking a Canada-style FTA by the end of the year.
If you found this fundamental summary helpful, just click here to share it!
Recent Economic Indicators & Events Ahead
Source: Forexfactory
Insights Into FX Index Charts
The indices show the performance of a particular currency vs G8 FX. An educational video on how to interpret these indices can be found in the Global Prime's Research section.
If you found the content in this section valuable, give us a share by just clicking here!
The EUR index has kicked off 2020 with analogous bearish tendencies as it closed last year, with the pressure to the downside not abating, even if similarly, deep downward extension are failing. Notice, in the last window, the actual 5-day vol remains below the monthly vol average. The bear trend remains validated by both the market structure and the enhanced moving averages as a proxy to understand dominant smart money flows. Wednesday's daily candle portrays sell-side commitment increasing as reflected by the spike in aggregate tick volume activity, which occurs in the context of a bear trend in compounded volume (see 13ema applied to OBV). It’s worth also remembering that the EUR seasonal pattern in Jan is very negative.
The GBP index could be setting up the stage for another test towards a major structural pivot point in the chart. However, the technicals pose challenges as there are conflicting daily signals preventing a well defined bias. Let’s break it all down. Firstly, on the positive side, the enhanced moving averages tracking the smart money flows is turning bullish for the first time since Dec 18, at a time when the buy-side volume has picked up the most since the UK election day, even if Wed’s Doji-like candle is far from inspirational for the bulls. Besides, the market structure is bearish until acceptance can be found above the resistance line overhead. The vol in the index remains below its monthly historical, which has obviously been distorted by the UK election. Lastly, note that as in the case of the EUR, the GBP also tends to suffer in January.
The USD index has found a fresh leg to the upside after the volatile 24h of forex trading, and judging by the close of the candle finding acceptance at the highs of the day by the end of business in NY, the volume it carried (highest since Aug 26th last year!), alongside the fact that the USD tends to attract heavy positive flows in January, my bullish stand has been reinforced. The overall sell-side volume pressure via the 13ema applied to the OBV is also turning bullish. That said, this Thursday and Friday the prospects a further bullish extension will be challenged by the ongoing bearish structure, which remains backed up by the smart money trend, as depicted by the bearish trajectory of the enhanced moving averages. It was an appealing proposition to be a USD buyer at the trend lows, less so at these levels.
The CAD index is the best positioned to keep extending its gains in the following days/weeks. The index shows ideal conditions to jump on the bandwagon of the currency to scalp this market intraday or if you are a trend following traday, then it also satisfies the pre-requisites. Engaging in the accumulation of CAD long inventory has the backing of the price structure, the smart money flows via the enhance moving average, the aggregated tick volume trend, even the relatively low volatility in the index when compared to the monthly historical is another positive as those looking to capitalize on trends prefer this one to develop in a low vol fashion. The CAD, at an index levels, paints a storyline very much in congruence with my bullish view on the currency, predicated on the fact that the BOC is one of the outlier Central Banks still paying a relatively much higher interest rate than the rest of the G8 FX space. The seasonals for the CAD are also positive, averaging over 0.33% of gains in Jan for the past 36 years.
The JPY index has printed a sizeable bearish outside day candle that accomplishes on its own right the purpose of guiding us in the next probably direction (down). Price action candles of this high-quality calibre are few and far in between and widely scattered, so we must pay attention. The candle negates the bullish price structure and brings back into focus a retest of the previous lows in line with the dominant flows as per the smart money flows (enhanced MA). The aggregated tick volume is also screaming that the commitment to lower the valuation was very high. Remember, while the seasonal pattern for the Yen averages +0.25% in Jan since Jan ‘82, the preponderance of evidence so far is that the currency may continue to struggle this month.
The AUD index offers a very enticing risk-reward to turn bullish from these lows. There is a case for the Aussie to build some legs from this critical level of support as it’s proven to be the most important base being respected since its first test back in early Oct last year. While the smart money flows are negative, be reminded that we are in the context of a wide range in the index (drawn in a white rectangle). The bullish pin bar off this key support carries the type of tick volume I’d personally like to see to cement this view about a tentative shift in flows. Besides the forex seasonal pattern is positive to the tune of +0.54% in Jan since the early 1980s.
The NZD index has printed a commanding bullish outside day that implies the risk for higher levels, with my view being that a squeeze to its most recent trend high may be in the making. The price structure is supportive, as is the enhanced moving average tracing the dominant flows, with the tick volume also backing this bullish view. As the technicals stand, and with no fundamentals in NZ to distort the trend, playing against this currency is not a good move imo.
The CHF index shows a positive trend and even if the bearish outside day candle raises the prospects for a further setback, the chances for follow through in this market is less likely. If shorting the CHF, you’d be going against the smart money flows, the price structure and the aggregated volume pressure when we apply a 13ema to the OBV. There are way too many contradictory signals to make the case for a short-side bias. The forex seasonals for CHF are not encouraging, with losses averaging 0.53% in Jan since 1982.
Important Footnotes
- Cycles: Markets evolve in cycles followed by a period of distribution and/or accumulation. To understand the principles applied in the assessment of cycles, refer to the tutorial How To Read Market Structures In Forex
- Horizontal Support/Resistance: Unlike levels of dynamic support or resistance or more subjective measurements such as fibonacci retracements, pivot points, trendlines, or other forms of reactive areas, the horizontal lines of support and resistance are universal concepts used by the majority of market participants. It, therefore, makes the areas the most widely followed and relevant to monitor. The Ultimate Guide To Identify Areas Of High Interest In Any Market
- Trendlines: Besides the horizontal lines, trendlines are helpful as a visual representation of the trend. The trendlines are drawn respecting a series of rules that determine the validation of a new cycle being created. Therefore, these trendline drawn in the chart hinge to a certain interpretation of market structures.
- Fundamentals: It’s important to highlight that the daily market outlook provided in this report is subject to the impact of the fundamental news. Any unexpected news may cause the price to behave erratically in the short term.
- Projection Targets: The usefulness of the 100% projection resides in the symmetry and harmonic relationships of market cycles. By drawing a 100% projection, you can anticipate the area in the chart where some type of pause and potential reversals in price is likely to occur, due to 1. The side in control of the cycle takes profits 2. Counter-trend positions are added by contrarian players 3. These are price points where limit orders are set by market-makers. You can find out more by reading the tutorial on The Magical 100% Fibonacci Projection