Live Forex Day Trading - Forex Day Trading Room

Hello,
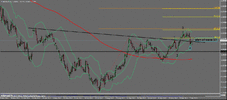
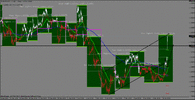
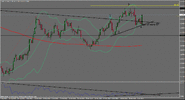
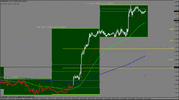
We have seen some risk off in the markets this week as stocks got sold with the fiscal cliff in the US looming. The USD got a bit stronger as some technical resistance was taken out in the USD index. Gold was not doing much though. Overall I feel the situations in the USD pairs are pretty neutral. The weekly charts suggest rather a bullish scenario with the recent fall in EUR/USD and GBP/USD just being retraces in an uptrend. AUD/USD is caught in a sideways range anyway. The JPY look a bit more exciting at the moment and also saw some decent price action with the JPY weaken. We are still below the weekly trend line though which is still pointing down. Once the JPY cross pairs break out of the wedge we could be up a serious run. The Live Forex Day Trading European session ended up at break even for the week.

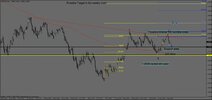
EUR/USD is continuing its march down but you see also some buyers stepping in in front of the 1.2640 support. This area was never been re-tested yet and I was calling are re-test a few weeks back. It got pretty close with 1.2670 low but some Euro strength lifted the pair back to 1.2800. This was a re-test of the September major low swing point. The pair closed about right in the middle of these levels on Friday and also between the 5 day and 20 day VWAP. I am neutral right now since we could already see the start of wave 3 here in the weekly chart (see prev. post) without going to exactly 1.2640.30. Time will tell.
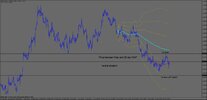
eurusd_november18h_2012.jpg

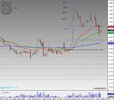
GBP/USD also making new lows here on the daily chart. The pair almost hit the 261.% Fibonacci projection level now in the daily chart. Heavy support waits at 1.5750 and slightly below that area is the 61.8 retracement level from the run up. You could argue a bit here about at what point the run up started and how to draw the retracement but I just went with the July 12th low. In the end it does not really matter that much it just shows you that the pair is still just in a retrace from an up move. Like in the EUR/USD it is hard to say if the pair goes much lower before turning around again or we see the next wave to the upside soon. I think the market want at least to see 1.5800-1.57500 before possibly going higher. Right now it is a guessing game with no clear direction in the weekly chart and volatility still drying up.
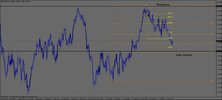
gbpusd_november18h_2012.jpg

AUD/USD is still neutral. The latest sell-off in stocks would suggest more AUD weakness on risk-off but Gold is still stable. The charts don’t tell me much here. This pair seems to go nowhere at the moment and you can still look at the chart from the previous weeks to get the picture.

Regards,
Marco
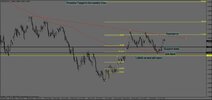
 
Hello,

I just want to give a short update on EUR/USD here and the results. So far my prediction for that 1.3000 run came true. Remember I made that when EUR/USD was around 1.2840 and I was looking for a drop to 1.2640 to go long for a swing trade with 1.3000+ target area. My buy limit never got filled since the low was around 1.2670 and I missed that move. “Black Friday’s” low volume was used to squeeze out the last shorts and today we saw a break of the 1.3000 level. The break was not very significant though and I was telling people in the room to be careful to go long here since EUR/USD will probably re-test much of Fridays squeeze. I was looking for 1.2920 and 1.2935 has been so low so far intraday. Nevertheless this is just a retrace in the recent run-up and I highly doubt that we see my 1.2640 retest here. 1.3080 is still the first target area und the next leg to the upside. Once the trend line gets taken out there is not much in the way. The 100% Fibonacci expansion target is 1.3780 to give you an idea how far this could go. As long as EUR/USD keeps moving below the weekly trend line the pair is still vulnerable for further selling though. Support comes at 1.2800-1.2700 with the 200 daily SMA on the lower end of that support zone. Not sure If I would like a long now around 1.2640. A break of the 1.2670 swing low paves the way for a move to 1.2450. For now I go with the long scenario after the current retrace.
Last weeks result was slightly up but just a few pips. Good start to this week though but still three days to go.

eurusd27thseptember_2012.jpg

Regards,
Marco
 
Hello,
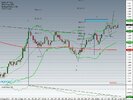
Another rather short update here on EUR/USD. Things looked like they get interesting but only for a short time. The pair is still in the same scenario like two weeks ago with the reverse HS pattern playing out potentially in a big way. The weekly Fibonacci projection also has a target of at least 1.3350 but the pair could go also all the way to the 100% FE up at 1.3780. The pair broke the weekly trend line (HS neckline in that case as well) with relatively ease. Everything was looking almighty good here for bulls but then all of a sudden the Euro lost its shine again on the usual European debt worries. There has been also a bit USD strength recently but if you look at the Euro related cross pairs you will see that it has been mostly Euro weakness causing the latest drop in EUR/USD. The Pair is moving sideways now in that 1.2800-1.3200 range for most part of the last three month and neither bulls nor bears have won the battle. As long as we stay below the weekly trend line here bears are somewhat in control and I prefer to look for shorts. One thing to note though is that the price also hit the middle Bollinger Band in the daily chart here and Friday. The price could very well bounce here on the assumption that we see the wave 3 up in the daily chart now. On the weekly chart the pair is in wave 3 anyway already. The black colored count is the weekly waves count and the blue colored count are the daily waves in the chart below. Note that the 61.8 FE level of the weekly wave 3 and the 100% FE of the daily possible (!) wave 3 are about in the same spot around 1.3350. If we see here really the start of wave 3 in the daily chart remains to be seen though. For now I am neutral on the pair. While I like the upside potential here I am not turning bullish below 1.3070.
Results for the Live Forex Day Trading room have been -29 pips for last week and +47 pips on the week before.

eurusd10decemberr_2012.jpg

Regards,
Marco
 
First of all a happy new year to everyone!

The year starts on a positive tone as the US avoided the fiscal cliff for now. Stocks have great day moving up more than 2%. I was looking for risk-on trades therefore but the problem was that the large move already happened during the Asia session. I did not want to countertrend but instead I decided to wait for some retracement before going short in the USD. I went long in EUR/USD as the 1H 20 EMA (green line) seemed to hold at 1.3250 with an initial SL below the daily pivot at 1.3190. The pair moved to 1.3280 but was unable to break 1.3300 once again. The trade was only ½ size because there were two potential dangers for a long. A double top on the 15min chart ( also a spike and ledge pattern) and more importantly a double top at 1.3300 in the daily chart. Note that the pair failed to break that area significantly on December 19th as well. In the end I was very careful and moved my SL to 1.3220 and to break even shortly afterwards where I got stopped out. The daily chart still looks bullish with the known Fibonacci targets at 1.3330 for the wave 3 on the daily chart and 1.3780 on wave 3 in the weekly chart. I hope the pair does not run away and I get another chance to get in for another long attempt. Commodity currencies are doing very well in the risk-on environment. I missed a short entry in EUR/AUD and/or EUR/CAD today so that will be on the radar for short in case of any pullbacks .

EURUSD 15 Min 20130102121233.jpeg EURUSD 15 Min 20130102164756.jpeg

EURUSD 1 Day 20130102121322.jpeg

Regards,
Marco
 
Hello,
I had some technical difficulties today and was not able to trade. Nevertheless we got a decent setup in EUR/USD which I would like to point out. The pair saw further weakness at the beginning of the Asia session and remained on a negative tone into the London close. If you remember I took a long yesterday at 1.3250 and got stopped out at break even after a couple of hours. In hindsight I was a very good choice to put the stop at break even since the pair totally fell apart. The impulse wave to the downside hit the 200% Fibonacci Expansion to the pip and even took out the low from December 31st. The levels shown in the chart are not totally accurate though since Active Trades started to quote at 7 am CET instead of midnight. The actually high in EUR/USD was 1.3299. Luckily this happens only once a year on the first trading day. After a short bounce the next impulse wave brought the pair almost to the 261 Fib level also breaching yesterday’s low. Since I like to take my trades either at a Moving average or a pivot level there was still no short setup yet until the pair made a retrace to the hourly 20 EMA area. From there the pair dropped quickly 50 pips with the next impulse wave. If you followed my previous posts you will note that we are now in wave 4 down in the daily Chart and also re-testing the inverse Head and Shoulder neckline. I still expect wave 5 up which should bring the pair back up past the 1.3300 level for good. For now the downside momentum could be still high enough to bring the pair down to 1.3000 for another short on a retrace to the MAs. Nevertheless I would not bet the farm on further downside. We will see how the FOMC meeting will affect the USD in a couple of hours.

eurusdjan3rd2013.gif

Regards,
Marco
 
Hello,

EUR/USD hit the 1.3000 as predicted in my previous post and also saw a bounce so far as I anticipated. I won't post the daily chart again but if you read my previous post you can see that we have seen wave 4 in the daily chart count and I expect wave 5 now to the upside which could bring the pair above 1.3300. Unless you took the trade around 1.3300 I think it might be still the best to sit on the sideline for now and wait for further conformation for an up move before jumping in to the long side. As you can see in the chart the pair just made the bullish MA cross between the 30min 20 EMA and the hourly 20 EMA. I will wait for the price getting above the 100 hourly MA before getting in. For now the bears are still in control in the shorter TFs. Trades against the 100 hourly MA can be tricky and see can see in the following example.

eurusdjan4rd2013.gif

EUR/AUD took a substantial dive in the last couple of days and I was looking for a reversal or at least a retrace in that pair. I wanted to wait for a bullish MA cross and the price the break the pivot and make are-retest. All conditions were met and I went long at 1.2498 with a stop at 1.2470. Note that the trade was against the 100 hourly MA and it was also and inside day. Another unpredictable factor was the NFP number but I thought the effect on this pair would be rather limited. Nevertheless I took the trade only with ½ size because of these factors. The trade got stopped out. You can see the period of white candles with the bullish MA cross was very short and proved to be a false signal. So if you trade against the 100 hourly MA I would recommend doing it with smaller size than usual.

euraudjan4rd2013.gif

Regards,
Marco
 
Hello,
We saw a rather quiet day until some movement into the London close. It looked like we would see an Inside day in EUR/USD and GBP/USD but EUR/USD managed to take out Fridays high at last. The pair is trading around the 100 hourly MA right now and consolidates recent gains. You can see in the 15min chart that the pair also hit the 100 Fe level on that impulse wave. While you could consider this as just a retrace of the recent down move in the 15min TF I think we see rather the end of the retrace in the daily chart. It is a bit too early to tell but if the Daily candle stays that positive then there is a chance for wave 5 up on the daily chart. It remains to be seen if the high of wave 3 gets taken out but I would not be surprised if we see even the 161.8 FE level around 1.3600 at some point. The inverse Head and Shoulder pattern is still in play and we just saw the re-test of the neckline. I am looking for a long entry tomorrow. Today proved to be a great example to wait for a break of the previous day high/low before going with the trend. As long as you see an Inside day the market is in an indecisive status. It is a solid strategy to wait for new high and lows and some stop hunting and then a retrace before taking a trade with the trend. Otherwise you can get caught in a reversal.

euraudjan7th2013.gif eurusdjan7th2013daily.gif

Regards,
Marco
 
Hello,
The EUR/USD started very slowly into the day as expected with the ECB meeting coming up later. My bias was bullish though since it seemed very unlikely that the ECB would cut rates. I took a gamble I went long right in front of the rate decision with a tight 20 pip SL. Usually I am not news trading but this was an exception. The ECB left rates unchanged as expected and saw a little pop but not by much. I got out for +21 pips. My final target for the up move was 1.3160 which was the former support and it became resistance. That target got hit during the ECB press conference when Mt. Draghi stated that the decision to leave rates unchanged was unanimous. That is probably a sign that the ECB has no intention to cut rates in the near future. In the 15min chart the pair got now to the upper end of the channel and might consolidate/retrace here. So my projection I made when the EUR/USD was still at the daily pivot was pretty much right it just went a bit higher than I anticipated. I have to wait for pullbacks now to go long again. In the Daily chart the trend line was holding and it is looking more and more like wave 5 to the upside with the 1.3330 target. Since 1.3300 is a tough resistance area I would be happy with 1.3280 though if I can catch an entry.

eurusdjan10th2013.gif eurusdjan10th2013daily.gif

Regards,
Marco
 
Hello,

There is not much to say about the European morning session here. After such a strong move in the EUR/USD and GBP/USD it was more than likely that the pairs cool off their overcooked conditions and consolidate/retrace. It is hard to take any trade in the kind of situation: On the one hand you don’t want to fight the trend and on the other hand you don’t want to buy at such overbought levels. All you can do is hoping for a pullback and then go with the trend again. If the pullback does not occur and the pair runs further than you can only stay on the sideline. If you like to countertrend I would not recommend doing this before the 200% or even the 261% Fibonacci expansion level. You can see in my chart below that the EUR/USD run all the way up to the 261% FE before losing steam. Countertrading the 261.8 FE level was good for around 30 pips but usually you want to get out after a retrace to the 161.8 FE level at least before taking profit. The run is also a good example of what can happen if you want to fight the momentum especially after a central bank decision. After consolidating for around 16 hours the pair took out stops about the consolidation range and immediately rushed to 1.3360. Remember that I was still expecting that the 100%FE level in the daily chart and the 61.8% level in the weekly chart will be reached at some point. Technically the count in the daily chart could be completed now. It does not have to run more the 100% FE level on wave 5. The weekly chart reached the minimum target as well. Here we are still in wave 3 with a 100%FE target at 1.3790. Note that the 200% FE Daily level is there as well. While the longer term targets are pretty clear I can’t tell how fast we get near this area. We could see wave 3 in the weekly chart going straight to that level but we could also see wave 4 down at some point first and then wave 5 up. One thing to note is that we have seen the volatility increasing a bit. If you look at the Average True Range indicator you see that we got a trend line break and establishing a bit of an uptrend. I hope that will continue.

eurusdjan11th2013.gif eurusdjan11th2013daily.gif

Regards,
Marco
 
Back
Top