Live Forex Day Trading - Forex Day Trading Room

Hello,

Weekly review:

We have seen finally some volatility kicking in the currency market last week and some extensions of the tight ranges we have seen during the dull summer weeks. The FED announced that they would do QE3 “fairly soon” in case of no improvement of the US economy here in the near future. You got the expected moves in Gold, EUR/USD and GBP/USD on the “almost” announcement of more stimulus for the economy. Equity market and AUD/USD took a dive though which might have looked kind of strange but given the recent run in stocks it was a well-deserved break. A classic sell the news scenario.

We have seen a very technical move here in the EUR/USD last week. The pair broke the 61.8% retracement level after the FOMC meeting minutes. We saw a nice retest of that area where the pair bounced to new highs. The move was a bit larger than I expected. The prices overshoot the 200% Fibonacci expansion level drawn from the low of the first impulse wave to the top of that wave and to the bottom of the 2nd retracement wave. Overall it was a perfect 5 wave pattern with an ABC correction afterward. Wave C could bring the pair down to 1.2450 again and complete the 100% Fibonacci expansion correction. Form here look for further upside moves.

eurusd_august26th2012.gif

GBP/USD finally broke the daily resistance level as anticipated. The pair got to the 200% Fibonacci expansion level without much hesitation. Nevertheless there was a bit consolidation which I identified as the 4th wave in the up move. The 5 wave pattern was completed at the 200% FE level and we already got an ABC correction pattern. Let’s see if we get the complete re-test of 1.5775 again. I don’t think it is completely necessary here because we already got the retest in the hourly chart but it would look nice on the daily chart. I certainly will look here for long again next week.

gbpusd_august26th2012.gif

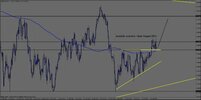
AUD/USD is the hardest to read here. It was the only pair which really followed the Equity market weakness despite USD weakness in general. It has been also very choppy for this pair last week. It looked like it would move higher without testing the trend line support and made a new high in the 2H chart. That turned out to be a fake and a lower low followed immediately. We got the test of the trend line and a break right to the old 61.8% FE level. Bulls tried to bring the pair on Friday back above the trend line and we close basically right at the trend line support. I would say the battle for the bull is not completely lost here but it is getting critical. I am pretty neutral on the pair right now and will probably avoid it to trade until I see a clearer direction.

audusd_august26th2012.gif

Regards,
Marco
 
Hello,
There was no European live room session yesterday because of the UK bank holiday.
Today I had a bit mixed feeling about this market. I liked GBP/USD and EUR/USD in the hourly charts to the upside since we have seen a completed ABC correction after the 5 wave up move. Nevertheless I did not want to go long in a 15min TF downtrend. I was hoping for one last push to the downside in EUR/USD to the 100% Fibonacci expansion level of the ABC correction and then a reverse of my position to the long side. I went short 3 times this morning but EUR/USD just did not want to push lower and made a complete trend reversal when shorts throw the towel. I lost 13 pips combined on my short attempts which is not much considering the move we have seen afterwards. I was actually looking for that move since I expected another impulse wave to the upside but the level where it turned around surprised me. EUR/USD also never made a retrace to the 30min 20 EMA or a re-test of the break-out levels so I was not able to get an entry. I will try now to catch the 3rd wave (2nd impulse wave of that move) in the Live room.

eurusd_28thaugust_2012.gif

Regards,

Marco
 
Hello,
We got a mixed bag here for the last couple of days. The Stocks market is looking like it might have seen a short term top here. AUD/USD and NZD/USD are looking weak. GBP/USD made new highs and EUR/USD is moving sideways. Hard to get any clues here about risk on or risk-off.
I took two long positions yesterday in GBP/USD. We saw another impulse wave to the upside I was expecting the retrace to end at the daily pivot level. I went long slightly above the pivot and closed for +10 pips when we did not get any more momentum. I still believed in a push to the 61.8% Fibonacci expansion level and put a buy stop order at 1.5825 with a 10 pip stop and a 20 pip target in the order mask. The order got filled and the TP got hit. The session ended +30 pips.

gbpusd_august30th2012.gif

Today I was looking for that 2nd impulse wave to the upside. I went into two long trades but we just never were able to breach past that 38.2 Fib FE level significantly. I lost 8 pips on the first attempt and a break even trade one the second. As I writing this EUR/USD is breaking down. I guess what can’t go up has to come down. I also took a long GBP/USD and lost 1 pip. I won’t even bother your with the details. Overall -9 pips for the morning.

gbpusd_august30th2012.gif

Regards,

Marco
 
Hello,

The US dollar gave back Thursday’s gains here on Friday. The move did not come unexpected since we had Mr. Bernanke speaking in the US session. I was wary to go short EUR/USD and GBP/USD in the European session even the 15min chart pointed down. I did expect some short covering here in anticipation of the speech since the FED announced more QE” fairly soon” in case of no improvement of the economy. I also liked the daily chart to the upside in GBP/USD. I made a projection for the most likely scenario in my opinion on August 23rd for the members the live room and so far things look like the scenario may become true. Since I like to go mostly with the trend I was looking to go long GBP/USD after the re-test of the breakout level in the daily chart. The 15min chart was still pointing down in the European session and therefore I had to wait for a trend reversal there as well to go long. I drew my long scenario in the 15min chart when Cable was still at morning lows. Basically I wanted to a break of the daily pivot and a re-test of that level to go long. The target area was around the 100% Fibonacci expansion level of the first impulse wave to the upside. As you can see that scenario became true. That is a very good example to plan your trade and trade your plan. The re-test happened slightly after the live session though. I hope most members took it since it is hard to get more precise to map a possible setup hours before it happens. We did go long though in the live session also because I already anticipated that the re-test of the pivot would probably happen after the live session. I got in at 1.5793 and was hoping for a move through 1.5800 on the first attempt. When we got the test of 1.5800 I put the SL to BE. Seller stepped in at 1.5800 and the price fell back exactly to our entry level before going higher. That happens when you want to be out of risk quickly. Nevertheless I was able make a nice profit out of the regular setup afterwards.

gpbusd_2ndseptermber_2012projection2.jpg

gpbusd_2ndseptermber_2012projection.jpg

Regards,

Marco
 
Hello,

I went long in EUR/USD yesterday since I expected a push to 1.2610 minimum and 1.2610 maximum. We did not move at all on this Monday morning which was not much of a surprise given the fact that we also had a US bank holiday. I closed the trades I had on for -8 pips on ½ size=-4 full pips. We got to 1.2610 in the afternoon and the initial stop would have hold. Oh well. It is pretty sad that we have even more volatility in the US session on a bank holiday than in the regular European morning session.
Today I was looking for long again. I had two entries at 1.2615 and 1.2623 with ¼ size each. Again no follow through momentum here and I closed for +2 and -3 pips. I went long GBP/USD on a break out. But surprise, surprise: Again no momentum. I got out at BE. What can’t go up has to come down. Since EUR/USD failed to take out the 100% Fibonacci expansion level I thought we will see a retrace back to the 61.8% FE level/Daily pivot area. I went short with ¼ size at 1.2613 with a tight stop above the high and a 1.2591 target. I closed the trade at 1.2596 manually + 17 pips. That trade did even out the loss from Monday. 1.2555 is key support now.

eurusd_4thseptember_2012.gif

Regards,

Marco
 

Attachments

  • eurusd_4thseptember_2012.gif
    eurusd_4thseptember_2012.gif
    37.8 KB · Views: 2
Hello,

The market stayed choppy and without any direction in front of the ECB meeting and the NFP numbers in the next two days. EUR/USD saw a bit of selling at the start of the session but I preferred the long side since the pair was still holding above the trend line. I waited a bit for the selling pressure to diminish and went long with ¼ size at 1.2534 and a 20 pip stop just below the lows of the morning. The basic idea was right but another push to the 1.2500 hit my stop. As you can see in the hourly chart the pair hit the 38.2 %FE level and bounced straight back to the 100% FE level afterwards. I had that level in mind as a possible long entry point but I did not want to grab the falling knife with a loss before. I went short GBP/USD instead a t1.5857 with ½ size and a 10 pip SL. The pair made a decent new low and retraced back to the 30min 20 EMA/100 hourly EMA. I moved down my stop to 1.5862 shortly after the entry and got stopped out on the next push to new highs. Overall the morning ended -6 ½ full pips. On the positive note my EUR/CHF long entry from August 7th at 1.2019 with a 1.1999 SL and 1.2040 TP hit the target today for +21 pips. That put us in the positive for today. I will go long again in EUR/CHF if it comes back to 1.2010. As you can see once per month we get these nice spikes to 1.2030-1.2080.
It will get quite volatile in the next two days but probably not before the ECB meeting minutes. So far the 100% FE level proves to be strong support. I don’t know how much stimulus from the ECB and FED is already priced in right now. Staying just on the sideline and going back to the Technical Analysis on Monday might also not be the worst idea. The next two days belong to the news traders.

eurusd_5thseptember_2012.gif

Regards,
Marco
 
Hello,
We have seen a very slow market yesterday in the European morning session. The GBP/USD might have set a record with merely a 13 pips range in the during the live room hours. I tried a long but got tired soon of the price action and pulled out for -4 pips. My second trade was a long in EUR/USD. I was hoping for a break out of the resistance area but the pair did not really push past the 100% Fibonacci expansion level. I missed somewhat a good exit since at one point the trade was up 18 pips and decided to put my SL to +4 to even out the loss in the Cable trade. I got stopped out and the day ended at BE.

Today I was expected another snooze fest. The volatility is usually very slim on a NFP day and I did this day not being any different. GBP/USD still had some potential to the upside in my charts while EUR/USD was looking a bit toppy. I did not want to go long in front of yesterdays though so I decided to put in a buy stop order just above yesterday’s high with a target at the Dr1 pivot level. The stop was very tight with just 10 pips since we also had a very small target. I expected some stops getting hunt above the resistance in case of a break but did not really see a large push with momentum in front of the NFP numbers. My order got filled at 1.5945 with ½ size and the TP got hit soon at 1.5955. +5 full points.

gbpusd_9thseptember_2012.gif

gbpusd_9thseptember_20121.jpg

Regards,
Marco
 

Attachments

  • gpbusd_2ndseptermber_2012projection2.jpg
    gpbusd_2ndseptermber_2012projection2.jpg
    86.5 KB · Views: 1
Hello,
Last weeks performance:-27 pips for the European session. I don't show details here since last weeks price action was news driven and technical analysis tools were mostly useless. Nevertheless the US session did more than compensate for the losses.

It has been quite an exciting week for the market here. The traders were awaiting the German Constitutional Court Ruling on the ESM and the FOMC statement. The USD already lost plenty of ground against most currencies ahead of these events and it was not sure how much was already priced in even on a USD negative outcome. The German court did not say “no” to the ESM as long Germany’s commitment would be limited to a certain cap. That was widely expected but nevertheless we saw a bit of a relief rally. Most traders also were expecting QE3. The question was how aggressive would the Fed be this time. Mr. Bernanke did not disappoint the market and the devaluation of the USD continued. Many strategic longer term USD long positions needed to be unwind since the pressure was quite dramatic. Trading in this kind of “political driven market” can be quite frustrating. Most Forex pairs were already in extreme overbought/oversold conditions before the announcement of QE3 and from a technical view it was very hard to catch the trend with a good risk/reward ratio. We also saw not any decent retraces to get in so the only option was to stay aside or to counter trend trade. We are now in pretty extreme levels and the air might get thin here for our major pairs. Nevertheless fundamentally there is not much speaking for the USD right now and the momentum might be still strong next week against the USD. We probably see some sort of consolidation at highs with some pullbacks but also demand to sell the USD on these pullbacks. Let’s take a look at the daily charts today since the bigger picture changed here in the last two weeks,
The EUR/USD managed to gain 700 pips in the last 9 trading session. This is quite an expressive run and you see this kind of move maybe twice a year. I am not a big fan of these indicators like stochastic and co. but to illustrate the current market condition it put them up in the chart today. The Daily RSI indicator shows a value above 80 after Friday’s close- a level not seen since September 2010. While we are in a much overbought condition right now we also have to remember what happened two years ago. The EUR/USD was trading around 1.3800 back then and the RSI at 80 did not stop the EUR/USD to move another 500 pips to the upside before finally turning around. I think it would be foolish to expect that it will be different this time. Technically the next resistance comes around the 1.3280 area which was support in 2011 and resistance earlier this year. I expect a test of this region next week and then some consolidation. The swings will get probably get a bit wilder and volatility should pick up since the important new events are out of the way for now and the summer is over. Support is seen at the former consolidation area 1.2830-1.2730. I think we should get of this area as well in the near future. A break below would bring bears back in control.

eurusd_14thseptember_2012.gif

GBP/USD reached my target and even went a bit further (see prev. posts). I really did not expect the Cable would be going through the daily trend line resistance on the first attempt though. We are now pretty close to the 1.6320 high from April. We should see at least a re-test of the trend line and probably also of the former resistance around 1.6050. Nevertheless 1.6220 could come first. This is also the 261 Fibonacci expansion level from a previous impulse wave. Major resistance comes up around 1.6470. Overall there is still much work to do here for the GBP/USD to leave the sideways range which kept GBP/USD for years between 1.5200-1.7200. Bears on the other hand want to see Cable falling back below the trend line again and some lower highs and lower lows.

gbpusd_14thseptember_2012.gif

AUD/USD stopped also its recent slump and soared to recent highs again. Overall the rally was not as impressive as EUR/USD and GBP/USD though. EUR/AUD ran to new highs as well. Longer term I am more bullish on AUD than on Euro though. With the Fed pledged to buy bonds worth 40 Billion every month and presenting a low interest environment until 2015 Gold will shine bright in the future. I see also higher commodity prices and that should obviously bode well for commodity pairs like AUD and CAD. The possible slowdown in China could be an issue of course and we might also see some lower interest rates in Australia to keep in the economy in shape. Overall is see those risks less eminent compared to the European debt crisis though. Short term AUD/USD could underperform the EUR/USD with EUR/AUD having some momentum. Technically the AUD/USD is facing some resistance by a daily trend line which is around 1.6050 at the moment. Support is coming at 1.0440 and more at 1.01. Strong resistance is seen at 1.0760-1.0830.

audusd_14thseptember_2012.jpg

Regards,

Marco
 
Hello,
We have seen a bit more of a two way market this week so far in comparison to the one way traffic for the last two weeks. Stocks saw a bit of profit taking and USD gained a bit on some profit taking but also on some worries about some tension in the middle east and China/Japan. EUR/USD tested the 1.3000 level today and looked quite vulnerable to break through that level. Better US housing numbers sparked some risk-on again and EUR/USD bounced back to 1.3060. I still see a test of 1.2930 coming before it will see the next stronger push to the upside-maybe even 1.2830. The daily chart just begun to get off the overbought conditions so there is still plenty of room for further retracements before the major trend continues. A move above 1.3090 would bring bulls back into control though.

Yesterday I was looking for short only in the EUR/USD. I planned to get in early and to add on the way down. The first attempt with ¼ size got stopped out with some weird spike for -21 pips. The second attempt went a bit better. I added two more positions and had a ¾ position when momentum seems a bit run out of steam. In the end I closed for +19,+18 and -5 pips. Overall a slightly positive morning but I was hoping for more. I had initially a 1.3030 target in mind which got hit in the US session.

That 1.3030 proved to be a good support level ( 100 hourly EMA) and the pair bounced higher off the level. EUR/USD was trading above the MAs and the daily pivot when I came into the room and I was looking for a retrace to the 15min 20 EMA to get long. The pair behaved as predicted and retraced to the EMA. I went long ¼ size with a 20 pip SL at 1.3060. The pair respected the EMA and went a bit higher which was giving me the opportunity to put the SL to BE. I did not really having a good feeling about this trade and liked the downside actually better. This was just a technical long. I took 15 pips and stand aside. That exit proved to be exactly right since that 1.3075 level was the high on the rebound.

eurusd_19thseptember_20121.jpg

Regards,
Marco
 
Hello,
It was looking like that we could see a bit of more retraces in GBP/USD and EUR/USD but risk-on came back into the market on the last two trading days of the week. Stocks and Gold also got well supported and the USD was looking weak again. One thing to note is that we see extended ranges as expected and volatility is finally picking up.
On Thursday things looked a bit rough for the GBP/USD in the European session though. Cable was posting a new low after some weaker Chinese PMI data during the Asia session and I was patiently waiting for a retrace to the 30min 20 EMA to take a short. I was looking for a move to 1.6135 which was some former resistance. I got en entry and the price went immediately down after my entry. I decided to put the SL to BE. The trade got stopped out at BE and then went down right afterwards again. In the end we did not get anywhere near my target and the price reversed in the direction of the main trend.

I did not want to fight the trend on Friday and was actually looking for a long around 1.6235-30 when I came into the room. We saw risk-of coming into the market though and I hesitated. The downside momentum was a bit too strong for my taste to take that long. Cable managed to bounce off that level and I simple missed the entry. We saw a test of the 1.6300 Daily resistance level pretty quickly and I decided to take a short on the first test of this level. Again the trade went a few pips in my direction immediately and I put the SL to BE. And like on Thursday the trade got stopped out at BE before the pair eventually moved to the downside. Since the pair is still pretty overbought on daily basis and we hit the daily resistance level Cable might have a hard time to push higher next week. Nevertheless the GBP was so strong lately that I also don’t want to short it until I see some prove that the trend might reverse.

gbpusd_21thseptember_20121.jpg

EUR/USD came btw down to the mentioned 1.2930 level in the prev. post before going higher again. It remains to be seen if we see now a test of the 1.2830 zone before 1.3270. Nevertheless as I write in the prev. posts I expect a more up and down price action now with increases volatility since Bulls and Bears have to fight it out now and test the important support/resistance levels.

Regards,
Marco
 
Back
Top