NPBFX - making money with us since 1996!

Intel Corp.: technical analysis 02.02.2024

Good afternoon, dear forum visitors!

NPBFX offers the latest release of analytics on Intel Corp. for a better understanding of the current market situation and more efficient trading.

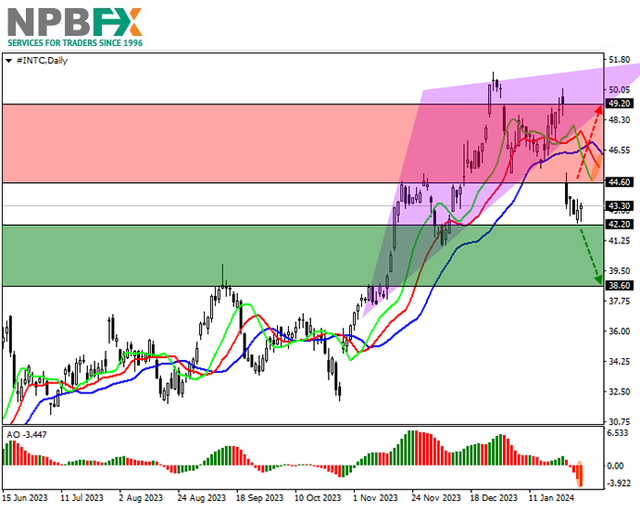
Shares of Intel Corp., a global giant in the development and sale of electronic devices and computer components, are trading in a corrective trend at 43.00.

On the daily chart, the price is responding to a reversal signal from the Head and shoulders pattern with the Neckline at 45.00.

On the four-hour chart, the likelihood of a decline is supported by the recent price gap of 49.20–44.60, and consolidation below the local low of 42.00 will allow the quotes to reach the area of 38.00. On the other hand, the asset may begin to work out the gap, rising to 49.00.

Technical indicators keep a sell signal: the EMA fluctuation range on the Alligator indicator is actively expanding downwards, and the AO histogram is forming corrective bars in the sale zone.

intc-02022024-2.png


Trading tips

Short positions may be opened after the price declines and consolidates below 42.20 with the target at 38.60 and stop loss 44.00. Implementation period: 7 days or more.

Long positions may be opened after the price rises and consolidates above 44.60 with the target at 49.20. Stop loss – 42.00.

Use more opportunities of the NPBFX analytical portal: weekly FOREX forecast

You can learn more about the current situation and get acquainted with the weekly analytical forecast in the "Video reviews" section on the NPBFX portal. Weekly video reviews contain trends, key levels, trading recommendations for such popular instruments as GBP/USD, EUR/USD, USD/CHF, AUD/USD. In order to get free and unlimited access to video forecast and other useful instruments on the portal, you need to register on the NPBFX website.

If you have any questions about trading instruments, you can always ask an analyst in the online chat on the portal and get a free consultation of an experienced specialist.

Use the current recommendations of analysts on Intel Corp. and trade efficiently with NPBFX.
 
Netflix Inc.: technical analysis 05.02.2024

Good afternoon, dear forum visitors!

NPBFX offers the latest release of analytics on Netflix Inc. for a better understanding of the current market situation and more efficient trading.

Shares of Netflix Inc., an American entertainment company, as well as a streaming service for films and TV series, are trading within a corrective trend at 564.00.

On the daily chart, global upward dynamics continue, and the price, retreated from the year’s high of 579.00, is preparing to retest it.

On the four-hour chart, the growth potential is confirmed by the formation of a price gap of 537.00–490.00. However, despite the local decline, no markers indicate the beginning of a reversal, and only consolidation below the end of the gap at 537.00 will allow the quotes to work it out.

Technical indicators hold a buy signal: fast EMAs on the Alligator indicator are above the signal line, expanding the range of fluctuations, and the AO histogram forms corrective bars in the buy zone.

NFLX-050224-22.png


Trading tips

Long positions may be opened after the price rises and consolidates above 579.00 with the target at 621.00. Stop loss – 570.00. Implementation period: 7 days or more.

Short positions may be opened after the price declines and consolidates below 550.00 with the target at 497.00. Stop loss – 560.00.

Use more opportunities of the NPBFX analytical portal: analytics

You can find more actual analytical reviews on other popular currency pairs, metals and CFDs on the NPBFX online portal. Daily analytics with charts, current market prognoses and trading scenarios in the Feed section are available. Get free and unlimited access to the online portal after registering on the official website of NPBFX Company.

You can read a Beginner's guide to FOREX Trading online or download it free of charge from the NPBFX analytical portal in the "Education" section. In order to get unlimited access to the E-book and other useful instruments on the portal, you need to register on the NPBFX website.

If you have any questions about trading instruments, you can always ask an analyst in the online chat on the portal and get a free consultation of an experienced specialist.

Use the current recommendations of analysts on Netflix Inc. and trade efficiently with NPBFX.
 
Pfizer Inc.: technical analysis 07.02.2024

Good afternoon, dear forum visitors!

NPBFX offers the latest release of analytics on Pfizer Inc. for a better understanding of the current market situation and more efficient trading.

Shares of Pfizer Inc., the largest American pharmaceutical company, are correcting at 27.00.

On the daily chart, the price is kept within the global downward channel with dynamic boundaries of 28.00–23.00, approaching the resistance line.

On the four-hour chart, previous attempts to overcome the resistance levels of 29.80, 28.80, and 28.30 were unsuccessful, against which a reversal and the formation of a downward wave inside the channel with a global target around 23.00, below the recent years’ low, is possible.

Technical indicators maintain a stable sell signal: fast EMA on the Alligator indicator are below the signal line, and the AO histogram forms downward bars, falling in the sales zone and ignoring local corrections.

PFE-072024-22.png


Trading tips

Short positions may be opened after the price declines and consolidates below 26.40 with the target at 23.30. Stop loss – 27.50. Implementation period: 7 days or more.

Long positions may be opened after the price rises and consolidates above 28.30 with the target at 31.20. Stop loss – 27.50.

Use more opportunities of the NPBFX analytical portal: E-book

If you just recently started to be interested in trading on FOREX and would like to deepen your knowledge, an electronic Beginner's Guide to FOREX Trading will be an excellent helper for you here. The book consists of 5 chapters and reflects fundamental concepts of the foreign exchange market to start successful trading. From the main chapters of the E-book you can learn about the concepts and history of FOREX, currencies and trend lines, technical indicators, types of orders, trading on news, psychology of trading, risk management and much more.

You can read a Beginner's guide to FOREX Trading online or download it free of charge from the NPBFX analytical portal in the "Education" section. In order to get unlimited access to the E-book and other useful instruments on the portal, you need to register on the NPBFX website.

If you have any questions about trading instruments, you can always ask an analyst in the online chat on the portal and get a free consultation of an experienced specialist.

Use the current recommendations of analysts on Pfizer Inc. and trade efficiently with NPBFX.
 
NZD/USD: the New Zealand dollar is actively increasing in value during Friday trading 09.02.2024

Good afternoon, dear forum visitors!

NPBFX offers the latest release of analytics on NZD/USD for a better understanding of the current market situation and more efficient trading.

Current trend

The NZD/USD pair shows a fairly active growth, updating local highs from February 2. The instrument is testing 0.6120 for a breakout, while the fundamental picture on the market remains virtually unchanged. The day before, the position of the American currency again received support from comments from representatives of the US Federal Reserve, who, following the Chair of the regulator Jerome Powell, spoke in favor of a slower increase in borrowing costs. Against this background, investors assess the scenario with an interest rate adjustment of -25 basis points in March as unlikely (no more than 20.0%) and are focusing on the May meeting of the Fed.

In addition, the US dollar received some support the day before from statistics on jobless claims. For the week ended February 2, Initial Jobless Claims decreased from 227.0 thousand to 218.0 thousand, with a forecast of 220.0 thousand, and Continuing Jobless Claims went down from 1.894 million to 1.871 million, while analysts expected 1.878 million.

In turn, the position of the New Zealand currency came under pressure yesterday after the publication of January inflation statistics in China: the Consumer Price Index in annual terms lost 0.8% after -0.3% in the previous month, with preliminary estimates of -0.5%, and in monthly terms the indicator increased by 0.3%, accelerating from 0.1%.

Support and resistance

Bollinger Bands in D1 chart demonstrate flat dynamics. The price range is slightly narrowing, reflecting the ambiguous dynamics of trading in the short term. MACD indicator is growing, while preserving a rather stable buy signal (located above the signal line). Stochastic grows more steadily but is rapidly approaching its highs, which reflects risks of the overbought instrument in the ultra-short term.

Resistance levels: 0.6130, 0.6155, 0.6192, 0.6221.
Support levels: 0.6100, 0.6060, 0.6030, 0.6000.

NZDUSD090224-33.png


NZDUSD090224-333.png


Trading tips

Long positions can be opened after a breakout of 0.6130 with the target of 0.6192. Stop-loss — 0.6100. Implementation time: 2-3 days.

A rebound from 0.6130 as from resistance, followed by a breakdown of 0.6100 may become a signal for opening of new short positions with the target at 0.6030. Stop-loss — 0.6130.

Use more opportunities of the NPBFX analytical portal: economic calendar

Be ready for any market changes through global events using the economic calendar on the NPBFX portal. The calendar contains all the most important events of the world economy and prognoses for them. In order to get free and unlimited access to the economic calendar and other useful instruments on the portal, you need to pass a one-time registration on the NPBFX website.

If you have any questions about trading instruments, you can always ask an analyst in the online chat on the portal and get a free consultation of an experienced specialist.

Use the current recommendations of analysts on NZD/USD and trade efficiently with NPBFX.
 
PayPal Holdings Inc.: technical analysis 12.02.2024

Good afternoon, dear forum visitors!

NPBFX offers the latest release of analytics on PayPal Holdings Inc. for a better understanding of the current market situation and more efficient trading.

Shares of PayPal Holdings Inc., an American debit payment system, are correcting at 59.00.

On the daily chart, the price tries to consolidate below the support line of the ascending corridor with dynamic boundaries of 67.00–59.00.

On the four-hour chart, the quotes left the range with a price gap of 57.10–63.20 and are now trying to work it out. The likelihood is extremely low since the asset has already reached the support line of the recently passed channel at 59.00 and may reverse.

Technical indicators gave a sell signal: fast EMA on the Alligator indicator crossed the signal line downwards, and the AO histogram formed downward bars and entered the sale zone.

PYPL-120224-22.png


Trading tips

Short positions may be opened after the price declines and consolidates below 56.20 with the target at 50.40. Stop loss – 58.00. Implementation period: 7 days or more.

Long positions may be opened after the price rises and consolidates above 61.00 with the target at 68.00. Stop loss – 59.00.

Use more opportunities of the NPBFX analytical portal: analytics

You can find more actual analytical reviews on other popular currency pairs, metals and CFDs on the NPBFX online portal. Daily analytics with charts, current market prognoses and trading scenarios in the Feed section are available. Get free and unlimited access to the online portal after registering on the official website of NPBFX Company.

If you have any questions about trading instruments, you can always ask an analyst in the online chat on the portal and get a free consultation of an experienced specialist.

Use the current recommendations of analysts on PayPal Holdings Inc. and trade efficiently with NPBFX.
 
General Electric Co.: technical analysis 14.02.2024

Good afternoon, dear forum visitors!

NPBFX offers the latest release of analytics on General Electric Co. for a better understanding of the current market situation and more efficient trading.

Shares of General Electric Co., an American diversified corporation, continue to rise globally, trading at 142.00.

On the daily chart, the price is moving in an upward trend along the resistance line of the local channel with dynamic boundaries of 142.00–135.00.

On the four-hour chart, the quotes have consolidated above 137.00 (the initial trend of 61.8% Fibonacci extension) and are heading towards the resistance level of 156.00 (the basic trend of 100.0% Fibonacci extension).

Technical indicators hold a buy signal: fast EMAs on the Alligator indicator are above the signal line, expanding the range of fluctuations, and the AO histogram forms corrective bars in the buy zone.

GE-140224-22.png


Trading tips

Long positions may be opened after the price rises and consolidates above 144.00 with the target at 156.20. Stop loss – 140.00. Implementation period: 7 days or more.

Short positions may be opened after the price declines and consolidates below 137.00 with the target at 124.00. Stop loss – 140.00.

Use more opportunities of the NPBFX analytical portal: E-book

If you just recently started to be interested in trading on FOREX and would like to deepen your knowledge, an electronic Beginner's Guide to FOREX Trading will be an excellent helper for you here. The book consists of 5 chapters and reflects fundamental concepts of the foreign exchange market to start successful trading. From the main chapters of the E-book you can learn about the concepts and history of FOREX, currencies and trend lines, technical indicators, types of orders, trading on news, psychology of trading, risk management and much more.

You can read a Beginner's guide to FOREX Trading online or download it free of charge from the NPBFX analytical portal in the "Education" section. In order to get unlimited access to the E-book and other useful instruments on the portal, you need to register on the NPBFX website.

If you have any questions about trading instruments, you can always ask an analyst in the online chat on the portal and get a free consultation of an experienced specialist.

Use the current recommendations of analysts on General Electric Co. and trade efficiently with NPBFX.
 
Johnson & Johnson: technical analysis 16.02.2024

Good afternoon, dear forum visitors!

NPBFX offers the latest release of analytics on Johnson & Johnson for a better understanding of the current market situation and more efficient trading.

Shares of Johnson & Johnson, one of the leading retail holdings, are trading at 157.00.

On the daily chart, the price is correcting, approaching the support line of the ascending channel with dynamic boundaries of 155.00–164.00.

On the four-hour chart, despite the decline, the quotes are above the base correction level of 38.2% at Fibonacci 156.80, which increases the likelihood of an early reversal and further growth. Consolidation above the key resistance level 160.40 (intermediate correction of 50.0% Fibonacci) will be a signal to continue the upward dynamics.

Technical indicators are weakening the sell signal: the EMA fluctuation range on the Alligator indicator is narrowing, and the AO histogram is forming ascending bars below the transition level.

JNJ-160224-22.png


Trading tips

Long positions may be opened after the price rises and consolidates above 160.40 with the target at 164.00. Stop loss – 158.00. Implementation period: 7 days or more.

Short positions may be opened after the price declines and consolidates below 156.80 with the target at 152.30. Stop loss – 159.00.

Use more opportunities of the NPBFX analytical portal: weekly FOREX forecast

You can learn more about the current situation and get acquainted with the weekly analytical forecast in the "Video reviews" section on the NPBFX portal. Weekly video reviews contain trends, key levels, trading recommendations for such popular instruments as GBP/USD, EUR/USD, USD/CHF, AUD/USD. In order to get free and unlimited access to video forecast and other useful instruments on the portal, you need to register on the NPBFX website.

If you have any questions about trading instruments, you can always ask an analyst in the online chat on the portal and get a free consultation of an experienced specialist.

Use the current recommendations of analysts on Johnson & Johnson and trade efficiently with NPBFX.
 
Cisco Systems Inc.: technical analysis 19.02.2024

Good afternoon, dear forum visitors!

NPBFX offers the latest release of analytics on Cisco Systems Inc. for a better understanding of the current market situation and more efficient trading.

Shares of Cisco Systems Inc., an American manufacturer and supplier of network equipment for large holdings and telecommunications companies, are trading at 48.00.

On the daily chart, the price continues to work out the recent ascending channel with dynamic boundaries of 53.00–50.80.

On the four-hour chart, it can be seen that the potential for increasing the decline of the trading instrument remains, which is confirmed by the price being below the local support level of 49.00. The current target is last year’s low of 46.20, which the quotes may reach as early as next week.

Technical indicators are holding a sell signal: fast EMA on the Alligator indicator are below the signal line, and the AO oscillator histogram is forming corrective bars in the sell zone.

CSCO190224-11.png


Trading tips

Short positions may be opened after the consolidation below the support level of 48.00 with the target at 45.70. Stop loss – 49.00. Implementation period: 7 days or more.

Long positions may be opened after the consolidation above the resistance level of 49.30 with the target at 52.00. Stop loss – 48.50.

Use more opportunities of the NPBFX analytical portal: analytics

You can find more actual analytical reviews on other popular currency pairs, metals and CFDs on the NPBFX online portal. Daily analytics with charts, current market prognoses and trading scenarios in the Feed section are available. Get free and unlimited access to the online portal after registering on the official website of NPBFX Company.

If you have any questions about trading instruments, you can always ask an analyst in the online chat on the portal and get a free consultation of an experienced specialist.

Use the current recommendations of analysts on Cisco Systems Inc. and trade efficiently with NPBFX.
 
Walmart Inc.: technical analysis 21.02.2024

Good afternoon, dear forum visitors!

NPBFX offers the latest release of analytics on Walmart Inc. for a better understanding of the current market situation and more efficient trading.

Shares of Walmart Inc., an American company that operates the largest wholesale and retail chain, are correcting at 174.00.

On the daily chart, the price is moving in an upward trend and yesterday, it renewed its year’s high of 171.50.

On the four-hour chart, the quotes are trying to work out yesterday’s price gap of 178.50–170.40. Despite the gap, trading volumes indicate a large number of long positions, so the price may reach the local high of 181.00 again.

Technical indicators maintain a stable buy signal: fast EMA on the Alligator indicator are above the signal line and are actively moving away from it, and the AO histogram is forming ascending bars in the positive zone.

WMT210224-22.png


Trading tips

Long positions may be opened after the price rises and consolidates above 178.50 with the target at 181.00. Stop loss – 177.00. Implementation period: 7 days or more.

Short positions may be opened after the price declines and consolidates below 174.60 with the target at 170.40. Stop loss – 176.00.

Use more opportunities of the NPBFX analytical portal: E-book

If you just recently started to be interested in trading on FOREX and would like to deepen your knowledge, an electronic Beginner's Guide to FOREX Trading will be an excellent helper for you here. The book consists of 5 chapters and reflects fundamental concepts of the foreign exchange market to start successful trading. From the main chapters of the E-book you can learn about the concepts and history of FOREX, currencies and trend lines, technical indicators, types of orders, trading on news, psychology of trading, risk management and much more.

You can read a Beginner's guide to FOREX Trading online or download it free of charge from the NPBFX analytical portal in the "Education" section. In order to get unlimited access to the E-book and other useful instruments on the portal, you need to register on the NPBFX website.

If you have any questions about trading instruments, you can always ask an analyst in the online chat on the portal and get a free consultation of an experienced specialist.

Use the current recommendations of analysts on Walmart Inc. and trade efficiently with NPBFX.
 
Visa Inc.: technical analysis 23.02.2024

Good afternoon, dear forum visitors!

NPBFX offers the latest release of analytics on Visa Inc. for a better understanding of the current market situation and more efficient trading.

Shares of Visa Inc., the largest American multinational company providing payment transaction services, are trading at 283.00.

On the daily chart, the price is moving within the global ascending channel with dynamic boundaries of 286.00–268.00, trying to consolidate above the resistance line.

On the four-hour chart yesterday, the quotes broke through the previous year’s high of 280.00, the last obstacle before reaching the resistance level of 290.00. There are practically no signs of a reversal now but if the asset consolidates below 280.00, a local correction to the support level of 270.00 is expected.

Technical indicators are strengthening the buy signal: the EMA fluctuation range on the Alligator indicator is expanding upward, and the AO histogram is forming upward bars above the transition level.

V-230224-22.png


Trading tips

Long positions may be opened after the price rises and consolidates above 286.50 with the target at 298.00. Stop loss – 284.00. Implementation period: 7 days or more.

Short positions may be opened after the price declines and consolidates below 280.80 with the target at 267.40. Stop loss – 285.00.

Use more opportunities of the NPBFX analytical portal: weekly FOREX forecast

You can learn more about the current situation and get acquainted with the weekly analytical forecast in the "Video reviews" section on the NPBFX portal. Weekly video reviews contain trends, key levels, trading recommendations for such popular instruments as GBP/USD, EUR/USD, USD/CHF, AUD/USD. In order to get free and unlimited access to video forecast and other useful instruments on the portal, you need to register on the NPBFX website.

If you have any questions about trading instruments, you can always ask an analyst in the online chat on the portal and get a free consultation of an experienced specialist.

Use the current recommendations of analysts on Visa Inc. and trade efficiently with NPBFX.
 
Back
Top