NPBFX - making money with us since 1996!

Hewlett-Packard Co.: technical analysis 26.02.2024

Good afternoon, dear forum visitors!

NPBFX offers the latest release of analytics on Hewlett-Packard Co. for a better understanding of the current market situation and more efficient trading.

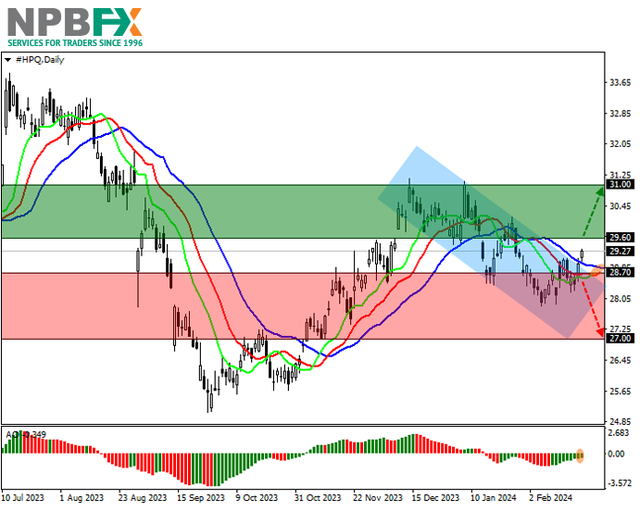
Shares of Hewlett-Packard Co., the American information technology giant, are trading at 29.20.

On the daily chart, the price is correcting, trying to consolidate above the resistance line of the local downward channel of 29.00–28.00.

On the four-hour chart, the downward range can work as a Flag continuation trend pattern. For its implementation, the quotes should consolidate above 29.00. If successful, the next resistance level will be the high of 30.00 and then the global target of 31.00.

Technical indicators are weakening the sell signal: fast EMAs on the Alligator indicator are approaching the signal line, and the AO histogram is forming corrective bars, approaching the transition level.

HPQ-260224-22.png


Trading tips

Long positions may be opened after the price rises and consolidates above 29.60 with the target at 31.00. Stop loss – 29.00. Implementation period: 7 days or more.

Short positions may be opened after the price declines and consolidates below 28.70 with the target at 27.00. Stop loss – 29.20.

Use more opportunities of the NPBFX analytical portal: analytics

You can find more actual analytical reviews on other popular currency pairs, metals and CFDs on the NPBFX online portal. Daily analytics with charts, current market prognoses and trading scenarios in the Feed section are available. Get free and unlimited access to the online portal after registering on the official website of NPBFX Company.

If you have any questions about trading instruments, you can always ask an analyst in the online chat on the portal and get a free consultation of an experienced specialist.

Use the current recommendations of analysts on Hewlett-Packard Co. and trade efficiently with NPBFX.
 
Starbucks Corp.: technical analysis 28.02.2024

Good afternoon, dear forum visitors!

NPBFX offers the latest release of analytics on Starbucks Corp. for a better understanding of the current market situation and more efficient trading.

Shares of Starbucks Corp., one of the largest companies that owns the coffee shop chain of the same name, are moving in a corrective trend at 94.00.

On the daily chart, the price is holding near the lower border of the global ascending channel 110.00–92.00, trying to start a growth wave.

On the four-hour chart, the quotes have been trading around the support line for a long time, having tested it at 91.80, 92.00, and 92.90, and if they consolidate above the local high of 96.00, a correction with a global target of 100.00 is expected.

Technical indicators gave a poor buy signal: fast EMAs on the Alligator indicator are moving away from the signal line, expanding the range of fluctuations, and the AO histogram is forming ascending bars in the buy zone.

SBUX-280224-22.png


Trading tips

Long positions may be opened after the price rises and consolidates above 95.50, with the target at 99.00. Stop loss – 94.00. Implementation period: 7 days or more.

Short positions may be opened after the price declines and consolidates below 93.00, with the target at 89.20. Stop loss – 95.00.

Use more opportunities of the NPBFX analytical portal: E-book

If you just recently started to be interested in trading on FOREX and would like to deepen your knowledge, an electronic Beginner's Guide to FOREX Trading will be an excellent helper for you here. The book consists of 5 chapters and reflects fundamental concepts of the foreign exchange market to start successful trading. From the main chapters of the E-book you can learn about the concepts and history of FOREX, currencies and trend lines, technical indicators, types of orders, trading on news, psychology of trading, risk management and much more.

You can read a Beginner's guide to FOREX Trading online or download it free of charge from the NPBFX analytical portal in the "Education" section. In order to get unlimited access to the E-book and other useful instruments on the portal, you need to register on the NPBFX website.

If you have any questions about trading instruments, you can always ask an analyst in the online chat on the portal and get a free consultation of an experienced specialist.

Use the current recommendations of analysts on Starbucks Corp. and trade efficiently with NPBFX.
 
Bank of America Corp.: technical analysis 01.03.2024

Good afternoon, dear forum visitors!

NPBFX offers the latest release of analytics on Bank of America Corp. for a better understanding of the current market situation and more efficient trading.

Shares of Bank of America Corp., one of the largest banks and analytical agencies in the United States, are moving within the corrective trend at 34.00.

On the daily chart, the price is near the support line of the global ascending channel with dynamic boundaries of 37.00–33.00, preparing to continue growing.

On the four-hour chart, after reaching the channel support line of 33.40, the quotes reversed to growth to the nearest resistance level is the year’s high of 35.00, consolidation above which will allow the asset to reach the channel resistance line of 38.00.

Technical indicators have given a buy signal: fast EMA on the Alligator indicator are above the signal line, expanding the range of fluctuations, and the AO histogram is forming ascending bars above the transition level.

BAC010324-22.png


Trading tips

Long positions may be opened after the price rises and consolidates above 35.00, with the target at 37.60. Stop loss – 34.00. Implementation period: 7 days or more.

Short positions may be opened after the price declines and consolidates below 33.60, with the target at 31.30. Stop loss – 35.00.

Use more opportunities of the NPBFX analytical portal: weekly FOREX forecast

You can learn more about the current situation and get acquainted with the weekly analytical forecast in the "Video reviews" section on the NPBFX portal. Weekly video reviews contain trends, key levels, trading recommendations for such popular instruments as GBP/USD, EUR/USD, USD/CHF, AUD/USD. In order to get free and unlimited access to video forecast and other useful instruments on the portal, you need to register on the NPBFX website.

If you have any questions about trading instruments, you can always ask an analyst in the online chat on the portal and get a free consultation of an experienced specialist.

Use the current recommendations of analysts on Bank of America Corp. and trade efficiently with NPBFX.
 
ExxonMobil Corp.: technical analysis 04.03.2024

Good afternoon, dear forum visitors!

NPBFX offers the latest release of analytics on ExxonMobil Corp. for a better understanding of the current market situation and more efficient trading.

Shares of ExxonMobil Corp., an American oil company, are trading at 106.00.

A global corrective trend is forming on the daily chart, and the price is slightly above the base Fibonacci retracement level of 38.2% at 105.30.

On the four-hour chart, the quotes can reach the intermediate Fibonacci ratio of 50.0% at 108.20 and the full Fibonacci retracement level of 61.8% at 111.10. In the event of a reversal and consolidation of the asset below the base Fibonacci retracement level of 38.2% at 105.30, negative dynamics may develop to the initial Fibonacci retracement level of 23.6% at 101.60.

Technical indicators are holding a buy signal: fast EMA on the Alligator indicator are above the signal line, and the AO histogram is forming corrective bars above the transition level.

XOM-040324-11.png


Trading tips

Long positions may be opened after the price rises and consolidates above 108.20, with the target at 111.10. Stop loss – 106.00. Implementation period: 7 days or more.

Short positions may be opened after the price declines and consolidates below 105.30, with the target at 101.60. Stop loss – 107.00.

Use more opportunities of the NPBFX analytical portal: analytics

You can find more actual analytical reviews on other popular currency pairs, metals and CFDs on the NPBFX online portal. Daily analytics with charts, current market prognoses and trading scenarios in the Feed section are available. Get free and unlimited access to the online portal after registering on the official website of NPBFX Company.

If you have any questions about trading instruments, you can always ask an analyst in the online chat on the portal and get a free consultation of an experienced specialist.

Use the current recommendations of analysts on ExxonMobil Corp. and trade efficiently with NPBFX.
 
Visa Inc.: technical analysis 06.03.2024

Good afternoon, dear forum visitors!

NPBFX offers the latest release of analytics on Visa Inc. for a better understanding of the current market situation and more efficient trading.

Shares of Visa Inc., the largest American multinational company providing payment transaction services, are trading at 279.00.

On the daily chart, the price is moving within a global ascending channel with dynamic boundaries of 286.00–272.00 and dropped to the support line yesterday.

On the four-hour chart, the nearest support level is a low of 274.00, consolidation below which will allow the quotes to leave the range. The “bearish divergence” signal from the AO indicator confirms a further decline. However, in the event of a reversal, the key resistance level will be the year’s high of 286.00.

Technical indicators are weakening the buy signal: the EMA fluctuation range on the Alligator indicator is narrowing, and the AO histogram is forming downward bars, approaching the transition level.

V-060324-22.png


Trading tips

Short positions may be opened after the price declines and consolidates below 274.00, with the target at 262.00. Stop loss – 280.00. Implementation period: 7 days or more.

Long positions may be opened after the price rises and consolidates above 286.00, with the target at 297.00. Stop loss is 284.00.

Use more opportunities of the NPBFX analytical portal: E-book

If you just recently started to be interested in trading on FOREX and would like to deepen your knowledge, an electronic Beginner's Guide to FOREX Trading will be an excellent helper for you here. The book consists of 5 chapters and reflects fundamental concepts of the foreign exchange market to start successful trading. From the main chapters of the E-book you can learn about the concepts and history of FOREX, currencies and trend lines, technical indicators, types of orders, trading on news, psychology of trading, risk management and much more.

You can read a Beginner's guide to FOREX Trading online or download it free of charge from the NPBFX analytical portal in the "Education" section. In order to get unlimited access to the E-book and other useful instruments on the portal, you need to register on the NPBFX website.

If you have any questions about trading instruments, you can always ask an analyst in the online chat on the portal and get a free consultation of an experienced specialist.

Use the current recommendations of analysts on Visa Inc. and trade efficiently with NPBFX.
 
AUD/USD: the Australian dollar continues the "bullish" momentum 08.03.2024

Good afternoon, dear forum visitors!

NPBFX offers the latest release of analytics on AUD/USD for a better understanding of the current market situation and more efficient trading.

Current trend

The AUD/USD pair is showing moderate growth, developing the "bullish" momentum formed last Wednesday, when quotes managed to retreat from the local lows of February 14. The instrument is testing 0.6630 for a breakout, and the "bulls" are updating local highs from January 16.

The Australian dollar, in addition to the further weakening of the American currency, was supported by optimistic statistics from China published on Thursday: Export volumes in February added 7.1% after an increase of 2.3% in the previous month, while analysts expected 1.9% and Imports accelerated from 0.2% to 3.5%, with a forecast of 1.5%. Such a noticeable increase in exports led to an increase in the trade surplus from 75.34 billion US dollars to 125.16 billion US dollars, with preliminary estimates of 103.7 billion US dollars.

The day before, investors assessed February data on Australian foreign trade: Export volumes adjusted from 1.5% to 1.6%, while Imports, on the contrary, slowed sharply from 4.8% to 1.3%. The trade surplus also rose from 10.74 billion Australian dollars to 11.03 billion Australian dollars, but fell short of expectations of 11.5 billion Australian dollars. Positive dynamics contribute to the strengthening of the national economy, without excluding the risks of accelerating inflation rates and the Reserve Bank of Australia (RBA) maintaining borrowing costs at peak values for a longer period of time.

Today, investors will focus on the publication of the February labor market report, which may affect the final decision of the US Federal Reserve on interest rates.

Support and resistance

Bollinger Bands in D1 chart show moderate growth. The price range is expanding but it fails to conform to the surge of "bullish" sentiments at the moment. MACD grows, preserving a stable buy signal (located above the signal line). The indicator is also trying to consolidate above the zero level. Stochastic retains an uptrend, but is located in close proximity to its highs, which points to the risk of overbought Australian dollar in the ultra-short term.

Resistance levels: 0.6630, 0.6662, 0.6700, 0.6750.
Support levels: 0.6600, 0.6578, 0.6551, 0.6524.

audusd-08032024-55.png


audusd-08032024-66.png


Trading tips

Long positions can be opened after a breakout of 0.6630 with the target of 0.6700. Stop-loss — 0.6600. Implementation time: 1-2 days.

A rebound from 0.6630 as from resistance, followed by a breakdown of 0.6600 may become a signal for opening of new short positions with the target at 0.6524. Stop-loss — 0.6630.

Use more opportunities of the NPBFX analytical portal: economic calendar

Be ready for any market changes through global events using the economic calendar on the NPBFX portal. The calendar contains all the most important events of the world economy and prognoses for them. In order to get free and unlimited access to the economic calendar and other useful instruments on the portal, you need to pass a one-time registration on the NPBFX website.

If you have any questions about trading instruments, you can always ask an analyst in the online chat on the portal and get a free consultation of an experienced specialist.

Use the current recommendations of analysts on AUD/USD and trade efficiently with NPBFX.
 
McDonald’s Corp.: technical analysis 11.03.2024

Good afternoon, dear forum visitors!

NPBFX offers the latest release of analytics on McDonald’s Corp. for a better understanding of the current market situation and more efficient trading.

Shares of McDonald’s Corp., the largest fast food chain, are correcting in the local trend at 292.00.

On the daily chart, the price is moving within the global Diamond pattern with boundaries of 298.00–286.00, preparing for implementation and exit.

On the four-hour chart, the quotes are at an equal distance from both boundaries. As it is at the top of the previous uptrend, the price may break the support level of 288.00 and decline. However, in case of growth and breakout of 295.00, the asset may reach a year’s high of 302.00.

Technical indicators maintain a sell signal, expanding the range of fluctuations: fast EMA on the Alligator indicator move away from the signal line, and the AO histogram forms corrective bars below the transition level.

MCD110324-22.png


Trading tips

Short positions may be opened after the price declines and consolidates below 289.00, with the target at 281.60. Stop loss – 293.00. Implementation period: 7 days or more.

Long positions may be opened after the price rises and consolidates above 295.00, with the target at 302.00. Stop loss – 292.00.

Use more opportunities of the NPBFX analytical portal: weekly FOREX forecast

You can learn more about the current situation and get acquainted with the weekly analytical forecast in the "Video reviews" section on the NPBFX portal. Weekly video reviews contain trends, key levels, trading recommendations for such popular instruments as GBP/USD, EUR/USD, USD/CHF, AUD/USD. In order to get free and unlimited access to video forecast and other useful instruments on the portal, you need to register on the NPBFX website.

If you have any questions about trading instruments, you can always ask an analyst in the online chat on the portal and get a free consultation of an experienced specialist.

Use the current recommendations of analysts on McDonald’s Corp. and trade efficiently with NPBFX.
 
Tesla Inc.: technical analysis 13.03.2024

Good afternoon, dear forum visitors!

NPBFX offers the latest release of analytics on Tesla Inc. for a better understanding of the current market situation and more efficient trading.

Shares of Tesla Inc., a leading manufacturer of electric cars, continue their global correction, trading at 177.00.

On the daily chart, the price is held within the downward channel 227.00–157.00, heading towards the support line.

On the four-hour chart, the consolidation below the previous local low of 180.00 and the beginning of a global Flag trend continuation pattern with an implementation level of 185.00 confirm the decline in the quotes.

Technical indicators are strengthening the sell signal: fast EMAs on the Alligator indicator are moving away from the signal line, and the AO histogram is forming downward bars in the sell zone.

TSLA-130324-22.png


Trading tips

Short positions may be opened after the price declines and consolidates below 172.00, with the target at 144.00. Stop loss – 185.00. Implementation period: 7 days or more.

Long positions may be opened after the price rises and consolidates above 185.00, with the target at 205.00. Stop loss – 179.00.

Use more opportunities of the NPBFX analytical portal: analytics

You can find more actual analytical reviews on other popular currency pairs, metals and CFDs on the NPBFX online portal. Daily analytics with charts, current market prognoses and trading scenarios in the Feed section are available. Get free and unlimited access to the online portal after registering on the official website of NPBFX Company.

If you have any questions about trading instruments, you can always ask an analyst in the online chat on the portal and get a free consultation of an experienced specialist.

Use the current recommendations of analysts on Tesla Inc. and trade efficiently with NPBFX.
 
Meta Platforms Inc.: technical analysis 15.03.2024

Good afternoon, dear forum visitors!

NPBFX offers the latest release of analytics on Meta Platforms Inc. for a better understanding of the current market situation and more efficient trading.

Shares of Meta Platforms Inc., an American multinational holding company that owns the technology conglomerate and the largest social network Facebook, are trading in a corrective trend at 491.00.

A global upward trend is forming on the daily chart, within which the price unsuccessfully tried to leave the ascending channel 530.00–430.00.

On the four-hour chart, it was accompanied by small trading volumes, and after the completion of the local price gap of 494.00–504.00, the quotes reversed upwards again. To maintain positive dynamics, the asset needs to consolidate above the current high of 515.00. Otherwise, the correction will continue, and after overcoming 475.00, a downward trend may develop.

Technical indicators are holding a buy signal: fast EMA on the Alligator indicator are above the signal line, and the AO histogram is forming corrective bars in the buy zone.

META-150324-11.png


Trading tips

Long positions may be opened after the price rises and consolidates above 515.00, with the target at 558.00. Stop loss – 500.00. Implementation period: 7 days or more.

Short positions may be opened after the price declines and consolidates below 476.00, with the target at 433.00. Stop loss – 490.00.

Use more opportunities of the NPBFX analytical portal: economic calendar

Be ready for any market changes through global events using the economic calendar on the NPBFX portal. The calendar contains all the most important events of the world economy and prognoses for them. In order to get free and unlimited access to the economic calendar and other useful instruments on the portal, you need to pass a one-time registration on the NPBFX website.

If you have any questions about trading instruments, you can always ask an analyst in the online chat on the portal and get a free consultation of an experienced specialist.

Use the current recommendations of analysts on Meta Platforms Inc. and trade efficiently with NPBFX.
 
XAU/USD: precious metal quotes retreat from record highs 18.03.2024

Good afternoon, dear forum visitors!

NPBFX offers the latest release of analytics on XAU/USD for a better understanding of the current market situation and more efficient trading.

Current trend

The XAU/USD pair is developing the "bearish" momentum formed last week: the instrument is testing 2145.00 for a breakdown, updating the local lows of March 7.

Quotes are being pressured by the upcoming meetings of global central banks this week, from which they are not expected to take steps towards easing monetary conditions. Moreover, the Bank of Japan could announce a historic rise in borrowing costs tomorrow, ending an eight-year period of negative interest rates during which it battled the effects of deflation. In turn, the US Federal Reserve and the Bank of England are unlikely to change the parameters of monetary policy, but analysts fear that both regulators will signal in favor of a more balanced approach before switching to "dovish" rhetoric. However, forecasts still suggest that the American regulator will lower interest rates at least three times before the end of 2024.

Trading participants continue to evaluate macroeconomic statistics from the United States, published last Friday. The Consumer Confidence Index from the University of Michigan dropped from 76.9 points to 76.5 points in March, while analysts expected it to remain the same. Industrial Production volumes in February added 0.1% after -0.5% in the previous month, while experts expected zero dynamics, and Capacity Utilization remained at 78.3% against the forecast of 78.5%.

The correction in the gold contract market continues. According to the report of the US Commodity Futures Trading Commission (CFTC), last week the number of net speculative positions in precious metal increased to 201.6 thousand from 191.3 thousand a week earlier. The balance in positions secured by real money amounted to 190.374 thousand for the "bulls" versus 30.814 thousand for the "bears". Last week, buyers increased the number of contracts by 25.734 thousand, and sellers decreased it by 2.766 thousand, provoking new investors to continue buying.

Support and resistance

Bollinger Bands on the daily chart show a steady increase. The price range is narrowing, reflecting the emergence of ambiguous dynamics of trading in the short term. MACD is going down preserving a stable sell signal (located below the signal line). Stochastic shows similar dynamics; however, the indicator line is located close to its lows, indicating the risks of gold being oversold in the ultra-short term.

Resistance levels: 2164.68, 2179.85, 2195.12, 2215.00.
Support levels: 2150.00, 2134.09, 2120.00, 2100.00.

XAUUSD180324-33.png


XAUUSD180324-333.png


Trading tips

Short positions may be opened after a breakdown of 2134.09 with the target at 2100.00. Stop-loss — 2150.00. Implementation time: 2-3 days.

A rebound from 2134.09 as from support followed by a breakout of 2150.00 may become a signal for opening new long positions with the target at 2179.85. Stop-loss — 2134.09.

Use more opportunities of the NPBFX analytical portal: trading signals for commodities

How can a trader determine if it’s worth buying or selling XAU/USD now or better waiting for a more favorable period? Use trading signals for commodities from the top 10 technical indicators on the NPBFX portal and make the right decisions! All registered users have free and unlimited access to the minutely updated trading signals (MA10, BBands, Ichimoku, Stochastic, ZigZag, etc.) for Gold, Silver, Brent and WTI Crude oil.

If you have any questions about trading instruments, you can always ask an analyst in the online chat on the portal and get a free consultation of an experienced specialist.

Use the current recommendations of analysts on XAU/USD and trade efficiently with NPBFX.
 
Back
Top