NPBFX - making money with us since 1996!

The Walt Disney Co.: technical analysis 20.03.2024

Good afternoon, dear forum visitors!

NPBFX offers the latest release of analytics on The Walt Disney Co. for a better understanding of the current market situation and more efficient trading.

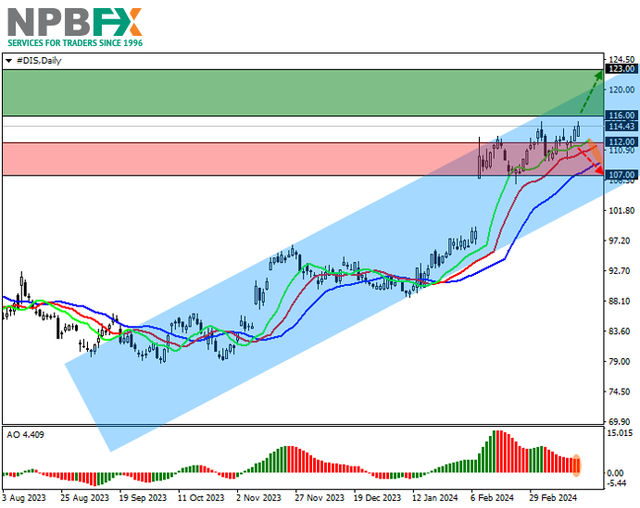
Shares of The Walt Disney Co., one of the leaders in the entertainment industry, are trading in a corrective trend at 114.00.

On the daily chart, the price is moving within an ascending channel with dynamic boundaries of 118.00–106.00, approaching the resistance line.

On the four-hour chart, the quotes can break the year’s high of 115.00, after which an increase to the channel resistance line of 123.00 is expected. In case of a reversal and decline, the asset may begin to work out the recent price gap of 106.00–98.70.

Technical indicators are holding a buy signal: fast EMA on the Alligator indicator are above the signal line, and the AO histogram is forming corrective bars in the positive zone.

DIS-200324-22.png


Trading tips

Long positions may be opened after the price rises and consolidates above 116.00, with the target at 123.00. Stop loss – 113.00. Implementation period: 7 days or more.

Short positions may be opened after the price declines and consolidates below 112.00, with the target at 107.00. Stop loss – 115.00.

Use more opportunities of the NPBFX analytical portal: analytics

You can find more actual analytical reviews on other popular currency pairs, metals and CFDs on the NPBFX online portal. Daily analytics with charts, current market prognoses and trading scenarios in the Feed section are available. Get free and unlimited access to the online portal after registering on the official website of NPBFX Company.

If you have any questions about trading instruments, you can always ask an analyst in the online chat on the portal and get a free consultation of an experienced specialist.

Use the current recommendations of analysts on The Walt Disney Co. and trade efficiently with NPBFX.
 
Netflix Inc.: technical analysis 22.03.2024

Good afternoon, dear forum visitors!

NPBFX offers the latest release of analytics on Netflix Inc. for a better understanding of the current market situation and more efficient trading.

Shares of Netflix Inc., an American entertainment company, as well as a streaming service for films and TV series, are moving in a corrective trend at 623.00.

On the daily chart, the price is growing within the channel with dynamic boundaries of 660.00–585.00.

On the four-hour chart, the consolidation above the previous year’s high of 622.00 confirms the potential for an upward movement, and despite the asset being close to the channel resistance line of 660.00, there are no markers indicating the beginning of a full-fledged reversal. A consolidation below the support level of 600.00 will allow the instrument to decline to the channel support line of 580.00.

Technical indicators hold a buy signal: fast EMAs on the Alligator indicator are above the signal line, expanding the range of fluctuations, and the AO histogram forms corrective bars in the buy zone.

NFLX-220324-22.png


Trading tips

Long positions may be opened after the price rises and consolidates above 634.00, with the target at 690.00. Stop loss – 620.00. Implementation period: 7 days or more.

Short positions may be opened after the price declines and consolidates below 605.00, with the target at 549.00. Stop loss – 620.00.

Use more opportunities of the NPBFX analytical portal: weekly FOREX forecast

You can learn more about the current situation and get acquainted with the weekly analytical forecast in the "Video reviews" section on the NPBFX portal. Weekly video reviews contain trends, key levels, trading recommendations for such popular instruments as GBP/USD, EUR/USD, USD/CHF, AUD/USD. In order to get free and unlimited access to video forecast and other useful instruments on the portal, you need to register on the NPBFX website.

If you have any questions about trading instruments, you can always ask an analyst in the online chat on the portal and get a free consultation of an experienced specialist.

Use the current recommendations of analysts on Netflix Inc. and trade efficiently with NPBFX.
 
Apple Inc.: technical analysis 25.03.2024

Good afternoon, dear forum visitors!

NPBFX offers the latest release of analytics on Apple Inc. for a better understanding of the current market situation and more efficient trading.

Shares of Apple Inc., a giant in the development and sale of personal and tablet computers, are moving in a corrective trend at 172.00.

On the daily chart, the price is declining within the downward corridor of 182.00–166.00 toward the support line.

On the four-hour chart, the current trend is confirmed by the beginning of the implementation of a local Flag pattern of trend continuation with the implementation level at 173.00, as well as the quotes are near the year’s low of 169.00, which they can overcome this week.

Technical indicators reflect the weakening of the trading instrument: fast EMAs on the Alligator indicator maintain a stable sell signal, and the AO histogram forms corrective bars below the transition level.

AAPL-250324-22.png


Trading tips

Short positions may be opened after the price declines and consolidates below 169.00, with the target at 158.00. Stop loss is above 175.00. Implementation period: 7 days or more.

Long positions may be opened after the price rises and consolidates above 176.00, with the target at 184.00 and stop loss 172.00.

Use more opportunities of the NPBFX analytical portal: E-book

If you just recently started to be interested in trading on FOREX and would like to deepen your knowledge, an electronic Beginner's Guide to FOREX Trading will be an excellent helper for you here. The book consists of 5 chapters and reflects fundamental concepts of the foreign exchange market to start successful trading. From the main chapters of the E-book you can learn about the concepts and history of FOREX, currencies and trend lines, technical indicators, types of orders, trading on news, psychology of trading, risk management and much more.

You can read a Beginner's guide to FOREX Trading online or download it free of charge from the NPBFX analytical portal in the "Education" section. In order to get unlimited access to the E-book and other useful instruments on the portal, you need to register on the NPBFX website.

If you have any questions about trading instruments, you can always ask an analyst in the online chat on the portal and get a free consultation of an experienced specialist.

Use the current recommendations of analysts on Apple Inc. and trade efficiently with NPBFX.
 
IBM Corp.: technical analysis 27.03.2024

Good afternoon, dear forum visitors!

NPBFX offers the latest release of analytics on IBM Corp. for a better understanding of the current market situation and more efficient trading.

Shares of IBM Corp., a giant in the development and sale of hardware software, are trading in a corrective trend at 188.00.

On the daily chart, the price moves within an ascending corridor with dynamic boundaries of 200.00–184.00, forming a downward wave.

On the four-hour chart, after breaking through the previous year’s high of 198.00, the quotes reversed downwards and are heading towards the mid-January low of 176.00. If the asset fails to overcome the support line of the channel of 184.00, a repeated upward reversal and renewing of global highs is possible.

Technical indicators are slowing the buy signal: fast EMAs on the Alligator indicator are approaching the signal line, narrowing the range of fluctuations, and the AO histogram is forming corrective bars, heading towards the transition level.

IBM270324-11.png


Trading tips

Short positions may be opened after the price declines and consolidates below 186.00, with the target at 176.50 and stop loss 190.00. Implementation period: 7 days or more.

Long positions may be opened after the price rises and consolidates above 192.30, with the target at 200.00. Stop loss – 189.00.

Use more opportunities of the NPBFX analytical portal: analytics

You can find more actual analytical reviews on other popular currency pairs, metals and CFDs on the NPBFX online portal. Daily analytics with charts, current market prognoses and trading scenarios in the Feed section are available. Get free and unlimited access to the online portal after registering on the official website of NPBFX Company.

If you have any questions about trading instruments, you can always ask an analyst in the online chat on the portal and get a free consultation of an experienced specialist.

Use the current recommendations of analysts on IBM Corp. and trade efficiently with NPBFX.
 
Johnson & Johnson: technical analysis 29.03.2024

Good afternoon, dear forum visitors!

NPBFX offers the latest release of analytics on Johnson & Johnson for a better understanding of the current market situation and more efficient trading.

Shares of Johnson & Johnson, one of the leading retail holdings, are trading at 158.00.

On the daily chart, the price is correcting, holding below the support line of the Triangle pattern with dynamic boundaries of 158.00–164.00.

On the four-hour chart, the quotes left the formation; if the reverse test of the passed support line of 159.00 is completed according to the standard scenario, the decline will continue to the December low of 153.00. If the asset returns to the pattern, global growth may reach this year’s high of 163.00.

Technical indicators are weakening the sell signal against a correction: the EMA fluctuation range on the Alligator indicator is directed downward, and the AO histogram forms upward bars below the transition level.

JNJ290324-22.png


Trading tips

Short positions may be opened after the price declines and consolidates below 156.80, with the target at 153.00. Stop loss – 158.00. Implementation period: 7 days or more.

Long positions may be opened after the price rises and consolidates above 159.30, with the target at 163.00. Stop loss – 157.50.

Use more opportunities of the NPBFX analytical portal: weekly FOREX forecast

You can learn more about the current situation and get acquainted with the weekly analytical forecast in the "Video reviews" section on the NPBFX portal. Weekly video reviews contain trends, key levels, trading recommendations for such popular instruments as GBP/USD, EUR/USD, USD/CHF, AUD/USD. In order to get free and unlimited access to video forecast and other useful instruments on the portal, you need to register on the NPBFX website.

If you have any questions about trading instruments, you can always ask an analyst in the online chat on the portal and get a free consultation of an experienced specialist.

Use the current recommendations of analysts on Johnson & Johnson and trade efficiently with NPBFX.
 
eBay Inc.: technical analysis 01.04.2024

Good afternoon, dear forum visitors!

NPBFX offers the latest release of analytics on eBay Inc. for a better understanding of the current market situation and more efficient trading.

Shares of eBay Inc., an American online retail company, are trading at 53.00.

On the daily chart, the price is correcting upwards, retreating from the resistance line of the ascending channel 48.00–43.50.

On the four-hour chart, the breakout of the current high of 52.80 confirms the transition to the formation of a full-fledged upward trend, and after consolidating above it, it may reach 56.00.

Technical indicators keep a buy signal: fast EMAs on the Alligator indicator remain above the signal line, and the AO histogram forms upward bars in the positive zone.

EBAY010424-22.png


Trading tips

Long positions may be opened after the price rises and consolidates above 53.40, with the target at 56.10 and stop loss 52.00. Implementation period: 7 days or more.

Short positions may be opened after the consolidation below 52.00, with the target at 49.10. Stop loss is above 53.00.

Use more opportunities of the NPBFX analytical portal: E-book

If you just recently started to be interested in trading on FOREX and would like to deepen your knowledge, an electronic Beginner's Guide to FOREX Trading will be an excellent helper for you here. The book consists of 5 chapters and reflects fundamental concepts of the foreign exchange market to start successful trading. From the main chapters of the E-book you can learn about the concepts and history of FOREX, currencies and trend lines, technical indicators, types of orders, trading on news, psychology of trading, risk management and much more.

You can read a Beginner's guide to FOREX Trading online or download it free of charge from the NPBFX analytical portal in the "Education" section. In order to get unlimited access to the E-book and other useful instruments on the portal, you need to register on the NPBFX website.

If you have any questions about trading instruments, you can always ask an analyst in the online chat on the portal and get a free consultation of an experienced specialist.

Use the current recommendations of analysts on eBay Inc. and trade efficiently with NPBFX.
 
Alibaba Group Holdings Ltd.: technical analysis 03.04.2024

Good afternoon, dear forum visitors!

NPBFX offers the latest release of analytics on Alibaba Group Holdings Ltd. for a better understanding of the current market situation and more efficient trading.

Shares of Alibaba Group Holdings Ltd., one of the largest companies in the field of Internet commerce, are corrected at 73.00.

On the daily chart, the price is moving within the Triangle pattern with dynamically narrowing boundaries of 77.00–70.00, trading slightly above the support line.

On the four-hour chart, the quotes consolidated above the local low within the formation of 71.00, confirming the likelihood of further growth. A consolidation above the high of 74.00 allows the asset to reach the resistance level of 78.00.

Technical indicators are ready to reverse and give a buy signal: fast EMA on the Alligator indicator are below the signal line, narrowing the range of fluctuations, and the AO histogram forms ascending bars, decreasing in the sales zone.

BA-030424-22.png


Trading tips

Long positions may be opened after the price rises and consolidates above 74.20, with the target at 78.00. Stop loss – 72.00. Implementation period: 7 days or more.

Short positions may be opened after the price declines and consolidates below 70.90, with the target at 67.00. Stop loss – 72.00.

Use more opportunities of the NPBFX analytical portal: economic calendar

Be ready for any market changes through global events using the economic calendar on the NPBFX portal. The calendar contains all the most important events of the world economy and prognoses for them. In order to get free and unlimited access to the economic calendar and other useful instruments on the portal, you need to pass a one-time registration on the NPBFX website.

If you have any questions about trading instruments, you can always ask an analyst in the online chat on the portal and get a free consultation of an experienced specialist.

Use the current recommendations of analysts on Alibaba Group Holdings Ltd. and trade efficiently with NPBFX.
 
Tesla Inc.: technical analysis 05.04.2024

Good afternoon, dear forum visitors!

NPBFX offers the latest release of analytics on Tesla Inc. for a better understanding of the current market situation and more efficient trading.

Shares of Tesla Inc., a leading manufacturer of electric cars, are trading at 171.00.

On the daily chart, the price is correcting within the downward channel of 228.00–152.00, trying to form a reversal.

On the four-hour chart, the development of upward dynamics will become possible after consolidation above the local high of 178.00, and the only obstacle to continuing the decline remains the tested year’s low of 162.00.

Technical indicators keep a sell signal: fast EMA on the Alligator indicator are below the signal line, and the AO histogram is forming corrective bars in the sell zone.

TSLA050424-11.png


Trading tips

Long positions may be opened after the price rises and consolidates above 178.00, with the target at 197.00. Stop loss – 175.00. Implementation period: 7 days or more.

Short positions may be opened after the price declines and consolidates below 163.00, with the target at 140.00. Stop loss – 170.00.

Use more opportunities of the NPBFX analytical portal: weekly FOREX forecast

You can learn more about the current situation and get acquainted with the weekly analytical forecast in the "Video reviews" section on the NPBFX portal. Weekly video reviews contain trends, key levels, trading recommendations for such popular instruments as GBP/USD, EUR/USD, USD/CHF, AUD/USD. In order to get free and unlimited access to video forecast and other useful instruments on the portal, you need to register on the NPBFX website.

If you have any questions about trading instruments, you can always ask an analyst in the online chat on the portal and get a free consultation of an experienced specialist.

Use the current recommendations of analysts on Tesla Inc. and trade efficiently with NPBFX.
 
General Electric Co.: technical analysis 08.04.2024

Good afternoon, dear forum visitors!

NPBFX offers the latest release of analytics on General Electric Co. for a better understanding of the current market situation and more efficient trading.

Shares of General Electric Co., an American diversified corporation, are trading at 156.00.

On the daily chart, the price is moving in a corrective trend, working out the price gap of 175.00–140.00.

On the four-hour chart, the quotes have consolidated above the resistance level of 150.00, and the only obstacle to further growth is the high of 163.00, consolidation above which will allow the asset to reach the opening price gap level of 175.00.

Technical indicators are holding a sell signal: fast EMA on the Alligator indicator are above the signal line, preparing to begin narrowing the range, and the AO histogram is forming corrective bars in the sell zone.

GE080424-22.png


Trading tips

Long positions may be opened after the price rises and consolidates above 158.00, with the target at 175.00. Stop loss – 155.00. Implementation period: 7 days or more.

Short positions may be opened after the price declines and consolidates below 153.00, with the target at 140.30. Stop loss – 157.00.

Use more opportunities of the NPBFX analytical portal: E-book

If you just recently started to be interested in trading on FOREX and would like to deepen your knowledge, an electronic Beginner's Guide to FOREX Trading will be an excellent helper for you here. The book consists of 5 chapters and reflects fundamental concepts of the foreign exchange market to start successful trading. From the main chapters of the E-book you can learn about the concepts and history of FOREX, currencies and trend lines, technical indicators, types of orders, trading on news, psychology of trading, risk management and much more.

You can read a Beginner's guide to FOREX Trading online or download it free of charge from the NPBFX analytical portal in the "Education" section. In order to get unlimited access to the E-book and other useful instruments on the portal, you need to register on the NPBFX website.

If you have any questions about trading instruments, you can always ask an analyst in the online chat on the portal and get a free consultation of an experienced specialist.

Use the current recommendations of analysts on General Electric Co. and trade efficiently with NPBFX.
 
PayPal Holdings Inc.: technical analysis 10.04.2024

Good afternoon, dear forum visitors!

NPBFX offers the latest release of analytics on PayPal Holdings Inc. for a better understanding of the current market situation and more efficient trading.

Shares of PayPal Holdings Inc., an American debit payment processor, are trading at 67.00.

On the daily chart, the price is trying to initiate a Head and shoulders reversal pattern with the Neckline around 68.00.

On the four-hour chart, after consolidating above the current local high of 68.00, the quotes will be able to continue growing and reach the primary target for the pattern at 75.00, and in the event of a downward reversal, a movement to the low of the second Shoulder of the formation of 61.00 is expected.

Technical indicators are holding a buy signal: fast EMA on the Alligator indicator are above the signal line, and the AO histogram is forming ascending bars.

PYPL100424-11.png


Trading tips

Long positions may be opened after the price rises and consolidates above 68.00, with the target at 73.00. Stop loss – 66.00. Implementation period: 7 days or more.

Short positions may be opened after the price declines and consolidates below 65.50, with the target at 60.70. Stop loss – 67.00.

Use more opportunities of the NPBFX analytical portal: analytics

You can find more actual analytical reviews on other popular currency pairs, metals and CFDs on the NPBFX online portal. Daily analytics with charts, current market prognoses and trading scenarios in the Feed section are available. Get free and unlimited access to the online portal after registering on the official website of NPBFX Company.

If you have any questions about trading instruments, you can always ask an analyst in the online chat on the portal and get a free consultation of an experienced specialist.

Use the current recommendations of analysts on PayPal Holdings Inc. and trade efficiently with NPBFX.
 
Back
Top