NPBFX - making money with us since 1996!

EUR/USD: the euro is held near the parity level with the US dollar 13.07.2022

Good afternoon, dear forum visitors!

NPBFX offers the latest release of analytics on EUR/USD for a better understanding of the current market situation and more efficient trading.

Current trend

The European currency shows multidirectional trading dynamics, consolidating near the key level of 1.0000, which has not yet been actively tested. The day before, the instrument also traded near the parity level and even tried to fall to the level of 0.9990 for some time; however, the "bulls" quickly regained the lost positions. The euro is certainly receiving strong technical support near this psychological level, but the pressure on the single currency only intensifies as the region's economic outlook deteriorates. The last time the euro traded at parity against the US dollar was in December 2002.

Yesterday's macroeconomic statistics put additional pressure on the positions of the single currency, intensifying talks about a possible recession in the European economy: ZEW Survey on Economic Sentiment fell sharply in July from –28.0 to –51.1 points, while analysts expected a decline to only –32.8 points. In turn, ZEW Survey on Current Situation in Germany over the same period fell from –27.6 to –45.8 points, while the forecast was –34.5 points, and the Economic Sentiment index fell from –28.0 to –53.8 points, which also turned out to be significantly worse than market forecasts at the level of –38.3 points.

Today, investors are focused on statistics on the dynamics of consumer prices in Germany in June, as well as May data on the dynamics of industrial production in the eurozone.

Support and resistance

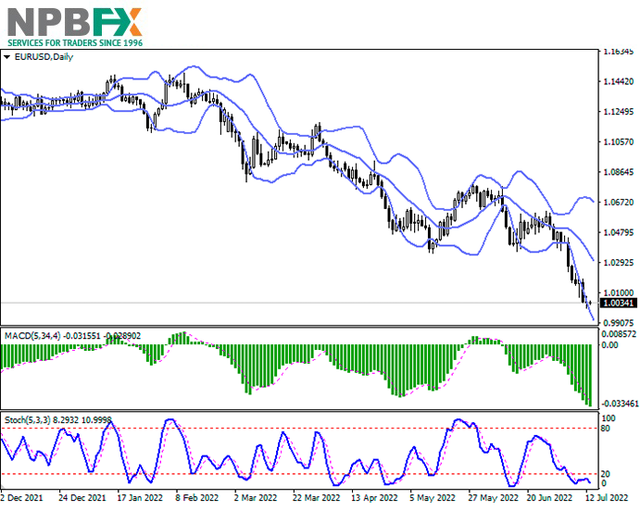
Bollinger Bands in D1 chart demonstrate active decrease. The price range is expanding, making way to new record lows for the "bears". MACD is going down preserving a stable sell signal (located below the signal line). Stochastic retains downward direction but is located in close proximity to its lows, which indicates the risks of oversold EUR in the ultra-short term.

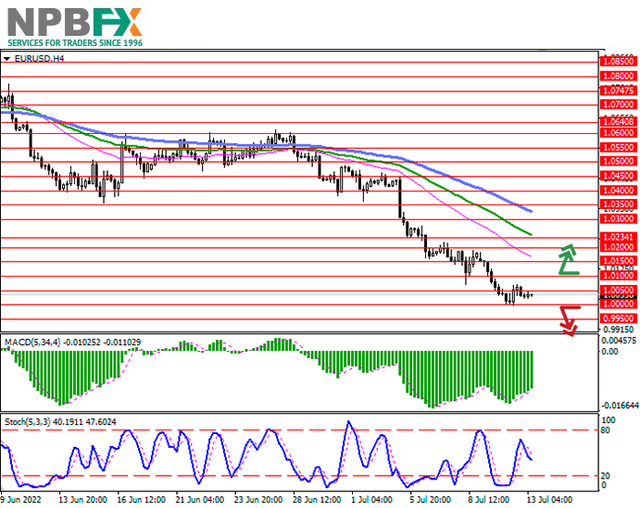
Resistance levels: 1.0050, 1.0100, 1.0150, 1.0200.
Support levels: 1.0000, 0.9950, 0.9900.

eurusd-13072022-55.png


eurusd-13072022-66.png


Trading tips

Short positions may be opened after a breakdown of 1.0000 with the target at 0.9900. Stop-loss — 1.0050. Implementation time: 2-3 days.

The return of the "bullish" trend with the breakout of 1.0100 may become a signal for new purchases with the target of 1.0200. Stop-loss — 1.0050.

Use more opportunities of the NPBFX analytical portal: analytics

You can find more actual analytical reviews on other popular currency pairs, metals and CFDs on the NPBFX online portal. Daily analytics with charts, current market prognoses and trading scenarios in the Feed section are available. Get free and unlimited access to the online portal after registering on the official website of NPBFX Company.

If you have any questions about trading instruments, you can always ask an analyst in the online chat on the portal and get a free consultation of an experienced specialist.

Use the current recommendations of analysts on EUR/USD and trade efficiently with NPBFX.
 
GBP/USD: consolidating at record lows 15.07.2022

Good afternoon, dear forum visitors!

NPBFX offers the latest release of analytics on GBP/USD for a better understanding of the current market situation and more efficient trading.

Current trend

The British pound shows near-zero dynamics, testing 1.1820 for a breakdown, returning to active decline after an unsuccessful attempt at corrective growth, which was supported by optimistic macroeconomic statistics from the UK.

On Wednesday, data on the dynamics of GDP and industrial production for May were released. The British economy strengthened by 0.5% after declining by 0.3% a month earlier, although analysts had expected zero dynamics. Industrial Production for the same period increased by 0.9% after falling by 0.1% in the previous month, with forecasts suggesting zero growth, and in annual terms, the figure corrected from 1.6% to 1.4%, while analysts assumed a sharp decline of 0.5%.

Strong macroeconomic statistics increased the chances that the Bank of England will continue to actively tighten monetary policy: the British regulator raised rates 5 times in a row, albeit at a moderate pace. However, the economic situation remains difficult and recession risks remain very high.

The day before, the preliminary second round of elections for the post of Prime Minister and leader of the Conservative Party ended in the UK. Former Treasury Secretary Rishi Sunak won the most votes (101 votes), followed by Associate Trade Policy Minister Penny Mordaunt with 83 votes and Foreign Secretary Liz Truss (64 votes). A new British Prime Minister will be elected on September 5, while the current head of Government, Boris Johnson, is set to resign on September 7.

Support and resistance

Bollinger Bands on the daily chart show a steady decline. The price range is narrowing, reflecting the emergence of multidirectional trading dynamics in the short term. MACD is declining keeping a weak sell signal (located below the signal line). Stochastic keeps a horizontal direction and is located near its lows, which indicates the risks of oversold GBP in the ultra-short term.

Resistance levels: 1.1854, 1.1933, 1.2000, 1.2074.
Support levels: 1.1800, 1.1758, 1.1700, 1.1600.

gbpusd-15072022-55.png


gbpusd-15072022-66.png


Trading tips

Long positions can be opened after a breakout of 1.1854 with the target of 1.2000. Stop-loss — 1.1790. Implementation time: 2-3 days.

A rebound from 1.1854 as from resistance, followed by a breakdown of 1.1800 may become a signal for opening of new short positions with the target at 1.1700. Stop-loss — 1.1854.

Use more opportunities of the NPBFX analytical portal: weekly FOREX forecast

You can learn more about the current situation on GBP/USD and get acquainted with the weekly analytical forecast in the "Video reviews" section on the NPBFX portal. Weekly video reviews contain trends, key levels, trading recommendations for such popular instruments as GBP/USD, EUR/USD, USD/CHF, USD/JPY. In order to get free and unlimited access to video forecast and other useful instruments on the portal, you need to register on the NPBFX website.

If you have any questions about trading instruments, you can always ask an analyst in the online chat on the portal and get a free consultation of an experienced specialist.

Use the current recommendations of analysts on GBP/USD and trade efficiently with NPBFX.
 
Hewlett-Packard Co.: technical analysis 18.07.2022

Good afternoon, dear forum visitors!

NPBFX offers the latest release of analytics on Hewlett-Packard Co. for a better understanding of the current market situation and more efficient trading.

Shares of the American IT company providing hardware and software services, Hewlett-Packard Co., are moving in a corrective trend around 31.60.

On the daily chart of the asset, the price left the wide lateral channel with the boundaries of 34.00–41.00 and consolidated below the support line, having simultaneously overcome the level of Fibonacci initial retracement level of 23.6% at 34.00.

On the four-hour time frame, it is seen that the decline in quotes below the 23.6% Fibonacci retracement acts as a catalyst for the start of a full-fledged downward correction, and the probability of reaching the next level, the 38.2% Fibonacci base retracement at 30.00, is extremely high. Currently, there is a technical rollback of quotes upwards, after which another downward momentum may follow and the level of 50.0% Fibonacci intermediate retracement at 27.00 may follow.

The high probability of further decline is also confirmed by technical indicators that keep a stable sell signal: fast EMAs on the Alligator indicator are expanding the range of fluctuations in the direction of decline, and the histogram of the AO oscillator is forming new descending bars.

HPQ-180722-22.png


Trading tips

Short positions can be opened if the price continues to decline and consolidates below the base retracement level at 30.00 in order to reach global support at 27.00. Stop-loss –32.00. Implementation time: 7 days and more.

Long positions will be relevant if the corrective growth of the asset continues and the price consolidates above the local resistance level of 32.00 with the target of 34.00. Stop-loss – 31.00.

Use more opportunities of the NPBFX analytical portal: E-book

If you just recently started to be interested in trading on FOREX and would like to deepen your knowledge, an electronic Beginner's Guide to FOREX Trading will be an excellent helper for you here. The book consists of 5 chapters and reflects fundamental concepts of the foreign exchange market to start successful trading. From the main chapters of the E-book you can learn about the concepts and history of FOREX, currencies and trend lines, technical indicators, types of orders, trading on news, psychology of trading, risk management and much more.

You can read a Beginner's guide to FOREX Trading online or download it free of charge from the NPBFX analytical portal in the "Education" section. In order to get unlimited access to the E-book and other useful instruments on the portal, you need to register on the NPBFX website.

If you have any questions about trading instruments, you can always ask an analyst in the online chat on the portal and get a free consultation of an experienced specialist.

Use the current recommendations of analysts on Hewlett-Packard Co. and trade efficiently with NPBFX.
 
Visa Inc.: wave analysis 20.07.2022

Good afternoon, dear forum visitors!

NPBFX offers the latest release of analytics on Visa Inc. for a better understanding of the current market situation and more efficient trading.

The price is in correction, the probability of growth is maintained.

On the daily chart, the development of the third wave of the higher level (3) was completed and a downward correction as the fourth wave (4) began. By now, wave A of (4) has already appeared and the construction of wave B of (4) is observed, in which wave a of B is formed. If the assumption is correct, one may expect the growth of the price of the asset to 226.95–236.61. The level of 185.70 is critical and stop-loss for this scenario.

V-200722-33.png


V-200722-333.png


Main scenario

Long positions are relevant from the corrections above the level of 185.70 with targets at 226.95–236.61. Implementation time: 7 days and more.

Alternative scenario

Breakout and consolidation of the price above the level of 185.70 will help the instrument continue growth to the levels of 175.00–162.95.

Use more opportunities of the NPBFX analytical portal: analytics

You can find more actual analytical reviews on other popular currency pairs, metals and CFDs on the NPBFX online portal. Daily analytics with charts, current market prognoses and trading scenarios in the Feed section are available. Get free and unlimited access to the online portal after registering on the official website of NPBFX Company.

If you have any questions about trading instruments, you can always ask an analyst in the online chat on the portal and get a free consultation of an experienced specialist.

Use the current recommendations of analysts on Visa Inc. and trade efficiently with NPBFX.
 
USD/CHF: trading instrument is preparing to continue to decline 22.07.2022

Good afternoon, dear forum visitors!

NPBFX offers the latest release of analytics on USD/CHF for a better understanding of the current market situation and more efficient trading.

Current trend

USD/CHF is trading in a corrective trend around 0.9686 against the backdrop of a depreciation of the US currency.

However, there are no prerequisites for the strengthening of the franc at the moment either. Instead, the economic situation in Switzerland is rapidly deteriorating, and in the near future the country may face an acute energy crisis. At least, this is what Michael Frank, director of the VSE association of Swiss electricity companies, said. According to him, power outages were caused by a reduction in gas supplies from Russia and the shutdown of nuclear power plants in France for maintenance. The only way to stabilize the situation, Frank sees a phased reduction in resource consumption, which, in particular, includes limiting the illuminating of shop windows and streets, and if this is not enough, then turning off individual regions for four hours in turn. The Swiss authorities predict an increase in the negative dynamics of electricity prices. According to the head of the government’s advisory commission for electricity, Elcom, Urs Meister, ordinary citizens' electricity bills could grow by an average of 20% next year. This conclusion comes from a survey of suppliers who intend to raise prices by 47% amid rising coal prices, likely problems with exports from neighboring countries and global supply uncertainty.

In turn, the American currency continues its gradual decline before the next meeting of the US Federal Reserve and is currently trading at around 106.800 in the USD Index. The pressure on the quotes was exerted by the data on the national labor market, published the day before. Initial Jobless Claims increased to 251K from 244K a week earlier, which significantly exceeds the decline predicted by analysts to 240K, and ultimately led to an increase in the Continuing Jobless Claims to 1.384M from 1.333M last week.

Support and resistance

On the global chart of the asset, the price is correcting within the lateral channel, preparing to continue the local decline. Technical indicators have almost reversed and issued a sell signal: fast EMAs on the Alligator indicator came close to the signal line, and the AO oscillator histogram has already moved into the sell zone, continuing to form descending bars.

Support levels: 0.9652, 0.9530.
Resistance levels: 0.9739, 1.0000.

USDCHF220722-11.png


Trading tips

Short positions can be opened after a complete reversal and continued local decline in the asset, as well as consolidation of the price below the local support level of 0.9652 with the target of 0.9530. Stop-loss — 0.9710. Implementation time: 7 days and more.

Long positions can be opened after a continued global growth of the asset, as well as consolidation of the price above the local resistance level of 0.9739 with the target of 1.0000. Stop-loss — 0.9650.

Use more opportunities of the NPBFX analytical portal: weekly FOREX forecast

You can learn more about the current situation on USD/CHF and get acquainted with the weekly analytical forecast in the "Video reviews" section on the NPBFX portal. Weekly video reviews contain trends, key levels, trading recommendations for such popular instruments as AUD/USD, EUR/USD, GBP/USD, USD/JPY. In order to get free and unlimited access to video forecast and other useful instruments on the portal, you need to register on the NPBFX website.

If you have any questions about trading instruments, you can always ask an analyst in the online chat on the portal and get a free consultation of an experienced specialist.

Use the current recommendations of analysts on USD/CHF and trade efficiently with NPBFX.
 
Pfizer Inc.: technical analysis 25.07.2022

Good afternoon, dear forum visitors!

NPBFX offers the latest release of analytics on Pfizer Inc. for a better understanding of the current market situation and more efficient trading.

The stocks of the innovative biopharmaceutical company Pfizer Inc. are trading slightly above 51.00.

On the daily chart of the asset, the formation of a global corrective trend continues, and the price is clamped within the Triangle pattern with dynamic boundaries of 46.00–54.00.

On the four-hour chart, the local growth of the trading instrument after reaching the resistance line of the pattern at 53.00 has ended, and now a full-fledged reversal is being formed. Given the strength of the resistance line, further movement of quotes can be continued towards the support line around 46.00.

Technical indicators reversed downwards: fast EMAs on the Alligator indicator are consolidated below the signal line, and the AO oscillator histogram is trading in the sell zone, forming new downward bars, being close to the transition level which is typical for this pattern.

PFE-250722-11.png


Trading tips

Short positions may be opened after the final reversal and continued decline in the asset or consolidation below the local support level of 50.10 with the target at 46.80. Stop loss – 52.00. Implementation period: 7 days or more.

Long positions may be opened after the continued global growth of the asset or consolidation above the resistance line of the pattern at 53.40 with the target at 55.60. Stop loss – 52.80.

Use more opportunities of the NPBFX analytical portal: E-book

If you just recently started to be interested in trading on FOREX and would like to deepen your knowledge, an electronic Beginner's Guide to FOREX Trading will be an excellent helper for you here. The book consists of 5 chapters and reflects fundamental concepts of the foreign exchange market to start successful trading. From the main chapters of the E-book you can learn about the concepts and history of FOREX, currencies and trend lines, technical indicators, types of orders, trading on news, psychology of trading, risk management and much more.

You can read a Beginner's guide to FOREX Trading online or download it free of charge from the NPBFX analytical portal in the "Education" section. In order to get unlimited access to the E-book and other useful instruments on the portal, you need to register on the NPBFX website.

If you have any questions about trading instruments, you can always ask an analyst in the online chat on the portal and get a free consultation of an experienced specialist.

Use the current recommendations of analysts on Pfizer Inc. and trade efficiently with NPBFX.
 
Netflix Inc.: technical analysis 27.07.2022

Good afternoon, dear forum visitors!

NPBFX offers the latest release of analytics on Netflix Inc. for a better understanding of the current market situation and more efficient trading.

The shares of Netflix Inc., an American entertainment company, continue to trade within a corrective trend, currently moving around 214.00.

On the daily chart of the asset, the quotes left the global downwards channel with dynamic boundaries of 70.00–200.00 and confidently consolidated above it, approaching the price gap closing level of April 20, 2022.

On the four-hour chart, it is seen that the potential of the upward movement has not yet been exhausted, and, despite the falling trading volumes, the price will be able to break the local high of 230.00, starting to close the price gap. The closing level of this gap is at 330.00, and technical indicators have already given a new buy signal: indicator Alligator’s EMA oscillation range reversed upwards, and the histogram of the AO oscillator is forming new rising bars in the buying zone.

NFLX-270722-22.png


Trading tips

Long positions may be opened after the corrective growth or consolidation above the local high at 230.00 with the target at the price gap of 330.00. Stop loss is 210.00, below the resistance line. Implementation period: 7 days or more.

Short positions may be opened after the reversal and continued global decline in the asset or consolidation below the local support level of 203.00 with the target at 163.00. Stop loss — 215.00.

Use more opportunities of the NPBFX analytical portal: analytics

You can find more actual analytical reviews on other popular currency pairs, metals and CFDs on the NPBFX online portal. Daily analytics with charts, current market prognoses and trading scenarios in the Feed section are available. Get free and unlimited access to the online portal after registering on the official website of NPBFX Company.

If you have any questions about trading instruments, you can always ask an analyst in the online chat on the portal and get a free consultation of an experienced specialist.

Use the current recommendations of analysts on Netflix Inc. and trade efficiently with NPBFX.
 
Meta Platforms Inc.: technical analysis 29.07.2022

Good afternoon, dear forum visitors!

NPBFX offers the latest release of analytics on Meta Platforms Inc. for a better understanding of the current market situation and more efficient trading.

The shares of Meta Platforms Inc., which owns the world's largest social network Facebook, are falling, currently trading around 160.00.

On the daily chart of the asset, a global downward channel is forming with dynamic boundaries 135.00–200.00, and at the moment, the price is near its lower border, attempting an upward correction.

On a four-hour chart, local growth is developing within the Expanding formation pattern, where the quotes have reached the lower border around 154.00, where the seventh ascending wave with the target at the upper border of the global channel around 197.00 can start to form.

Technical indicators confirm the likelihood of a reversal and subsequent growth: fast EMAs on the Alligator indicator are very close to the signal line, and the AO oscillator histogram is trading close to the transition level and can cross it at any time.

META-290722-22.png


Trading tips

Long positions may be opened after a reversal and continued local growth of the asset or consolidation above the resistance level of 172.00 to reach the resistance line around 197.00. Stop loss – 167.00. Implementation period: 7 days or more.

Short positions may be opened after the continuation of the downward movement or consolidation below the support level of 154.00 with the target at 135.00. Stop loss – 160.00.

Use more opportunities of the NPBFX analytical portal: E-book

If you just recently started to be interested in trading on FOREX and would like to deepen your knowledge, an electronic Beginner's Guide to FOREX Trading will be an excellent helper for you here. The book consists of 5 chapters and reflects fundamental concepts of the foreign exchange market to start successful trading. From the main chapters of the E-book you can learn about the concepts and history of FOREX, currencies and trend lines, technical indicators, types of orders, trading on news, psychology of trading, risk management and much more.

You can read a Beginner's guide to FOREX Trading online or download it free of charge from the NPBFX analytical portal in the "Education" section. In order to get unlimited access to the E-book and other useful instruments on the portal, you need to register on the NPBFX website.

If you have any questions about trading instruments, you can always ask an analyst in the online chat on the portal and get a free consultation of an experienced specialist.

Use the current recommendations of analysts on Meta Platforms Inc. and trade efficiently with NPBFX.
 
Walmart Inc.: technical analysis 01.08.2022

Good afternoon, dear forum visitors!

NPBFX offers the latest release of analytics on Walmart Inc. for a better understanding of the current market situation and more efficient trading.

The shares of Walmart Inc., the US company that operates the world's largest wholesale and retail chain, are in the 132.00 area.

On the daily chart of the asset, the price is correcting after a significant decline, forming a local ascending channel with boundaries of 120.00–135.00.

On a four-hour chart, the asset approached the solid resistance line of the 134.00 range, formed at the end of January 2022, and continued growth is possible only if the quotes consolidate above it.

Technical indicators confirm the continuation of the corrective upward dynamics, holding a buy signal: indicator Alligator's EMA oscillation range expands upwards, and the AO oscillator histogram forms ambiguous bars in the buying zone.

WMT-01082022-22.png


Trading tips

Long positions may be opened after the price rises and consolidates above 133.00 with the target at 141.70 and stop loss 130.00. Implementation period: 7 days or more.

Short positions may be opened after a reversal, reduction, and consolidation of the price below 128.70 with the target at 121.90. Stop loss – 131.00.

Use more opportunities of the NPBFX analytical portal: analytics

You can find more actual analytical reviews on other popular currency pairs, metals and CFDs on the NPBFX online portal. Daily analytics with charts, current market prognoses and trading scenarios in the Feed section are available. Get free and unlimited access to the online portal after registering on the official website of NPBFX Company.

If you have any questions about trading instruments, you can always ask an analyst in the online chat on the portal and get a free consultation of an experienced specialist.

Use the current recommendations of analysts on Walmart Inc. and trade efficiently with NPBFX.
 
PayPal Holdings Inc.: technical analysis 03.08.2022

Good afternoon, dear forum visitors!

NPBFX offers the latest release of analytics on PayPal Holdings Inc. for a better understanding of the current market situation and more efficient trading.

The shares of PayPal Holdings Inc., an American debit payment processor, correct at 88.00.

On the daily chart of the asset, the price is moving above the resistance line of a wide downwards channel with dynamic boundaries of 50.00–80.00, holding at the local high of June 8 at 89.00.

On the four-hour chart, it is seen that the probability of the continuation of the upward dynamics is quite high. If the breakout of the local high occurs soon, the quotes will head towards the annual peak around 122.00.

Technical indicators confirm the high probability of growth, keeping a stable buy signal: fast EMAs on the Alligator indicator remain above the signal line, and the AO oscillator histogram forms rising bars in the buying zone.

PYPL-03082022-11.png


Trading tips

Long positions may be opened after the price rises and consolidates above 94.10 with the target at 122.50. Stop loss — 90.00. Implementation period: 7 days or more.

Short positions may be opened after a reversal, reduction, and consolidation of the price below 81.70 with the target at 68.20. Stop loss — 85.00.

Use more opportunities of the NPBFX analytical portal: E-book

If you just recently started to be interested in trading on FOREX and would like to deepen your knowledge, an electronic Beginner's Guide to FOREX Trading will be an excellent helper for you here. The book consists of 5 chapters and reflects fundamental concepts of the foreign exchange market to start successful trading. From the main chapters of the E-book you can learn about the concepts and history of FOREX, currencies and trend lines, technical indicators, types of orders, trading on news, psychology of trading, risk management and much more.

You can read a Beginner's guide to FOREX Trading online or download it free of charge from the NPBFX analytical portal in the "Education" section. In order to get unlimited access to the E-book and other useful instruments on the portal, you need to register on the NPBFX website.

If you have any questions about trading instruments, you can always ask an analyst in the online chat on the portal and get a free consultation of an experienced specialist.

Use the current recommendations of analysts on PayPal Holdings Inc. and trade efficiently with NPBFX.
 
Back
Top