Antony_NPBFX
NPBFX Representative (unconfirmed)
- Messages
- 1,095
AUD/USD: technical analysis 31.12.2018
Good afternoon, dear forum visitors!
NPBFX offers the latest release of analytics on AUD/USD for a better understanding of the current market situation and more efficient trading.
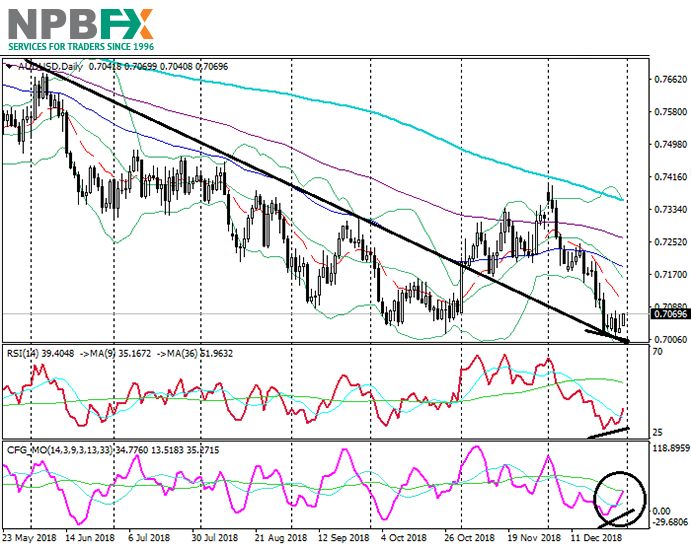
AUD/USD, D1
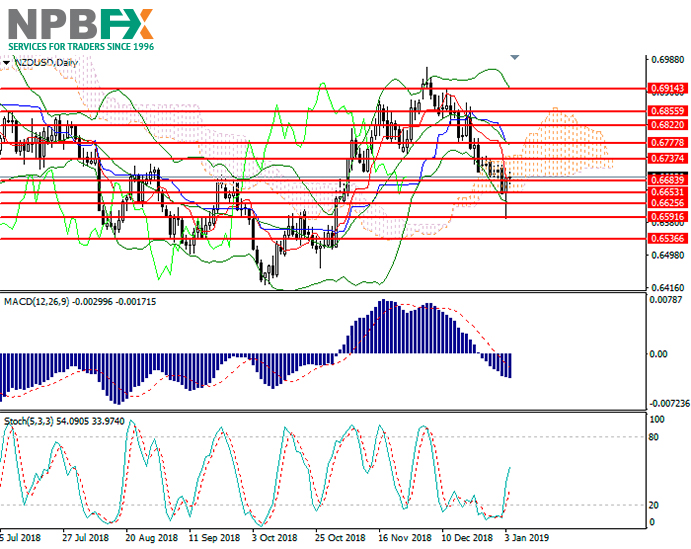
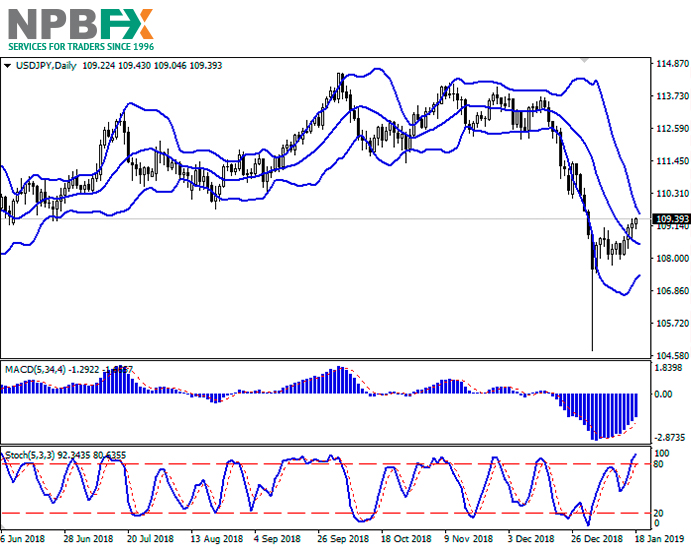
On the daily chart, the pair is trading in the lower Bollinger band. The price remains below its moving averages that are directed down. The RSI is growing, having formed a Bullish divergence with the price. The Composite is showing similar dynamics.
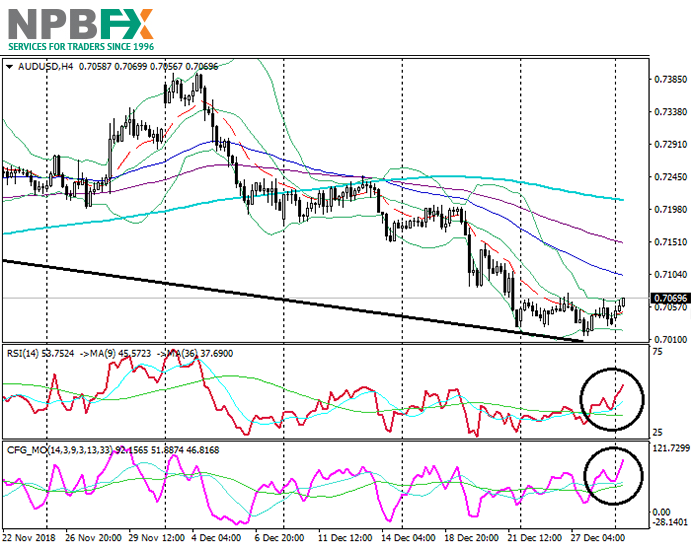
AUD/USD, H4
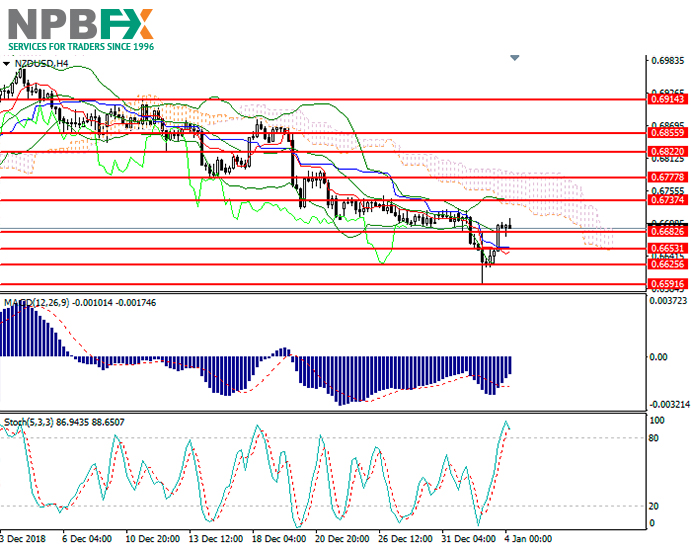
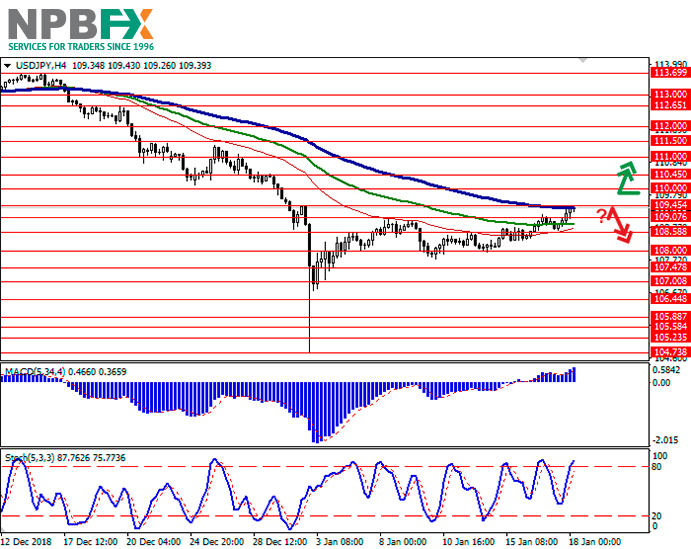
On the 4-hour chart, the pair is trading in the upper Bollinger band. The price remains below the EMA65, EMA130 and SMA200 that are directed down. The RSI is growing, having broken out its longer MA. The is showing similar dynamics.
Key levels
Support levels: 0.7015 (local lows), 0.6910 (September 2015 lows), 0.6830 (January 2016 lows).
Resistance levels: 0.7070 (local highs), 0.7100 (local highs), 0.7175 (local highs).
Trading tips
The price is testing its strong support near 0.7015. There is a chance of an upward correction.
Long positions can be opened from the level of 0.7100 with the target at 0.7175 and stop-loss at 0.7070. Validity – 3-5 days.
Short positions can be opened from the level of 0.7015 with targets at 0.6910, 0.6830 and stop-loss at 0.7070. Validity – 3-5 days.
Use more opportunities of the NPBFX analytical portal:trading signals.
Make right trade decisions on sell or buy USD/CAD and other popular instruments using trading signals on the NPBFX portal. All registered users have free access to signals from the top 10 trading indicators (MA10, BBands, Ichimoku, Stochastic, ZigZag, etc.) with also general recommendations on the portal.
If you have any questions about trading instruments, you can always ask an analyst in the online chat on the portal and get a free consultation of an experienced specialist.
Use the current recommendations of analysts on AUD/USD and trade efficiently with NPBFX.
Good afternoon, dear forum visitors!
NPBFX offers the latest release of analytics on AUD/USD for a better understanding of the current market situation and more efficient trading.
AUD/USD, D1
On the daily chart, the pair is trading in the lower Bollinger band. The price remains below its moving averages that are directed down. The RSI is growing, having formed a Bullish divergence with the price. The Composite is showing similar dynamics.
AUD/USD, H4
On the 4-hour chart, the pair is trading in the upper Bollinger band. The price remains below the EMA65, EMA130 and SMA200 that are directed down. The RSI is growing, having broken out its longer MA. The is showing similar dynamics.
Key levels
Support levels: 0.7015 (local lows), 0.6910 (September 2015 lows), 0.6830 (January 2016 lows).
Resistance levels: 0.7070 (local highs), 0.7100 (local highs), 0.7175 (local highs).
Trading tips
The price is testing its strong support near 0.7015. There is a chance of an upward correction.
Long positions can be opened from the level of 0.7100 with the target at 0.7175 and stop-loss at 0.7070. Validity – 3-5 days.
Short positions can be opened from the level of 0.7015 with targets at 0.6910, 0.6830 and stop-loss at 0.7070. Validity – 3-5 days.
Use more opportunities of the NPBFX analytical portal:trading signals.
Make right trade decisions on sell or buy USD/CAD and other popular instruments using trading signals on the NPBFX portal. All registered users have free access to signals from the top 10 trading indicators (MA10, BBands, Ichimoku, Stochastic, ZigZag, etc.) with also general recommendations on the portal.
If you have any questions about trading instruments, you can always ask an analyst in the online chat on the portal and get a free consultation of an experienced specialist.
Use the current recommendations of analysts on AUD/USD and trade efficiently with NPBFX.