Precious Metals updates by Solid ECN

Gold offers a good buy price.

The yellow metal is trading around $1,742 and above the support level at $1,720. The price bounced off this level 3 times during the last trading year. Considering RSI is in the oversold zone, we expect the gold price to increase in the upcoming weeks.

gold-tech.png


Support: $1,720 - $1,710 | Resistance: $1,760 - $1,780​
 
XAUUSD - gold stays at record lows
Gold positions came under pressure on Friday amid the publication of a stronger report on the US labor market: the Unemployment Rate remained at 3.6%, while Employment Change rose by 372 thousand, well ahead of the projected 268 thousand, which allows investors to hope for continued tightening of monetary policy by the US Federal Reserve. According to the CME FedWatch indicator, more than 92% of traders are confident in the "hawkish" rhetoric at the next meeting of the regulator, as well as in the adjustment of the value by 75 basis points at the end of this month.

gold-2.png


Bollinger Bands in D1 chart demonstrate a stable decrease. The price range is expanding, making way to new record lows for the "bears". MACD is going down, keeping a fairly stable sell signal (located below the signal line). Stochastic has reached its lows and is trying to reverse upwards, indicating risks of oversold instrument in the ultra-short term.

Resistance levels: 1752.87, 1775, 1784.31, 1800 | Support levels: 1730, 1720, 1700

gold-1.png
 

Silver - A fall is possible.​

If the assumption is correct, the pair XAGUSD will fall to the levels of 18.4–15.77. In this scenario, critical stop loss level is 20.2.

silver.png
 
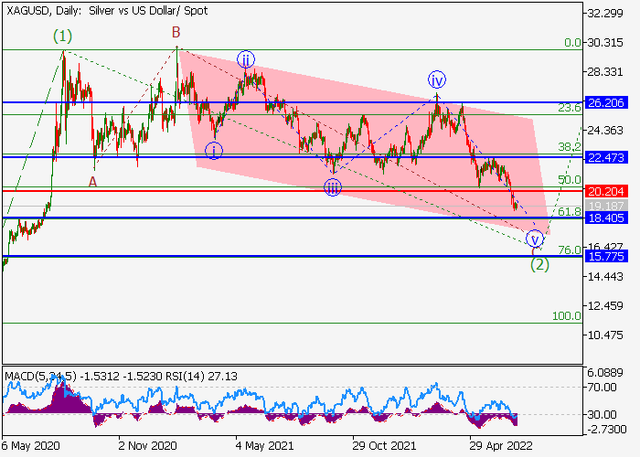
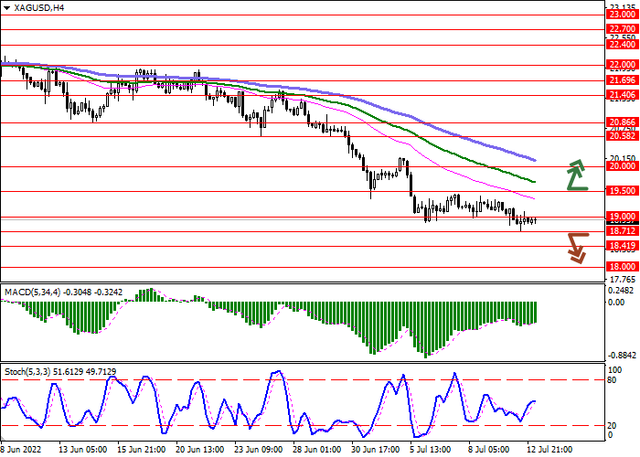
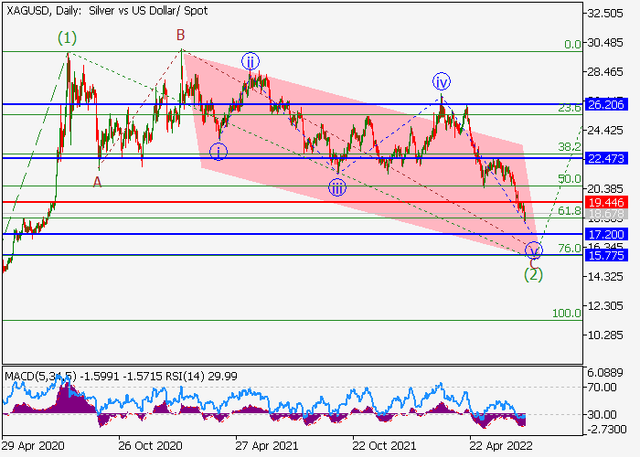
Silver - the instrument is developing correctional dynamics

Trading activity remains subdued this morning as analysts await the publication of key macroeconomic statistics on US consumer inflation for June, the current forecasts for which suggest acceleration from 8.6% to 8.8%, which will be a new record since December 1981. Faster growth is also not ruled out, which could put significant pressure on the US Federal Reserve when choosing the next measures to tighten monetary policy. The regulator's meeting will be held next week, and at the moment a rate hike of 50 or 75 basis points is expected. About 10% of analysts suggest an increase of 100 basis points at once, but this is possible only in the event of a sharp acceleration of inflation in the country.

Additional pressure on the positions of silver is exerted by the situation with the incidence of coronavirus in China, where outbreaks of infections are still observed, which, coupled with the policy of "zero tolerance", leads to new quarantine restrictions, which, in turn, are causing the fall in demand for industrial goods, as well as raw materials, including oil, copper and silver.

silver-1.png


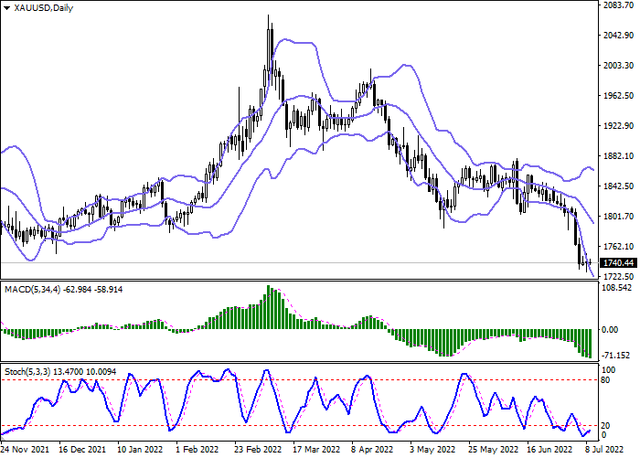
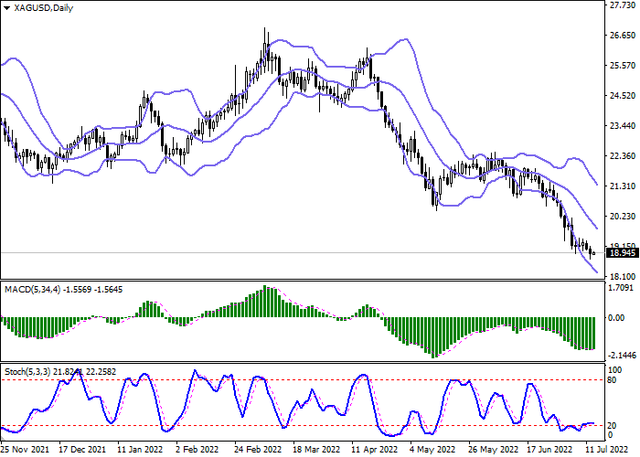
Bollinger Bands in D1 chart demonstrate a stable decrease. The price range is almost unchanged, but it remains rather spacious for the current level of activity in the market. MACD indicator tries to reverse to growth and to form a new buy signal (the histogram should consolidate above the signal line). Stochastic is showing a similar trend, trying to retreat from its lows, signaling that silver is oversold in the ultra-short term.

Resistance levels: 19, 19.5, 20, 20.58 | Support levels: 18.71, 18.41, 18, 17.5

silver-2.png
 
Gold is ready for a local reversal

There are only three most liquid equivalent assets in the global economy: the US dollar, oil, and gold. When one of them rises sharply, the other two always fall, which is what is happening now: the oil price has fallen below 100, and gold quotes are approaching 1700. This situation cannot last long: the issue of the US currency causes an increase in inflation, which has already exceeded 9.0%, which means that the purchasing power of the population has decreased again, and this will lead to a drop in demand for the dollar, which will provoke an increase in oil and gold.

gold.png


On the daily chart of the asset, the price is moving within the global downward channel. Technical indicators maintain a sell signal, not excluding a slight correction: fast EMAs on the Alligator indicator are below the signal line, and the AO oscillator histogram has formed the first rising bar in the sell zone.

Resistance levels: 1745, 1786 | Support levels: 1707, 1685​
 
XAUUSD - The pair is in a correction, a fall is possible.

On the daily chart, a downward correction develops as the fourth wave of the higher level (4), within which the wave C of (4) forms. Now, the fifth wave v of C is developing, within which the third wave of the lower level (iii) of v of C is ending the formation.

If the assumption is correct, after the end of the correctional wave (iv) of v of C, the XAUUSD pair will fall to the levels of 1681.1–1621.9. In this scenario, critical stop loss level is 1811.8.

oil.png
 
Silver - The probability of decline remains.

On the daily chart, there is a downward correction of the higher level as the second wave (2), in which wave C of (2) is formed. At the moment, the fifth wave v of C is developing, which includes wave (v) of v.

If the assumption is correct, XAGUSD will fall to the levels of 17.2 – 15.77. The level of 19.44 is critical and stop-loss for this scenario.

silver.png
 
Back
Top