Precious Metals updates by Solid ECN

gold-forum-1.png


On the daily chart, the fifth wave of the higher level (5) of 3 develops, within which the wave 3 of (5) formed, and a downward correction developed as the fourth wave 4 of (5). Now, the formation of the fifth wave 5 of (5) has started, within which the first entry wave of the lower level (i) of i of 5 is developing.

If the assumption is correct, the price will grow to the levels of 2000 – 2070.42, In this scenario, critical stop loss level is 1785.69.

gold.png
 
silver-forum-1.png


The escalation of the conflict in Ukraine, high rates of global inflation, and lower forecasts for the recovery of the economies of developed countries create obstacles for further upward dynamics in the XAGUSD pair. However, analysts predict a 5% increase in silver demand in 2022 due to further structural progress in industrial production, which is expected to reach another record level this year, and jewelry sales growth after the coronavirus pandemic. On the supply side, higher mine productivity is expected due to increased production capacity and increased production at existing mines, leading to a 3% increase in global supply in 2022.

Thus, it can be assumed that the fall in metal prices will be stopped when geopolitical tensions decrease and the US Federal Reserve rate stabilizes in a specific target range. Up to this point, the growth of XAGUSD quotes should be taken as a correction.

From the technical analysis position, silver is trading in a long-term downtrend, in which market participants reached the support level of 20.57. Then the RSI technical indicator signaled that the instrument was in the oversold zone, which led to the development of a correction, in which market participants tested the resistance level of 22.2. As long as this level is held by the "bears," further sales of the precious metal will be a priority. The target for short positions will be the May low. If 22.2 is broken upwards and the consolidation above, we should expect the quotes to rise to the next resistance level of 24.25.

silver-1.png


As part of the medium-term downtrend, market participants reached the target zone 3 (21.24–21.05) but failed to consolidate below it, after which a correction began, in which market participants tested the key resistance of the trend at 22.32–22.15. Currently, the zone is holding, which signals the possibility of new sales with the target at the May low of around 20.50.

Resistance levels: 22.20, 24.25 | Support levels: 20.57, 19.61​
Thank you very much for your analysis and insights. I am eyeing 20.40-50 levels for XAG to go long and, hopefully, will not have to wait too long.
 
gold-forum-1.png


Gold prices show quite active growth during the Asian session, recovering to the previous local highs, updated last week. The instrument is testing 1860 for a breakout, receiving support from a rather weak dollar. However, the USD Index is up 0.05% intraday at 101.68, rebounding from Friday's monthly low of 101.43, as markets weigh Friday's US data to predict the next move by the US Fed. Demand for gold remains stably high, given that the fundamental picture in the markets is changing slightly. Investors are still watching the development of the Russian-Ukrainian conflict, which has generated many additional risks and does not yet give any hope for a quick improvement in the situation.

The pressure on the US currency increased last week amid the incident in the Persian Gulf. Earlier, the Greek authorities seized a tanker with Iranian oil, after which they handed it over to the United States. Iran responded to this by detaining two Greek tankers, which could lead to a new escalation of tension in the Middle East. At the same time, as monetary policy tightens in various regions, the demand for risk is gradually recovering, putting pressure on "safe" gold.

gold-1.png


Bollinger Bands in D1 chart demonstrate flat dynamics. The price range expands from above, freeing a path to new local highs for the "bulls". MACD is growing preserving a weak buy signal (located above the signal line). Stochastic, on the contrary, maintains a confident downward direction and at the moment practically does not react to the resumption of growth.

Resistance levels: 1869.49, 1885, 1900, 1930 | Support levels: 1850.2, 1840.26, 1823.09, 1800

gold-2.png
 
silver-forum-1.png


On the daily chart, a downward correction of the higher level develops as the second wave (2), within which the wave C of (2) forms. Now, the fourth wave of the lower level iv of C has formed, and the fifth wave v of C is developing, within which a local correction of the lower level is ending to form as the wave (iv) of v.

If the assumption is correct, after the end of the correction, the price will fall to the levels of 18.4 –15.6. In this scenario, critical stop loss level is 23.2.

silver.png
 
silver-forum-1.png


Silver prices show a slight decrease during trading in Asia, developing a corrective momentum formed at the beginning of the current trading week. XAGUSD is testing 21.45 for a breakdown. Risk-driven market sentiment continues to shift to equities as yields rise on US government bonds, which investors currently prefer as alternative sources of additional funds, putting pressure on safe-haven assets such as silver. Since the dynamics of asset quotes of the metal group is inversely proportional to the movement of the US currency, XAGUSD is actively losing value.

Optimistic macroeconomic statistics from the USA provided moderate support to USD on Tuesday. The S&P/Case-Shiller Home Price Indices accelerated from 20.3% to 21.2% in March, ahead of market forecasts of a decline to 20%, and the Chicago PMI strengthened from 56.4 to 60.3 points in May, while the market expected a slight decline to 55 points. At the same time, Dallas Fed Manufacturing Business Index fell from 1.1 to -7.3 points in May, contrary to the forecast of growth to 4.9 points.

Silver, in turn, reacts positively to the long-awaited reopening of manufacturing facilities in Shanghai from June 1. Only 67 new cases of COVID-19 infection were detected in the country's largest financial center last Sunday, according to the Ministry of Health of the People's Republic of China. The authorities also eased some quarantine restrictions in Beijing. In general, the pace of industrial production in China is recovering, which increases the demand for silver as an industrial raw material.

silver-1.png


Bollinger Bands in D1 chart show moderate growth. The price range is narrowing, reflecting ambiguous dynamics of trading in the short term. MACD is declining, forming a new sell signal (trying to consolidate below the signal line). Stochastic keeps a steady downward direction but is rapidly approaching its lows, which indicates the risks of oversold silver in the ultra-short term.

Resistance levels: 21.69, 22, 22.40, 22.7 | Support levels: 21.39, 21.12, 20.81, 20.39

silver-2.png
 
gold-forum-1.png


The XAUUSD pair holds above the key level of the previous 1800 and are currently being corrected after a slight increase.

Despite significant fluctuations in world markets, precious metals remain one of the most reliable investments. If traders preferred contracts for gold a year ago, today, buyers are showing particular interest in bullion and coins. According to the US Mint, sales of the most popular American Golden Eagle series in May of this year significantly exceeded previous periods: 200.5K coins or 147K ounces of gold equivalent were sold, significantly higher than 122.5K or 88K ounces sold in April. Also, if we consider the dynamics of sales in May 2021 with a figure of only 20.5K ounces, then the positive trend becomes more and more obvious.

According to the latest report from the US Commodity Futures Trading Commission (CFTC), over the past week, the global downtrend for the precious metal has been reversed, and after six weeks of constant decline, an increase in the number of gold contracts was recorded to 183.8K from 175.4K, which is quite expected, given the sharp outflow of short swap dealers, which was reported a week earlier.

gold.png


On the daily chart, the price is moving within the global ascending channel, forming a reversal near the global support line. Technical indicators maintain a weakening sell signal: fast EMAs on the Alligator indicator are approaching the signal line, and the AO oscillator histogram forms upward bars in the sell zone.

Resistance levels: 1866, 1917 | Support levels: 1810, 1770​
 
silver-forum-1.png


On the daily chart, a downward correction of the higher level develops as the second wave (2), within which the wave C of (2) forms. Now, the fourth wave of the lower level iv of C has formed, and the fifth wave v of C is developing, within which a local correction of the lower level has ended as the wave (iv) of v.

If the assumption is correct, the pair XAGUSD may fall to the levels of 18.40 - 15.6. In this scenario, critical stop loss level is 23.2.

silver.png
 
gold-forum-1.png


Gold prices are holding around 1840 during the Asian session, trying to correct after a slight decline on Monday. XAUUSD remains under pressure after the release of fairly strong data from the US labor market: employment rose by 390K, which is better than the projected value of 325K, and the Unemployment Rate, instead of the expected decline to 3.5%, remained at 3.6%. The statistics highlighted the stability of the sector and its readiness to cope with the increase in interest rates from the US Federal Reserve, which may contribute to further tightening of monetary policy. In addition, the uptrend in the yield of 10-year US bonds makes the dollar an extremely attractive asset for investment.

An additional negative factor for gold is the current position of the European Central Bank (ECB). The regulator has recently been actively speaking out in favor of raising interest rates in order to curb the sharp rise in inflation. The ECB will meet on Thursday, and some analysts believe that it will announce the start of a reduction in the quantitative easing (QE) program. An increase in the interest rate, according to current forecasts, is possible in Q3 2022, provided that the situation in the markets does not change radically.

gold-1.png


Bollinger Bands in D1 chart demonstrate flat dynamics. The price range is slightly narrowing from below, reflecting the mixed dynamics of trading in the short term. MACD is declining, forming a new sell signal (trying to consolidate below the signal line). Stochastic shows a slightly more active decline and at the moment does not contradict the further development of the downtrend in the short and/or ultra-short term.

Resistance levels: 1850.2, 1869.49, 1885, 1900 | Support levels: 1823, 1800, 1775, 1752.87

gold-2.png
 
silver-forum-1.png


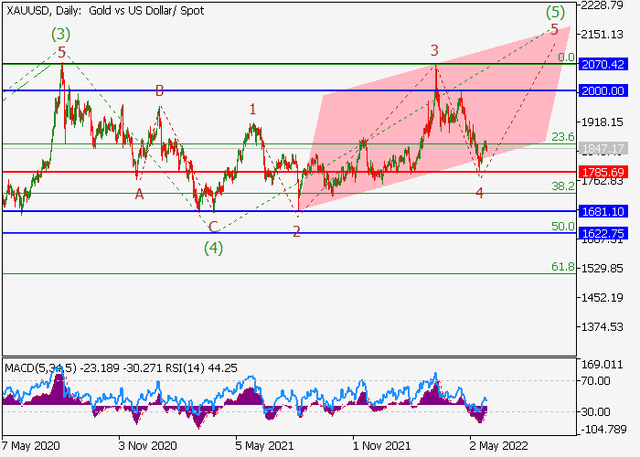
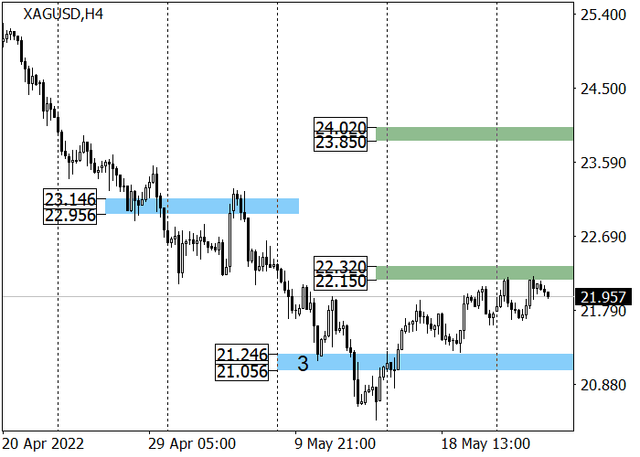
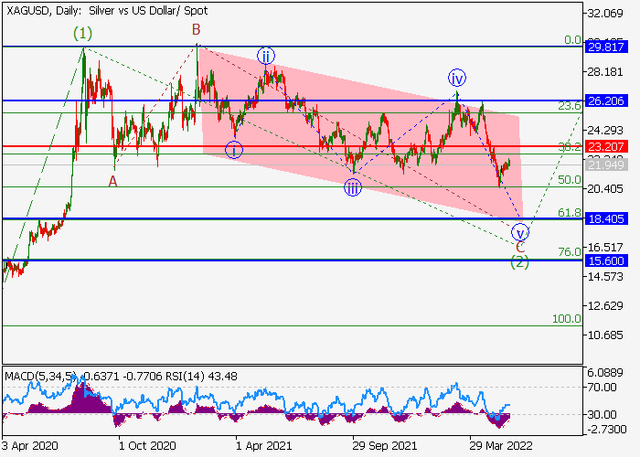
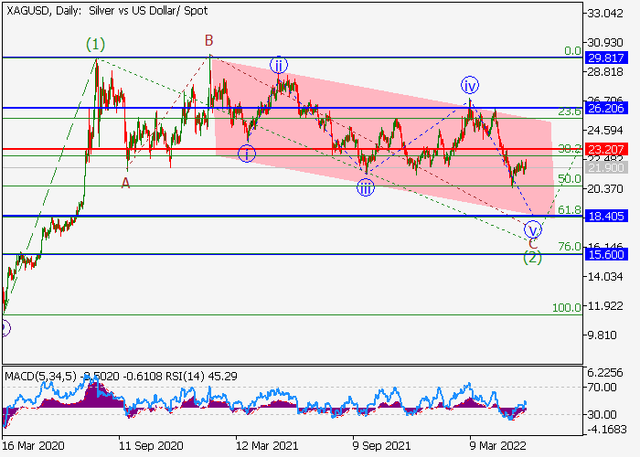
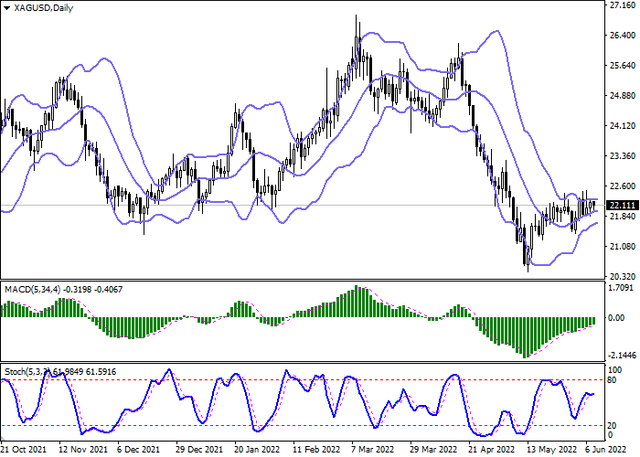
Silver is trying to recover its positions

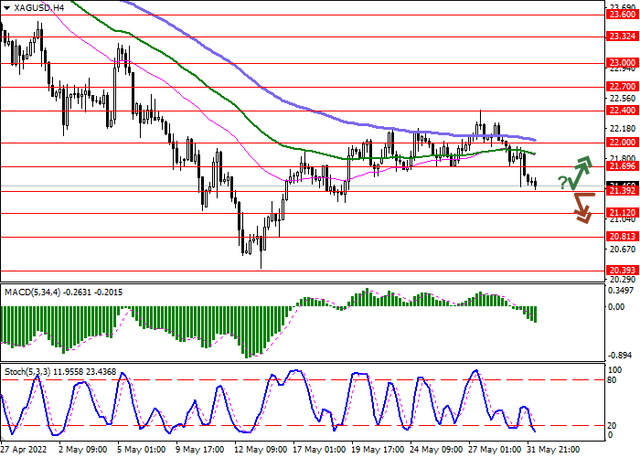
Silver prices are moderately declining during the morning session, again testing 22 for a breakdown. The day before, the instrument made another attempt to grow, reacting to a corrective decline in the yield of US Treasury bonds, which retreated from their previous highs at 3.038% to 2.979%.

At the same time, trading participants are in no hurry to open new trading positions for the instrument, preferring to wait for the decisions of major global financial regulators on monetary policy issues. In particular, a meeting of the European Central Bank (ECB) will be held this week, at which, as expected, the regulator may announce the start of a quantitative tightening program, and next week the key issues will be discussed by the US Federal Reserve and the Bank of England, from which the market expects a "hawkish" rhetoric. In turn, the Bank of Japan, judging by the recent comments of its Governor Haruhiko Kuroda, will maintain a soft position.

Moderate demand for silver is also supported by the gradual recovery of industrial activity in China. However, the situation is ambiguous here, as growth in Asia may be offset by a noticeable drop in industrial activity in Europe, where supply chain disruption, high inflation and rising energy prices are causing many factories to stop working. Disruptions are especially noticeable in high-tech areas, where the use of silver as a raw material has always occupied a fairly high percentage.

Although the number of positions in gold for the last week began to gradually increase, the statistics for silver remains at the levels of the previous week. According to the latest report from the US Commodity Futures Trading Commission (CFTC), the advantage in open positions remains in favor of sellers (37.877K positions), while buyers have only 7.797K open contracts. In addition, last week, buyers liquidated 0.926K positions, while sellers, on the contrary increased their number by 0.997K.

silver-1.png


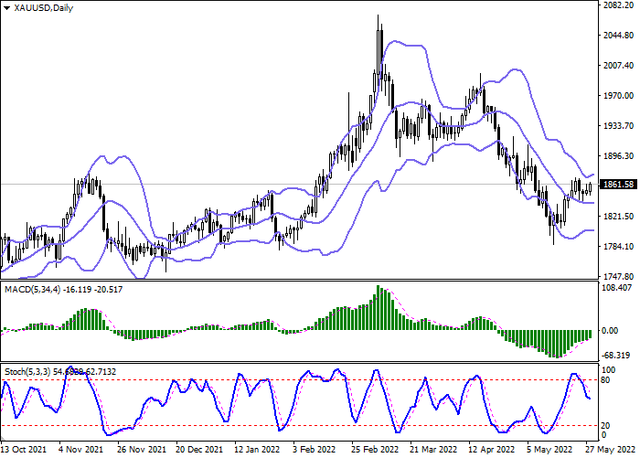
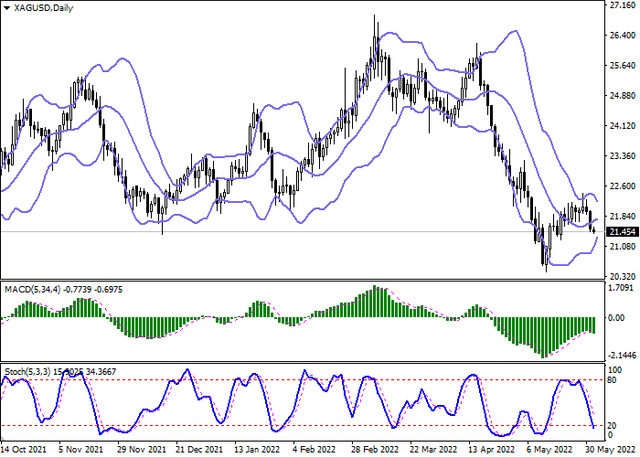
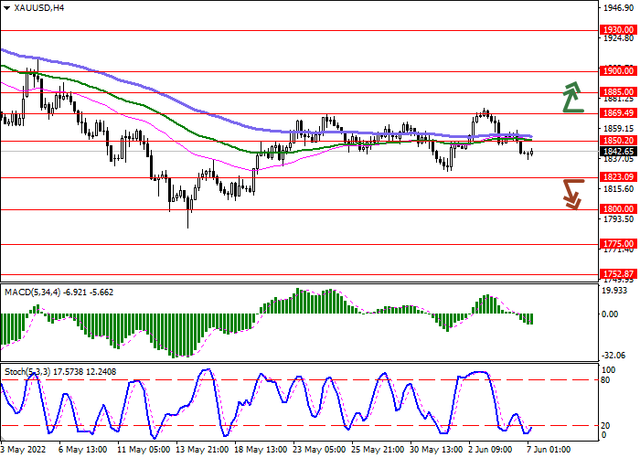
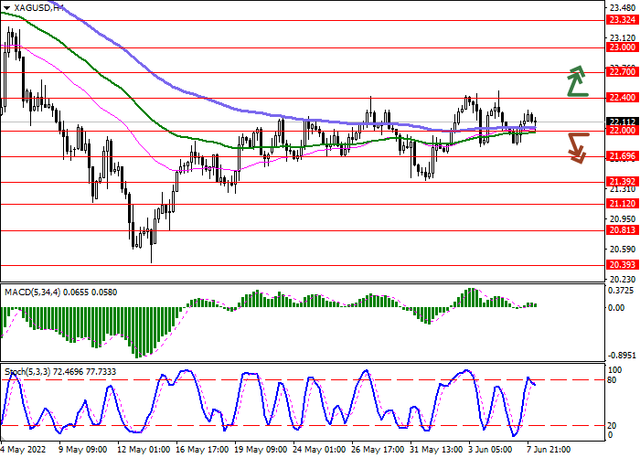
On the D1 chart, Bollinger Bands are gradually reversing horizontally. The price range is slightly narrowed from below, being spacious enough for the current activity level in the market. MACD is growing preserving a weak buy signal (located above the signal line). Stochastic, having not reached its boundary level of "80", reversed into a horizontal plane, reacting to the emergence of "bearish" trend during the Asian session.

Resistance levels: 22.40, 22.7, 23, 23.32 | Support levels: 22, 21.69, 21.39, 21.12

silver-2.png
 
gold-forum-1.png


The XAUUSD pair is correcting within a sideways trend, trading at 1850 with no signs of a possible change in the current trend.

Yesterday, the World Gold Council (WGC) published a new report on government stocks from March to April 2022. Thus, Turkey's reserves increased by 6.5 tons to 436.7 tons, Kazakhstan – by 5.3 tons, and the total volume reached 373.4 tons of metal, while Uzbekistan's reserves were replenished by 8.7 tons to 346.2 tons. Only the Philippines should be singled out among the major sellers during this period, which managed to sell 5 tons of the precious metal, reducing the available resources to 151.3 tons.

The data released yesterday by the US Commodity Futures Trading Commission (CFTC) disappointed the experts. According to the report, at the beginning of this month, investors reduced the number of net speculative positions in gold to 172.6K from 183.8K, although a week earlier, the figure for the first time in the last two months increased from 175.4K to 183.8K.

As a result, even with an increased interest in physical gold from the central banks, the demand for contracts from market participants continues to remain low, which does not allow the quotes of the XAUUSD pair to strengthen their positions.

gold.png


The daily chart shows that the price is moving within the global ascending channel, near the support line. Technical indicators maintain a weakening sell signal: fast EMAs on the Alligator indicator are approaching the signal line, and the AO oscillator histogram, being in the sell zone, is forming upward bars.

Resistance levels: 1870, 1917 | Support levels: 1836, 1790​
 
Back
Top