Precious Metals updates by Solid ECN

silver-forum.png

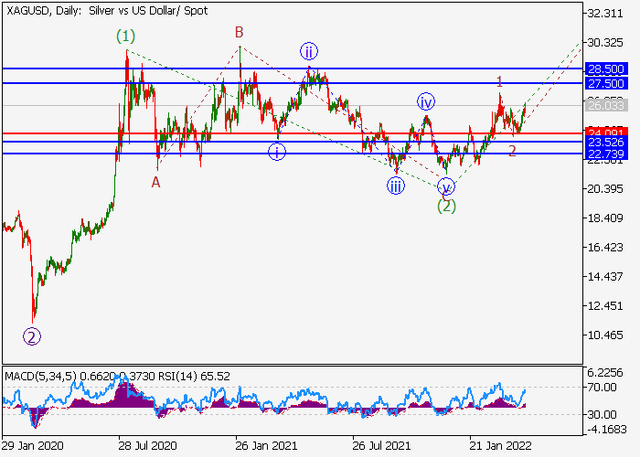
Silver prices show a weak increase during the Asian session, retesting the level of 25.50. The instrument has been developing a fairly active uptrend since April 6, retreating from local lows since the end of last month and receiving support from statistics on record inflation in the world. Given the high Consumer Price Index in the US, which reached 8.5% in March, as well as the growing geopolitical uncertainty against the backdrop of the development of the Russian-Ukrainian conflict and severe anti-COVID restrictions in China, the demand for defensive assets remains elevated.

Macroeconomic statistics released the day before showed an increase in annual consumer inflation in the US to 8.5%, which was a new record high for 41 years. At the same time, a sharp tightening of the US Federal Reserve's monetary policy is expected in May: in addition to the expected rate hike by 50 basis points at once, a quantitative tightening program may also be launched to correct its balance.

Additional support for the metal comes from the prospect of a gradual lifting of COVID restrictions in China, while the restoration of industrial activity. The Chinese authorities announced the easing of a number of quarantine measures in parts of Shanghai, which will affect almost 5 million people, since there were no new cases of coronavirus infection over the past two weeks. Silver, unlike gold, is more actively used in industry, and therefore reacts sharply to such factors.

silver-1.png


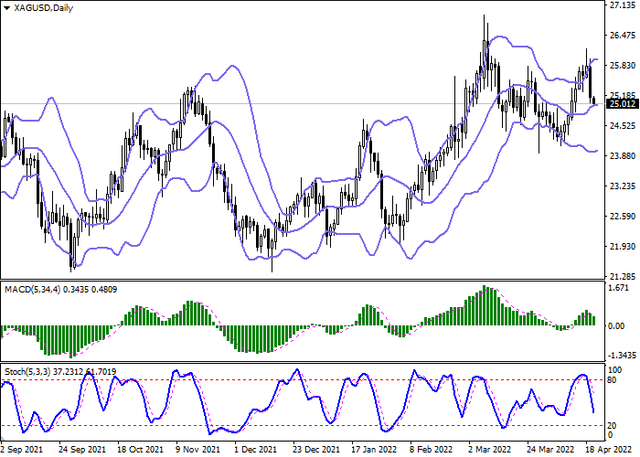
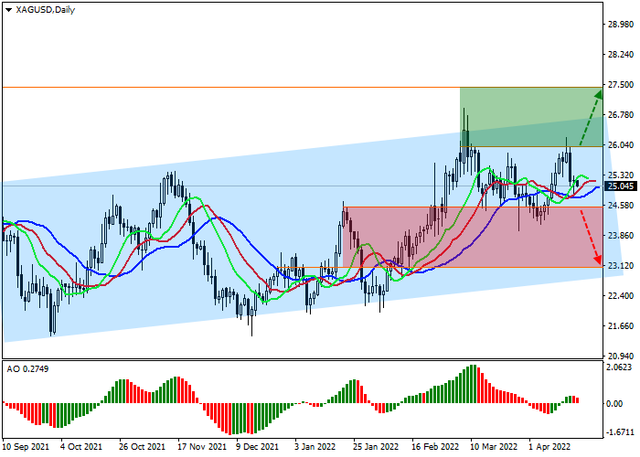
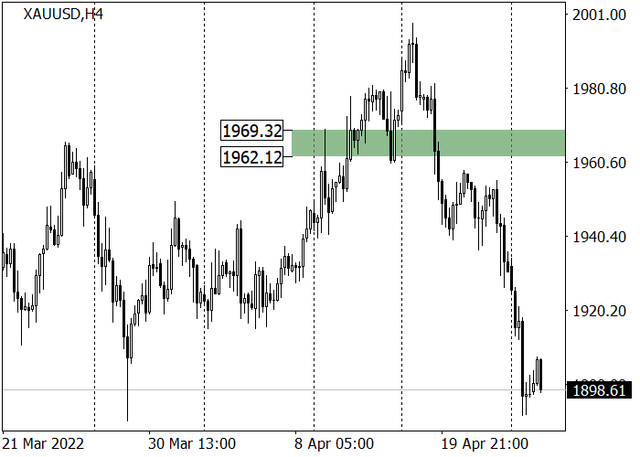
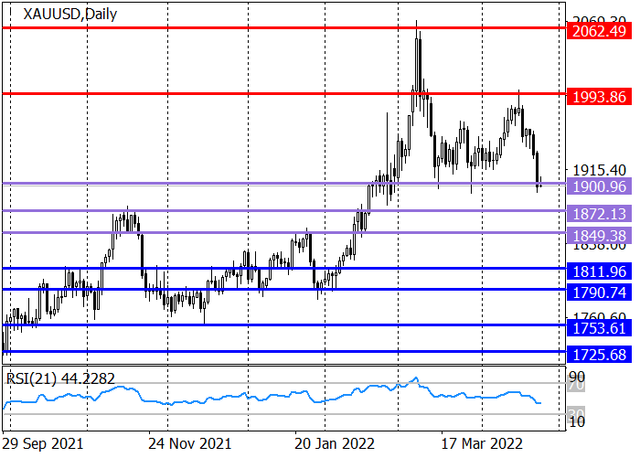
Bollinger Bands in D1 chart demonstrate flat dynamics. The price range remains practically unchanged, limiting the development of "bullish" dynamics in the short term. MACD grows, preserving a stable buy signal (located above the signal line). Stochastic is showing similar dynamics; however, the indicator line is already approaching its highs, indicating the risks of overbought instrument in the ultra-short term.

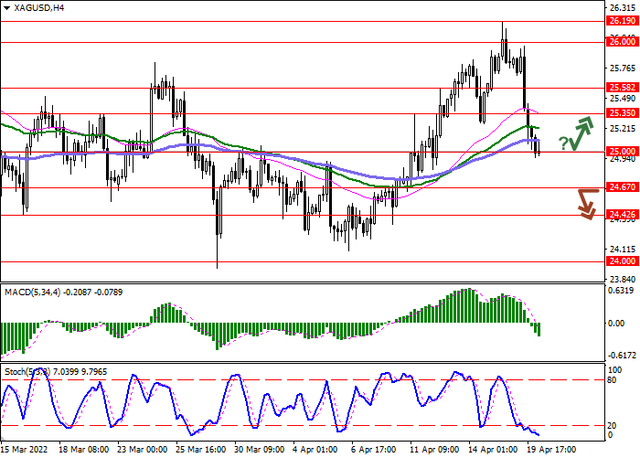
Resistance levels: 25.58, 26, 26.27, 26.57 | Support levels: 25.35, 25, 24.67, 24.42

silver-2.png
 
gold-link.png

XAUUSD is correcting upwards at 1973. Yesterday, the World Gold Council (WGC) published a report on the state of the market in Q1 2022, which noted a clear positive momentum for the price of the precious metal.

According to the published report, the main influence on the quotes was the increased demand from ETF funds and private investors. In particular, the volume of gold held by ETF funds increased by 269 tons in the quarter alone compared to data at the end of 2021, which is the most dynamic increase since 2020. In addition, the US Mint noted the increased interest of market participants in bullion gold coins in Q1 2022, with total sales of 518K troy ounces, showing a record pace since 1999.

High demand for contracts is also confirmed by data from the US Commodity Futures Trading Commission (CFTC). According to last week's report, the number of net speculative positions in gold was 245.5K, well above the average of 200K at the end of January this year.

In addition, investors continue to evaluate data on March inflation in the United States, which reflected an increase in consumer prices by 8.5% in annual terms, which is the highest value since December 1981. At the same time, core inflation, excluding food and energy prices, slowed down somewhat compared to the February level. Now the market is waiting for decisive steps from the US Federal Reserve. In particular, the interest rate is expected to be raised by 50 basis points at once at the meeting in May.

gold.png


On the daily chart of the asset, the price is correcting within the global rising channel, being near the resistance line. Technical indicators maintain the buy signal: fast EMAs on the Alligator indicator again began to expand the range of fluctuations in the direction of growth, and the histogram of the AO oscillator moved into the buy zone, forming the first bar above the transition level.

Support levels: 1958, 1915 | Resistance levels: 1983, 2050
 
gold link.png

XAUUSD, The pair may grow.

On the daily chart, the third wave of the higher level 3 of (5) develops, within which the wave iii of 3 forms. Now, the third wave of the lower level (iii) of iii is developing, within which the wave iii of (iii) has formed, the correctional wave iv of (iii) has ended, and the wave v of (iii) is developing.

If the assumption is correct, the pair will grow to the levels of 2100 - 2200. In this scenario, critical stop loss level is 1890.45.

gold.png
 

1.png


XAUUSD shows moderate growth during the morning session, updating local highs from March 14. The "thin" market encourages the purchase of safe assets, so the US dollar and gold strengthen their positions. The precious metal is moving higher for the second week in a row, as statistics on consumer prices in the US, where inflation in March reached 8.5% on an annualized basis, which is the highest since 1981, increases the attractiveness of XAUUSD for hedging risks in anticipation of the next financial crisis. The situation on the market changes little, as the news background after the Easter week remains quite calm.

Demand for the metal is supported by general tension, which is expressed primarily by investors' concern about global inflation rates. Due to the military conflict in Ukraine and subsequent sanctions against the Russian economy, energy quotes rushed up sharply, which provoked an increase in consumer and production prices in the global economy, which had just begun to recover from the period of the coronavirus pandemic. Under these conditions, gold actively added in price. In turn, an increase in the yield of treasury bonds, as well as expectations of further tightening of monetary policy by the US Federal Reserve, is holding back "bullish" sentiment on the instrument. Monthly bonds showed the maximum increase, having added 8.68% and amounted to 0.4108%, while the yield on 10-year bonds increased by 2.01% to 2.864%.

Today's macroeconomic statistics from China did not support the instrument significantly. GDP in Q1 2022 showed a slowdown from 1.5% to 1.3%, which, however, turned out to be noticeably better than the expected 0.6%, while in annual terms, the Chinese economy accelerated from 4.0% to 4.8%, ahead of analysts' forecasts at 4.4%.

gold-1.png


Bollinger Bands in D1 chart show moderate growth. The price range is expanding but it fails to conform to the surge of "bullish" sentiments at the moment. MACD indicator is growing keeping a buy signal (located above the signal line). Stochastic retains an upward direction but is located in close proximity to its highs, which indicates the overbought instrument in the ultra-short term.

Resistance levels: 2000, 2015.3, 2030, 2050 | Support levels: 1974.22, 1952.53, 1930, 1900

gold-2.png
 
silver-link.png


On the daily chart, the development of the third wave of the higher level (3) of 3 started, within which the first wave of the lower level 1 of (3) formed, and a local correction ended as the wave 2 of (3). Now, the development of the third wave 3 of (3) has started, within which the first wave of the lower level i of 3 is forming.

If the assumption is correct, the price will grow to the levels of 27.5 - 28.5. In this scenario, critical stop loss level is 24.09.

silver.png
 
silver-link.png


Silver prices show a moderate decline during the Asian session, developing a strong "bearish" momentum formed the day before. The instrument is testing the level of 25 for a breakdown, updating local lows from April 12.

High US bond yields approaching multi-year highs (10-year bonds are trading around 2.95%), as well as the growth of the USD Index to the peaks of April 2020, are probably the main reasons why the "bulls" decided to take their profits. In addition, traders expect an early tightening of monetary policy by the US Federal Reserve. The rate hike by 50 basis points, as well as the launch of the quantitative tightening program are expected already during the May meeting of the regulator. What is more, St. Louis Fed Chair James Bullard said on Monday that he is open to the theoretical possibility of a rate hike of up to 75 basis points at once, although this will not be considered a "main scenario".

Pressure on silver quotes is also exerted by not the most confident macroeconomic statistics from China. Data published earlier in the week showed a slowdown in Industrial Production in China in March from 7.5% to 5%, which, however, turned out to be better than market expectations at the level of 4.5%. Analysts attribute the slowdown in manufacturing activity in China to a new outbreak of coronavirus, as a result of which the Chinese authorities announced the introduction of quarantine in a number of provinces, following the policy of "zero tolerance".

silver-1.png


In the D1 chart, Bollinger Bands are reversing horizontally. The price range is almost unchanged, but it remains rather spacious for the current level of activity in the market. MACD is going down, keeping a fairly stable sell signal (located below the signal line). Stochastic shows a more confident decline, but is quickly approaching its lows, indicating the growing risks of the oversold pound in the ultra-short term.

Resistance levels: 25.35, 25.58, 26, 26.19 | Support levels: 25, 24.67, 24.42, 24

silver-2.png
 
silver-2.png


After reaching local highs of around 26 dollars per ounce, the quotes of the trading instrument show a local sideways trend and are now around 25.05.

The XAGUSD pair is preparing to continue growing against the backdrop of a positive report from the Silver Institute on the state of the precious metal market and experts' forecasts for the current year. Thus, in 2021, global industrial demand amounted to 508.2M ounces, adding 9% to the value of the previous year, while silver bullion sales increased immediately by 36% to 278.7M ounces, the highest figure in the last seven years, and total demand for the year increased 19% to 1.05B ounces.

As for the forecast for 2022, analysts expect continued positive dynamics and investor interest in the assets of the metal group. Industrial demand for silver is estimated to increase by 6% to 539.6 M ounces, while overall supply could rise by 3% to 1.03B ounces. In general, the overall forecast for the year is positive, and according to the specialists of the Silver Institute, the deficit in the world market will be about 70M ounces.

silver.png


The price moves within the global ascending corridor, declining after reaching the resistance line. Technical indicators keep a buy signal, but their readings work out a local correction: indicator Alligator's EMA fluctuations range began to narrow, and the histogram of the AO oscillator forms downward bars in the buying zone.

Resistance levels: 26, 27.4 | Support levels: 24.55, 23.1[/JUSTIFY]
 
gold-1.png


On the daily chart, the third wave of the higher level 3 of (5) develops, within which the wave iii of 3 forms. Now, the third wave of the lower level (iii) of iii is developing, within which the wave iii of (iii) has formed, the correctional wave iv of (iii) has ended, and the wave v of (iii) is developing.

If the assumption is correct, the pair will grow to the levels of 2100 - 2200. In this scenario, critical stop loss level is 1890.45.

gold.png
 
silver-1.png


On the daily chart, the development of the third wave of the higher level (3) of 3 started, within which the first wave of the lower level 1 of (3) has formed, and a local correction develops as the wave 2 of (3). Now, the wave c of 2 is developing, within which the first wave of the lower level (i) of c of 2 has formed.

If the assumption is correct, after the end of the correctional wave (ii) of c the price will fall to the levels of 23.52 - 22.73. In this scenario, critical stop loss level is 25.25.

silver.png
 
gold-forum-1.png


The XAUUSD pair is actively losing value against the background of strengthening the position of the US currency on the eve of the May meeting of the US Fed, at which the parameters of the current monetary policy can be significantly adjusted in order to combat record inflation, which reached 8.5% compared to March 2021. Analysts expect an interest rate increase of 0.5%.

Another important factor that has a serious negative impact on gold quotes is the difficult epidemiological situation in China. Official authorities report an outbreak of COVID-19 in Beijing, which again threatens a large-scale lockdown and will lead to a noticeable reduction in industrial production. Earlier, 22 non-imported cases of coronavirus infection were detected in the capital, against this background, the country's authorities ordered mandatory testing of the population in the districts of Beijing, and not which of them were closed according to the results of the inspection. This led to a fall in Chinese stocks, commodities and the yuan, while the XAU/USD pair declined to the level of 1900.

china-lockdown.png


Strict anti-COVID restrictions can cause serious problems in the supply chains between Asia, the USA and Europe. The congestion of Chinese ports, combined with the military conflict in Ukraine, threatens to inflict a double blow that could undermine the recovery of the national economy, which is already experiencing inflationary pressure. Against this background, the demand for gold is falling, the price is declining, and if the situation with the delivery of goods is not resolved, the downward trend may continue up to the level of 1850 and below.

gold-1.png


The long-term trend remains upward. The key support level is at around 1900.00 and, if it is held, the growth of the XAU/USD pair will continue with a target at the April maximum. Otherwise, it will be possible to expect a decline in quotations to the level of 1850.

gold-2.png


The mid-term trend is downward. Last week, market participants tried to break through the resistance zone 1969.30–1962.10, but without success, and the price returned below the level. The current week began with the achievement of the first sales target in the area of the March minimum in the area of 1890.00. The second target is the zone 1872.40 - 1865.8.

Resistance levels: 1993, 2062 | Support levels: 1900, 1872, 1850​
 
Back
Top