Precious Metals updates by Solid ECN

gold-forum-1.png


The pair grow.
On the daily chart, the fifth wave of the higher level (5) of 3 develops, within which the wave 3 of (5) formed, and a downward correction developed as the fourth wave 4 of (5). Now, the formation of the fifth wave 5 of (5) has started, within which the first entry wave of the lower level (i) of i of 5 has formed, and the correctional wave (ii) of i of 5 is developing.

If the assumption is correct, after the end of the correction, the XAU USD pair will grow to the levels of 2000 – 2070. In this scenario, critical stop loss level is 1785.69.

gold.png

 
gold-forum-1.png


Gold prices show a corrective decline, retreating from their local highs from May 9, updated at the beginning of the week. Investors are taking profits on long positions opened last Friday, when the demand for XAU/USD increased again after the publication of multidirectional macroeconomic statistics on inflation in the US. The released data showed an acceleration of the indicator in May to 8.1%, which was a new record high since December 1981. On a monthly basis, the country's Consumer Price Index accelerated from 0.3% in April to 0.7%, and the Core CPI excluding Food and Energy, slowed down to 6.0% from 6.2%, which is quite obvious, because the reason for the current negative dynamics in the United States is the rise in energy prices.

In turn, the revision of inflation data is likely to lead to a more aggressive policy of the US Federal Reserve, aimed at tightening monetary conditions. In particular, the regulator may decide to either raise interest rates more quickly, for example, by 75 basis points at once, or continue the planned correction of the value after two meetings in June and July. Earlier it was assumed that officials would take a break after two rate hikes in the summer, to assess the impact of the measures taken on the economy and consumer price growth.

gold-1.png


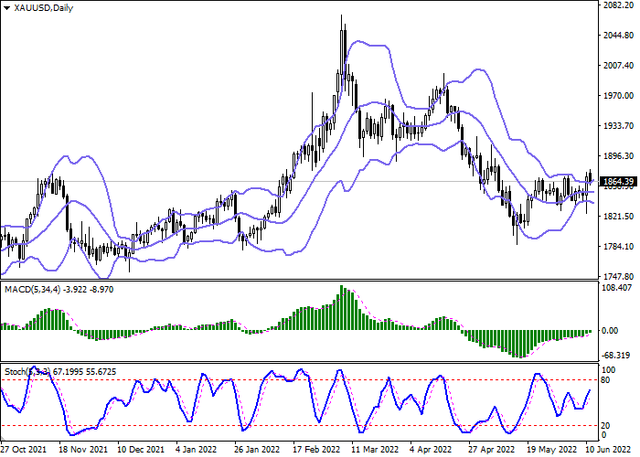
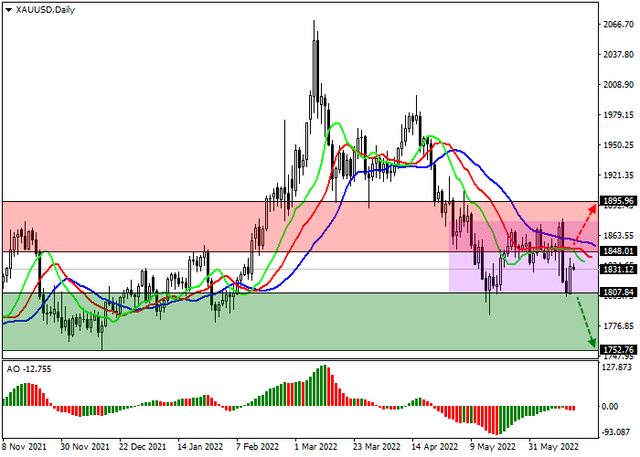
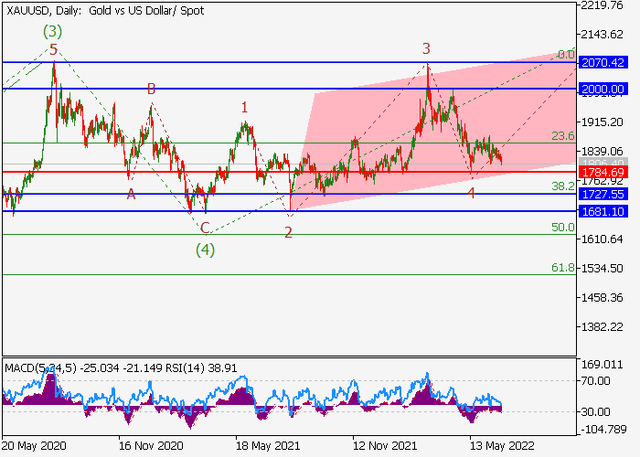
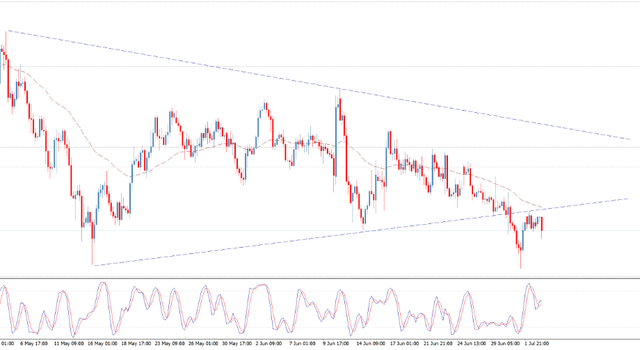
Bollinger Bands in D1 chart demonstrate flat dynamics. The price range is expanding; however, it fails to catch the surge of last week's "bearish" sentiments. MACD is growing preserving a weak buy signal (located above the signal line). Stochastic is showing similar dynamics; however, the indicator line is already approaching its highs, indicating the risks of overbought instrument in the ultra-short term.

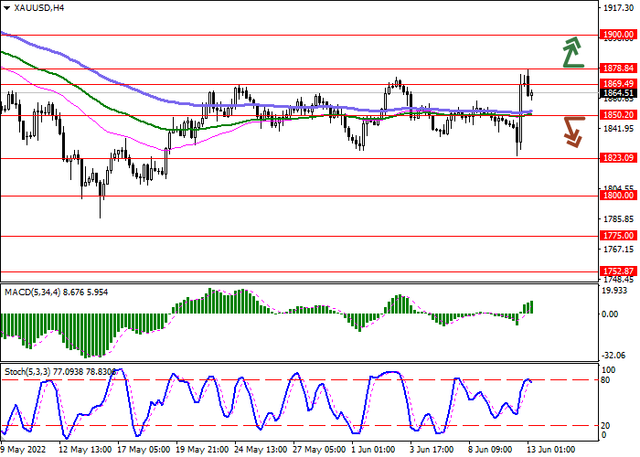
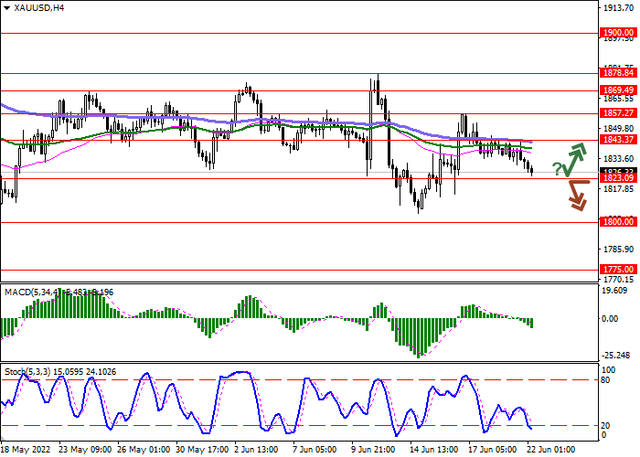
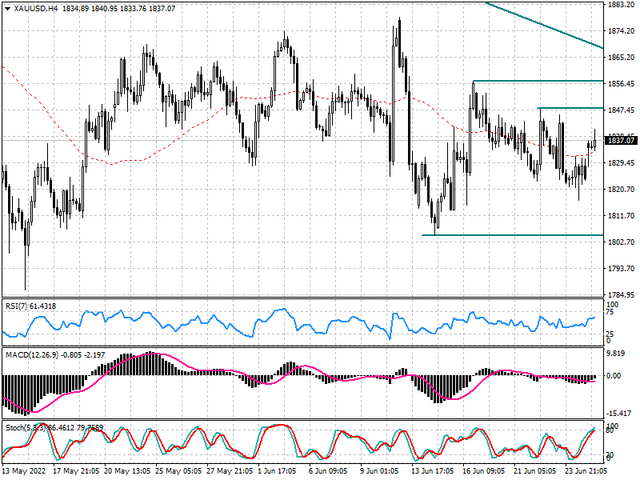
Resistance levels: 1869.49, 1878.84, 1900, 1920 | Support levels: 1850.20, 1823.09, 1800, 1775

gold-2.png
 
silver-forum-1.png


On the daily chart, a downward correction of the higher level develops as the second wave (2), within which the wave C of (2) forms. Now, the fifth wave v of C is developing, within which a local correction of the lower level has formed as the wave (iv) of v, and the development of the wave (v) of v has started.

If the assumption is correct, the XAG USD pair will fall to the levels of 18.4 - 15.6. In this scenario, critical stop loss level is 22.52.

silver.png
 
true-ecn-broker-1.png


XAG USD, silver is trying to recover positions
Silver is trying to recover from a sharp decline at the beginning of the week, when the asset retreated to local lows of May 16. Positive dynamics are due to technical factors and expectations of the US Federal Reserve's decision on interest rates. Experts do not doubt that the US regulator will again increase the cost of borrowing, but the pace of tightening monetary policy is still in question. Previous forecasts suggested a rate hike of 50 basis points. However, after the data on inflation in the country for May was published at the end of last week, the agency may decide to add 75 basis points to the indicator. Additional pressure on the trading instrument is exerted by the growth in the yield of US Treasury bonds: thus, this value for 10-year securities yesterday renewed annual highs for 2022, approaching 3.45%.

The deterioration of the epidemiological situation in China also hurts metal quotes. Only two weeks have passed since the lifting of quarantine restrictions, and Beijing and Shanghai are once again forced to carry out mass testing and restrict the work of enterprises due to a new outbreak of the disease. On Tuesday, the city Health Committee reported that 25 new cases of COVID-19 infection and 38 asymptomatic carriers of the infection were recorded in the capital of the country. Analysts fear that industrial activity in China will again decline, negatively affecting the demand for silver as an industrial raw material.
silver-1.png


On the daily chart, Bollinger bands moderately decrease: the price range expands from below but not as fast as the "bearish" trend develops at the moment. MACD develops a downward trend, maintaining a fairly strong sell signal (the histogram is below the signal line). Stochastic maintains a strong downward direction but rapidly approaches its lows, indicating that silver may become oversold in the ultra-short term.

Resistance levels: 21.21, 21.4, 21.69, 22 | Support levels: 20.86, 20.58, 20.39, 20

silver-2.png

Read more market news
 
true-ecn-broker-1.png


XAU USD, demand for gold remains low
XAU USD is correcting sideways, trading at 1830 and showing no signs of a trend reversal. Gold quotes are in a rather narrow range of 1800 – 1880, having shown a slight increase the day before after the decision of the US Federal Reserve to raise the interest rate from 1.00% to 1.75%, which indicates the market's inability to calculate the consequences of the actions of the American regulator.

In any case, even a local increase in quotes does not mean a global change in trend, which remains negative. This clearly demonstrates the ratio of the positions of sellers and buyers on the stock exchange. According to the latest report of the US Commodity Futures Trading Commission (CFTC), the balance of contracts continues to remain on the side of sellers and, based on current positions, they hold 71.880K contracts, while buyers retain 23.852K contracts. There is a significantly larger gap in the positions of swap dealers: 83.939K contracts were registered for purchase, and 245.231K for sale. In the previous week, however, the dynamics of the change in the balance was in favor of buyers: they liquidated 3.376K positions, while sellers reduced 4.580K positions. Neither side is building up its assets, suggesting low overall demand for the metal.


On the daily chart of the asset, the price is trading within the local side channel, holding in the middle of the range. Technical indicators are in a quite strong sell signal state: the fast EMAs of the Alligator indicator are below the signal line, and the histogram of the AO oscillator is trading in the sell zone, forming descending bars.

Support levels: 1807, 1752 | Resistance levels: 1848, 1895

Read more market news
 
5.png


XAU USD - Metal quotes are developing a downward trend
Investors are in no hurry to open new trading positions ahead of the publication of inflation statistics from the UK, as well as the speech of the head of the US Federal Reserve, Jerome Powell, who, as analysts hope, will outline the immediate prospects for monetary policy. So, some agency representatives said they were not opposed to another rate hike by 75 basis points, and a more conservative position still suggests an increase of only 50 basis points, after which a pause will be required to assess the measures taken.

Quotes of gold, traditionally protective assets, are supported by growing fears about a slowdown in the global economy. Also, the geopolitical risks associated with the development of a military conflict in Ukraine are not weakening yet, while the countries of the world are forced to deal with the consequences of a sharp increase in energy prices. Analysts are confident that rapid inflation on a global scale and a slowdown in economic growth can catalyze stagflation in the US economy, and the US Federal Reserve's measures to tighten monetary policy will be insufficient. It, in turn, will allow gold to regain investor interest and overcome the level of 2000.

An additional negative factor for the metal is the increase in the yield of US Treasury bonds amid expectations of further actions by the American regulator. As new signals for the asset, there is the talk about a possible restriction of Russian gold imports by European countries in the next sanctions packages from the EU. In particular, Denmark has previously announced such a possibility.

gold.png


Resistance levels: 1843.37, 1857.27, 1869.49, 1878.84 | Support levels: 1823.09, 1800, 1775, 1752.87​
 
5.png


Gold price loses momentum
Gold price fluctuates around the EMA50 that forms intraday resistance against the price, noticing that stochastic has positive momentum to reach the overbought areas, waiting to motivate the price to rebound bearishly and resume the bearish trend, which targets 1810 followed by 1780.25 levels as next main stations.

Therefore, our bearish overview will remain valid unless the price rallied to breach 1850 and hold above it.

gold-tech.png


The expected trading range for today is between 1810 support and 1850 resistance.​
 
5.png


XAGUSD, ambiguous dynamics after a sharp decline yesterday
The asset is under pressure due to the strengthening of the US currency in anticipation of the next speech by US Federal Reserve Chairman Jerome Powell, whose rhetoric is likely to favor further tightening monetary policy during the July meeting. As before, the markets do not analyze the very fact of the rate increase but the pace of this growth and the evaluation of the effectiveness of the steps taken earlier. Meanwhile, the Bank for International Settlements (BIS) has called for a more "hawkish" stance from leading financial regulators, despite the risks of a slowdown in macroeconomic indicators: if measures are not taken promptly, this could lead to general stagflation. However, the current rate adjustment in the world's major economies is 1% to 6% below the historical range and is similar to what was recorded in the 1970s, according to a document published by the BIS.

The trading instrument is slightly supported by a corrective decline in the yield of 10-year US Treasury bonds, which on Wednesday morning corrected from 3.207% to 3.172%, as well as inflationary risks in the world's leading economies: for example, in May, price growth in the US accelerated to 8.6%, which is the highest since 1981. Another positive factor for silver is the increase in industrial activity in China, which is gradually increasing the volume of imports and is recovering from the downtime of factories closed for quarantine. Yesterday, Chinese media noted that no new COVID-19 cases were reported in Beijing and Shanghai on Monday for the first time since February 19.

silver-1.png


On the daily chart, Bollinger Bands are steadily declining: the price range is expanding from below, letting the "bears" renew local lows. The MACD indicator is falling, keeping a relatively strong sell signal (the histogram is below the signal line). Stochastic, having made an unsuccessful attempt to reverse upwards at the end of last week, returned to the decline again, indicating that the instrument may become oversold in the ultra-short term.

Resistance levels: 20.86, 21.21, 21.40, 21.69 | Support levels: 20.58, 20.39, 20, 19.5

silver-2.png
 
5.png


XAU USD - The pair may grow.

If the assumption is correct, the XAU/USD pair will grow to the levels of 2000–2070.42. In this scenario, critical stop loss level is 1784.69.

gold.png
 
Gold price shows negative trades now, reinforcing the expectations of continuing the bearish trend in the upcoming sessions, reminding you that we are waiting to visit 1780.25 followed by 1750 levels as next main stations, while holding below 1818 represents the first condition to continue the suggested decline.

The expected trading range for today is between 1780 support and 1825 resistance.

gold.png


The expected trend for today: Bearish
 
Back
Top