• Please try to select the correct prefix when making a new thread in this folder.

    Discuss is for general discussions of a financial company or issues related to companies.

    Info is for things like "Has anyone heard of Company X?" or "Is Company X legit or not?"

    Compare is for things like "Which of these 2 (or more) companies is best?"

    Searching is for things like "Help me pick a broker" or "What's the best VPS out there for trading?"

    Problem is for reporting an issue with a company. Please don't just scream "CompanyX is a scam!" It is much more useful to say "I can't withdraw my money from Company X" or "Company Y is not honoring their refund guarantee" in the subject line.
    Keep Problem discussions civil and lay out the facts of your case. Your goal should be to get your problem resolved or reported to the regulators, not to see how many insults you can put into the thread.

    More info coming soon.

Discuss RoboForex.com

General discussions of a financial company
Defining the Market State and Possible Reversals with DeMarker Indicator

Author: Victor Gryazin

roboforex-header.jpg


Dear Traders,

In this review, we will get acquainted with the DeMarker indicator. It was created for exchange trading by a famous trader and the guru of tech analysis Thomas DeMark.

DeMarker description and peculiarities

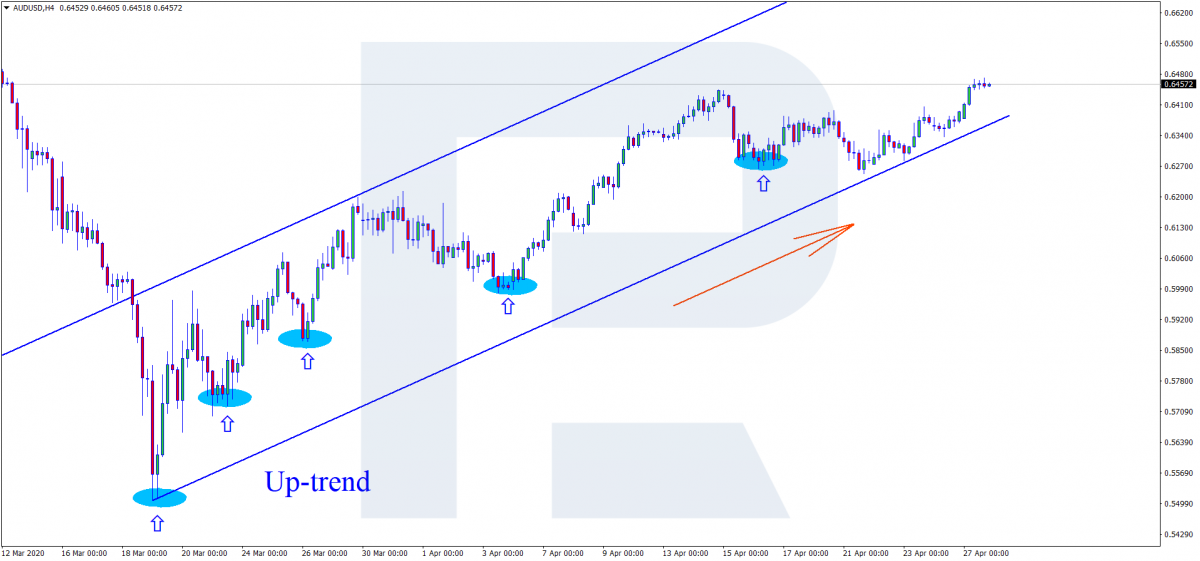
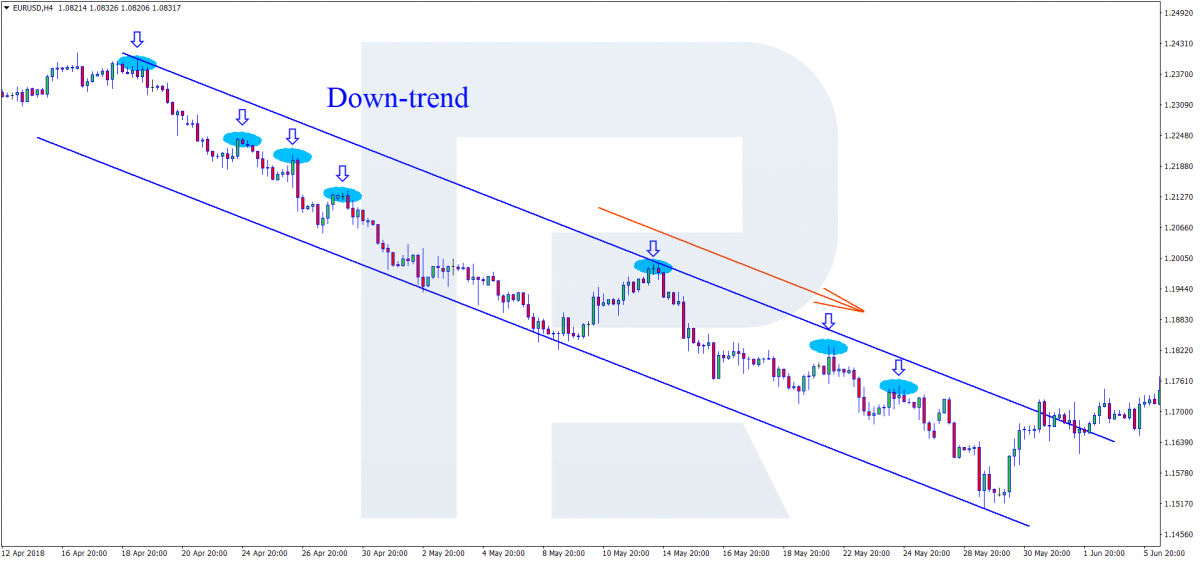
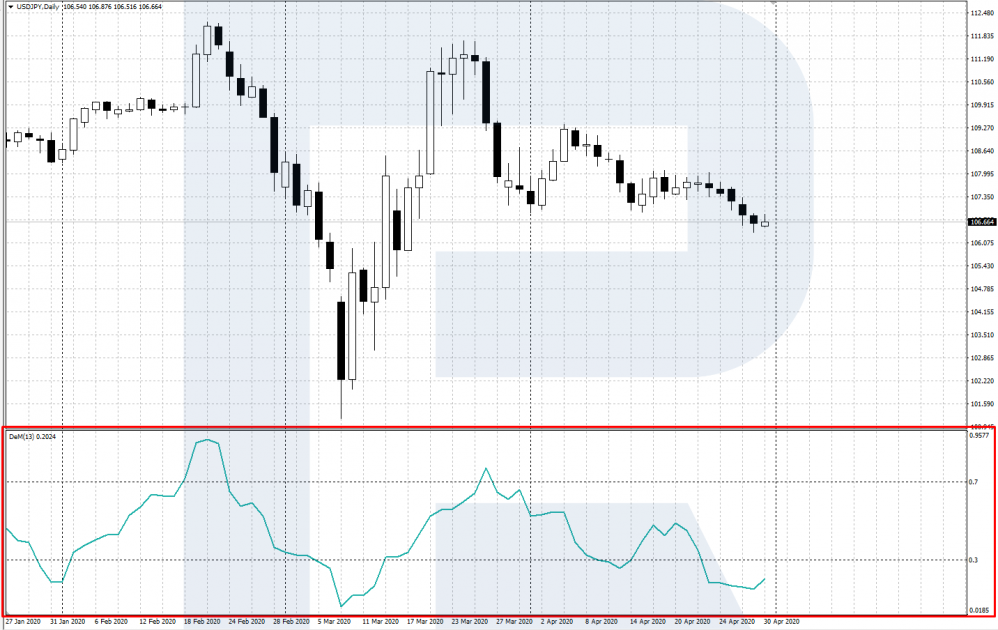
The DeMarker indicator was named after its creator, an outstanding exchange player and the author of many technical indicators Thomas DeMark. The indicator assesses the current state of the prices compared to the previous period, helps to define the market state, and find the place of a possible reversal.

DeMarker belongs to the group of normalized oscillators; its values lie between 0% and 100%; 100% is marked as 1. Unlike many other oscillators, DeMarker pays more attention to intermediate highs and lows rather than closing prices. The algorithm of the indicator compares the current highs and lows on the price chart with the extremes of the preceding period.

Like any other oscillator, DeMarker demonstrates the current state of the market:

  • If the indicator line is growing and demonstrates another high, it indicates an active uptrend and an overbought state of the market.
  • If the indicator line is declining, forming local lows on the chart, there is a downtrend and an oversold state of the market.
The indicator is displayed in a separate window under the price chart; it looks like a line moving between 0 and 1. The area above 0.7 is called the overbought area where a reversal downwards may form. The area below 0.3 is called the oversold area, where we may consider buying. The DeMarker indicator is included in most of the popular trading platforms.

demarker-998x630.png


DeMarker indicator

Calculation formula and settings

To add the indicator to the chart of the chosen instrument in MetaTrader 4 or MetaTrader 5, open it vie the Main Menu: Insert – Indicators – Oscillators – DeMarker.

The algorithm for calculating highs and lows (DeMax and DeMin) is based on comparing the highs/lows of the current period to the highs/lows of the preceding period. If the high of the current candlestick is higher than the preceding one, the corresponding difference is calculated.

If the current high is lower than the previous one or equal to it, the value is zero...

Read more at R Blog - RoboForex

Sincerely,
RoboForex team
 
How to Trade Three-Drive (Three Indians) Pattern?

Author: Maks Artemov

roboforex-header.jpg


Dear Traders,

Today, we will discuss yet another trend strategy called Three-Drive or Three Indians. It may have other names but the idea of the strategy and its signals remains the same.

From the name of the strategy, we may conclude that it is based on technical analysis. This means that to use it successfully, you need to understand the support and resistance levels, the trend, and, perhaps, the classical candlestick analysis.

What do you need to know before using the strategy?

Define the trend

Let us first discuss the main concepts that the trader will need for using this strategy, starting with the trend. A trend is a directed price movement.

It may be of one of three types:
  • Uptrend
  • Downtrend
  • Flat
An uptrend is a directed price movement, in which each next low is higher than the previous one. To put it simply, on the chart, we see the price growing, pulling back at times, looking like a wave with increasing peaks.

up-trend-1-1200x561.png


Uptrend

A downtrend is a directed price movement, in which each high is lower than the preceding one. In this case, the price on the chart also looks like a wave, declining with periodical pullbacks.

down-trend-2-1200x561.png


Downtrend

A flat is a horizontal price movement. In this case, highs and lows remain at more or less the same level. About this movement, we may also say that the price is moving in a horizontal channel.

Read more at R Blog - RoboForex

Sincerely,
RoboForex team
 
RoboForex reduces the minimum lot and the step for trading Indices

roboforex-header.jpg


Dear Clients and Partners,

Starting from May 14th, 2020, RoboForex is reducing the minimum lot and order volume step for trading Indices. Thanks to these innovations, Indices can be traded with lower margin requirements, while orders in the CopyFX platform will be copied with higher accuracy.

New conditions for trading Indices
  • Minimum order volume (lots): 0.01.
  • Minimum order volume step (lots): 0.01.

Reduction of the minimum lot and order volume step is another step in the Company's extensive work aimed to provide its clients with the most competitive conditions for trading Indices in the industry.

Please note that improved conditions for trading Indices may require you to adjust your Expert Advisor settings or review your trading strategies. We kindly ask you to take these changes into account when planning your trading operations.


Sincerely,
RoboForex team
 
Walt Disney and Sony Stocks: Will Entertainment Industry Survive?

Author: Maks Artemov

roboforex-header.jpg


Dear Traders,

There are plenty of companies and corporations in the entertainment sphere, and all of them are noticeable to some extent. However, today I have picked up the companies that are suffering from COVID-19, as many others are, but manage to stay the course. Its The Walt Disney Company (NYSE: DIS) and Sony Corporation (NYSE: SNE).

They are the giants of entertainment, video, and television. Each company has its activity streams but they are united in one sphere - the entertainment industry, in which they are the leaders. Each corporation has its specialties that help not only to survive the crisis but only make a profit in an unstable market situation.

Now, let us consider these companies and their stocks separately and compare the fundamental data to tech analysis. We will try to draw parallels between the corporations and forecast their future market behavior.

The Walt Disney Company

When the quarantine began, many people all over the world stopped going to the cinema and amusement parks; the Walt Disney Company was the one to suffer first, nonetheless, the company found a way out.

Fundamental analysis of Disney

The growth of the number of clients on the streaming platforms somewhat compensates for a lack of them in the amusement parks: from the end of March till the beginning of May 2020, the number of the subscribers of Disney+ online services grew from 33.5 million to 54.5 million, which was a record for the company.

It should be mentioned that the Disney platform is a serious rival to Netflix: it may not harm the latter gravely but will for sure play on the nerves. The reason for which Disney may not push Netflix out of the market is the fact that they have different subscribers.

Switching to online entertainment will help Disney cover up the significant losses that it suffers from the amusement parks and other offline entertainment facilities lying idle. During the last financial year, the income of Disney grew by 20.7% per annum. I think this is a serious promise of future success. These days, many of the company's rivals are struggling to minimize their losses, only dreaming about a profit.

Tech analysis of Disney stocks

On D1, the stocks are restoring their positions after a swift decline. They keep growing with small pullbacks inside an ascending channel and have crossed the EMA50.

Crossing the EMA50 does not mean a trend reversal: while the price is heading for the EMA200, it might be too bold to forecast a change in the trend. However, the development of an uptrend is obvious, and many financial analysts also forecast further growth. I suppose we should agree with them.

The pandemics may slow down the growth a bit, however, I still recommend buying. The aim of the growth is currently $125.00 - $127.00. The price may correct on its way, remaining inside the ascending channel borders.

dis-d1-1-1200x485.png


Sony Corporation

Regardless of the company's specialization being the production of electronic devices and gadgets, Sony is currently a strong rival to Disney. In the sphere of technology, the competition is too tough for Sony but it is trying hard. However, it is doing much better in the sphere of entertainment.

Read more at R Blog - RoboForex

Sincerely,
RoboForex team
 
RoboForex: changes in trading schedule (Memorial Day in the USA and Late May Bank Holiday in the UK)

roboforex-header.jpg


Dear Clients and Partners,

We’re informing you that due to public holidays in the USA (Memorial Day) and the United Kingdom (Late May Bank Holiday), several instruments will be traded according to the changed schedule*.

MetaTrader 4 / MetaTrader 5 platforms

Trading schedule on Metals (XAUUSD and XAGUSD), US indices (US30Cash, US500Cash, and USTECHCash) and CFDs on oil (Brent and WTI)
  • May 25th, 2020 – trading stops at 7:45 PM server time.
  • May 26th, 2020 – trading starts as usual.
Trading schedule on CFDs on US stocks
  • May 25th, 2020 – no trading.
  • May 26th, 2020 – trading starts as usual.
Trading schedule on CFDs on Russian GDRs
  • May 25th, 2020 – no trading.
  • May 26th, 2020 – trading starts as usual.

R Trader platform

Trading schedule on US stocks and ETFs
  • May 25th, 2020 – no trading.
  • May 26th, 2020 – trading starts as usual.
Trading schedule on CFDs on US stocks and ETFs
  • May 25th, 2020 – no trading.
  • May 26th, 2020 – trading starts as usual.
Trading schedule on CFDs on US indices (US500, US30, and NAS100)
  • May 25th, 2020 – no trading.
  • May 26th, 2020 – trading starts as usual.
Trading schedule on CFDs on UK stocks
  • May 25th, 2020 – no trading.
  • May 26th, 2020 – trading starts as usual.
Trading schedule on CFD on UK100 index
  • May 25th, 2020 – no trading.
  • May 26th, 2020 – trading starts as usual.
Trading schedule on Metals (XAUUSD and XAGUSD) and CFDs on oil (WTI.oil, BRENT.oil)
  • May 25th, 2020 – trading stops at 7:45 PM server time.
  • May 26th, 2020 – trading starts as usual.
Please, take into account these changes in schedule when planning your trading activity.

* – This schedule is for informational purposes only and may be changed by the provider.

Sincerely,
RoboForex team
 
Gartley Butterfly Pattern: Indicator and Trading Strategy

Author: Victor Gryazin

roboforex-header.jpg


Dear Traders,

In this review, we will discuss a well-known trading pattern - the Gartley Butterfly. You may learn to find this pattern on the chart by yourself or use the ZUP indicator, specially created for finding and drawing the pattern on the price chart.

Pattern history

The Gartley Butterfly pattern appeared as long ago as 1935 thanks to a famous analyst and tech analysis expert Harold M. Gartley. He specialized in stock market analysis, delivered lectures on tech analysis, and consulted Wall Street traders. In the end, Gartley's tech analysis study course turned into a book called "Profits In the Stock Market", where he first described a pattern that was later named Butterfly.

The Gartley Butterfly became popular a bit later, at the end of the 20th century. Gartley's works were improved by his followers Scott M. Carney and Larry Pesavento. The latter added the Fibonacci levels to the Butterfly to define and classify patterns more precisely. A Gartley Butterfly with perfect Fibo proportions is called the Pesavento Butterfly.

Gartley Butterfly pattern description and trading method

The Gartley Butterfly belongs to harmonic trading patterns - the ones which form by a certain scheme including Fibo levels. The pattern consists of four price movement sections (waves), the second, third, and fourth ones being, in essence, a three-wave correction of the first movement. The pattern got its name because its lines and Fibo levels on the chart look like a butterfly's wings.

The Gartley Butterfly forms on different timeframes; quite often, it acts as a trend continuation pattern for the actual trend on a larger timeframe. The pattern works well with other tech analysis instruments: trendlines, support, and resistance levels. If the pattern forms according to the Fibo relations singled out by Pesavento, it will work off more probably, however, even without them, the pattern is trustworthy.

Bullish Gartley Butterfly

A bullish (buying) pattern looks like an ascending price impulse XA followed by a three-wave correction AB-BC-CD. The pattern roughly looks as follows:

gartley-scheme-buy.png


Read more at R Blog - RoboForex

Sincerely,
RoboForex team
 
Trading the Alligator+Fractals Strategy

Author: Maks Artemov

roboforex-header.jpg


Dear Traders,

Today, we will speak about one of the most popular Forex strategies called Alligator+Fractals. It was designed by a famous market psychologist and successful trader Bill Williams in the 20th century, however, it remains topical nowadays.

Alligator+Fractals belongs to trend strategies, which means it does not work in the times of a flat.

This strategy is multicurrency, however, observations show that it works better on instruments with a small spread, such as most basic currency pairs and metals. With high-volatile instruments, it may give false signals.

You may use any timeframe; however, on smaller ones, signals will be multiple but their quality may worsen. On H4 and longer timeframes, signals will demonstrate better quality but appear more rarely. A trade will be working off for several days if not weeks. The size of Stop Losses on large timeframes may exceed the size allowed by your risk management. However, the profit may be huge compared to the Stop Loss.

The Fractals and Alligator indicators: the base of the strategy

This strategy is based on two indicators designed by Bill Williams and included in most trading terminals by default:

  1. Fractals
  2. Alligator

Fractals indicator settings

The Fractals indicator looks like an arrow above a Japanese candlestick or a bar and points at the price extreme. For a Fractal to appear, the following conditions are necessary:

  • The highs of the two first candlesticks are increasing.
  • The high of the third candlestick is higher than those of the preceding two candlesticks.
  • The highs of the fourth and fifth candlesticks are decreasing gradually.
  • If all the requirements are met, a fractal forms on the extreme.

In the settings, you may only change the color and the width of the line. Other parameters are set.

ris-1-fractals-1200x540.png


Fractals indicator

Read more at R Blog - RoboForex

Sincerely,
RoboForex team
 
RoboForex: changes in trading schedule (Whit Monday)

roboforex-header.jpg


Dear Clients and Partners,

We’re informing you that due to the Whit Monday in several European countries, there will be some changes in the trading schedule*.

MetaTrader 4 / MetaTrader 5 platforms

Trading schedule on CFDs on the German index DE30Cash
  • June 1st, 2020 – no trading.
  • June 2nd, 2020 – trading starts as usual.

R Trader platform

Trading schedule on CFDs on GER30 index
  • June 1st, 2020 – no trading.
  • June 2nd, 2020 – trading starts as usual.
Trading schedule on CFDs on German, Austrian, Danish, and Norwegian stocks
  • June 1st, 2020 – no trading.
  • June 2nd, 2020 – trading starts as usual.
Please, take into account these changes in schedule when planning your trading activity.

* – This schedule is for informational purposes only and may be changed by the provider.

Sincerely,
RoboForex team
 
Back
Top