• Please try to select the correct prefix when making a new thread in this folder.

    Discuss is for general discussions of a financial company or issues related to companies.

    Info is for things like "Has anyone heard of Company X?" or "Is Company X legit or not?"

    Compare is for things like "Which of these 2 (or more) companies is best?"

    Searching is for things like "Help me pick a broker" or "What's the best VPS out there for trading?"

    Problem is for reporting an issue with a company. Please don't just scream "CompanyX is a scam!" It is much more useful to say "I can't withdraw my money from Company X" or "Company Y is not honoring their refund guarantee" in the subject line.
    Keep Problem discussions civil and lay out the facts of your case. Your goal should be to get your problem resolved or reported to the regulators, not to see how many insults you can put into the thread.

    More info coming soon.

Discuss RoboForex.com

General discussions of a financial company
Dear traders!

This week, the ContestFX project, as usual, is waiting for you in the following competitions:

The 136th competition of "Demo Forex" has entered the final stage.
The 371st competition of "Week with CFD" has started today.
505th competition of "Trade Day" will start on 27.07.2022 at 12:00.
419th competition of "KingSize MT5" will start on 28.07.2022 at 20:00.

We remind you that all winners of our demo contests receive prize funds to their real trading accounts, so they could use them to perform trading operations in the Forex market without investing their financial savings.

If you want to be one of them, join us!

Sincerely,
RoboForex Contest
 
Price Channel in Trading: How to Draw and Use

Author: Victor Gryazin

3-1536x662.jpg


Dear Clients and Partners,

This overview is devoted to the use of price channels in trading: what does this term mean? How to find a price channel on the chart? Where to open and close trading positions?

What is price channel

According to a definition from tech analysis, price channel is the fluctuation of the asset price between two parallel support and resistance lines inside the current trend.

In other words, a price channel appears on the chart when the movements of the quotes of a certain asset over a certain timeframe are limited by two parallel lines: one up, one down.

Types of price channel

Depending on the direction of the support and resistance lines, three main types of price channel can be singled out:
  • Ascending price channel: the lines are headed upwards, the market is growing
  • Descending price channel: the lines are headed down, the market is falling
  • Sideways price channel: the lines are horizontal, the quotes fluctuate in a limited range.
pricechannel.png


How trade in price channel

Do you remember the motto of tech analysis? It goes: "Trend is your friend", i.e. one should trade the trend. Finding an active price channel on the chart, the trader does not only see the trend direction but also gets interesting entry and exit points for their positions. Let us get into classic ways of trading price channels.

Trading ascending channels

The channel forms in an uptrend: each new high is above the previous one, and so is each new low. The support line goes through lows — this is the main line of the channel, the trendline. The resistance line goes through the highs. In ascending channels, only buys are valid.

Main ways of trading:

The main thing is that buys are only opened at the support line. The Stop Loss is placed beneath this line. Positions are closed at the resistance line. Trading may go this way while the price remains inside the channel.
When the quotes break through the support line, the ascending impulse is over. The price escapes the channel and reverses. From now on, selling can be considered.

pricechannel-bull.png


Trading descending channels

The channel forms in an active downtrend: each new high is lower than the previous one, and so is each new low. The resistance line goes through the highs — this is the mainline of the channel (the trendline). The support level goes through the lows. Only selling trades may be opened in a descending price channel.

Read more at R Blog - RoboForex

Sincerely,
RoboForex team
 
Dear traders!

This week, the RoboForex company's project called ContestFX offers you the following competitions:

The 137th competition of "Demo Forex" and 372nd competition of "Week with CFD" have just started.
The 506th competition of "Trade Day" will start on 03.08.2022 at 12:00.
The 420th competition of "KingSize MT5" will start on 04.08.2022 at 20:00.

It does not take much effort to participate in our demo contests - all you have to do is go through a simple registration procedure just once and then you'll get access to any chosen competition with just a couple of mouse clicks.

We're looking forward to your joining in and wish you good luck!

Sincerely,
RoboForex Contest
 
How to Trade by Psychological Reversal Strategy

Author: Andrey Goilov

6-1536x662.jpg


Dear Clients and Partners,

Certain traders choose against using indicators in their strategies, considering them lagging. Such traders are sure that all they need for market analysis is the price chart. The price contains all the necessary parameters and factors and represents the behaviour of the mob and major players alike. One only needs to learn how to read and understand charts. Also, some investors think the fact that indicators base in price parameters to be yet one more their drawback.

Pic-1.png


The trade practice called Psychological Reversal presumes using no indicators. It is based in the understanding of the psychology and behaviour of a group of tra ders. It might seem to be similar to the False Breakaway technique but the Psychological Reversal strategy has strict time limits of market entry.

This article explains how to interpret the behaviour of market players correctly in times of strong movements and how to manage risks by the strategy.

What is Psychological Reversal strategy

The trader works on hourly charts. The idea is to look for strong breakaways of levels and expectations of fast price reversals. For example, if the market is in an uptrend, the price breaks through the nearest resistance level with a large candlestick and soon returns — this is a signal to sell.

Some think that most market players place protective orders behind local extremes, hoping for a soon market reversal. As soon as the price reaches these orders, a movement in the opposite direction happens; traders lose, and later the market, indeed, reverses downwards.

Example of buying by Psychological Reversal

On H1 of GBP/USD for 7 February 2022 the price is declining from the high, and the overall movement resembles a downtrend, in which each next high or low is lower than the previous one. The price tests 1.3504 and quickly bounces off it. We mark this level as a strong support area.

Pic-9.png


Then we need to keep an eye on a breakaway of this level and assess the behaviour of market players. The level is broken 21 hour later, after which the price returns to the level on the next candlestick already. This signals a trend correction, which means we may buy.

In this case, the TP is 15 points, equalling the distance from the level to the deepest point of the price decline.

Read more at R Blog - RoboForex

Sincerely,
RoboForex team
 
The Free Float Ratio: Everything Investors Should Know

Author: Maks Artemov

10-1536x662.jpg


Dear Clients and Partners,

There are plenty of indicators and multipliers for analysing public companies. In this article, we’ll talk about one of them, the Free float ratio. We’ll find out the formula for calculating it and describe how investors use it when analysing the market situation.

What the Free float ratio is

The Free float ratio is the quantity of shares available for public trading. They are traded on stock exchanges, are not owned by strategic investors, and are available to retail ones. You can meet other names it goes by – Float or Public Float.

What shares are not included in a Free float calculation?

When calculating the Free float ratio, the following shares are not included:
  • Owned by shareholders, the company’s management and top managers
  • Owned by the state
  • Owned by big investment funds, which are majority shareholders
In addition, limited shares are also not taken into account. For example, shares that were given to an employee as a reward for the merits for a company.

How the Free float ratio is calculated

To calculate the Free float ratio, we need to know the number of free float shares and the total number of shares issued. To make the formula look easy to understand, we’ll denote these parameters as A and B, respectively.

The Free float ratio calculation formula:

Free float = A / B

The ratio can be specified in two formats – in percentage (for example, 50%) or decimal fraction (for example, 0.5).

Let’s say that a company issued 100,000 shares; 51% of them, 51,000, a majority stake, are owned by the management, while the rest 49,000 shares were released for free circulation. In this case, the Free float ratio will be 0.49 or 49%.

The Free float calculation: 49,000 / 100,000 = 0.49

What Free float value is considered optimal?

The optimal Free float value for both traders and investors is in the range of 40–80%. Such volumes of free float shares provide some kind of protection against market fluctuations, increase the instrument's liquidity, and afford an opportunity to buy or sell an asset at any time. In other words, the higher the Free float ratio, the more liquid the instrument is and the more opportunities investors have.

Disadvantages of the low Free float ratio

First of all, small or limited market demand. After buying some shares, a trader might find it difficult to sell them. There is a possibility that there won’t be a buyer in the market to acquire this asset, or its price might be very low.

Secondly, there might be sharp price fluctuations in either direction at a time of news releases, which may cause panic among market players.

Thirdly, buying a vast amount of shares by a single investor might significantly raise the price and cause disbalance. Selling a major minority shareholding can be delayed and it also might result in a price surge. In some cases, shares can’t be sold at all because there are no investors willing to buy them.

How to use the Free float ratio for market analysis

To begin with, the ratio provides an investor with an understanding of an instrument's liquidity. If the ratio value is 40–80%, an instrument is considered quite liquid and involves smaller trading-related risks.

The Free float value above 80% means that it will be difficult for jobbers and big-time investors to cause higher volatility in the market by selling/buying big amounts of shares.

A ratio value below 40% says that the majority of shares are owned by principal shareholders and they have the ability to influence share prices by unloading a lot of shares in the market. Small amounts of free float shares raise additional difficulties for selling them.

Read more at R Blog - RoboForex

Sincerely,
RoboForex team
 
Dear traders!

This week, the ContestFX project invites you to take part in the following competitions:

The 137th competition of "Demo Forex" is gaining momentum.
The 373rd competition of "Week with CFD" has just kicked off.
The 507th competition of "Trade Day" will start on 10.08.2022 at 12:00.
The 421st competition of "KingSize MT5" will start on 11.08.2022 at 20:00.

We remind you that all the winners of our contests receive prize funds to their real trading accounts which they can use to perform trading operations on the Forex market

Take your chance to be one of them!

Sincerely,
RoboForex Contest
 
Electric Cars Increase Demand for Lithium: Which Companies Will Attract Attention?

Author: Eugene Savitsky

2-1536x662.jpg


Dear Clients and Partners,

Brass is the main metal for the global green energy transition. However, there is another metal which is vital for the process, and this is lithium. This article is devoted to this material, primarily used in batteries and energy storage units. Unlike brass quotes, lithium quotes are trading near their all-time highs instead of falling. Over the past two years, lithium prices increased by 1,280%. This article explains what this metal is like and which companies produce and sell it.

Lithium

Lithium is a light, soft alkaline metal of silvery white colour. It is used rather widely, including in chemical electricity sources, metallurgy, electronics, nuclear energy, healthcare, lubricants, space industry, glass industry, etc. The main consumers of lithium are glass industry (29%) and energy (27%).

The main lithium mines are situated in the so-called Lithium Triangle on the territory of Argentina, Bolivia, and Chile. This region holds about 70% of global lithium reserves. The Top 5 list of countries with largest reserves features Bolivia, Argentina, Chile, Australia, and China.

How lithium is mined

There are two ways of mining lithium. The first one is the ore method. It implies construction of a mine or quarrying. The metal itself is produced from pegmatite minerals. The second way is producing lithium from water solution.

The second method costs less: the solution is pumped up to the surface from the depth of several meters. It fills up huge pools and then evaporates under the sun, leaving in the pools a concentrate that is gathered and transported to the plant. There lithium is separated from the white flour, pressed in bricks, and sent to customers.

The second method is only used in countries with dry climate. In many Northern lands this method can hardly be used because water will need to be heated up in the process of gathering lithium, and this implies additional costs. So, only countries with extremely cheap energy carriers can afford this.

What Free float value is considered optimal?

The optimal Free float value for both traders and investors is in the range of 40–80%. Such volumes of free float shares provide some kind of protection against market fluctuations, increase the instrument's liquidity, and afford an opportunity to buy or sell an asset at any time. In other words, the higher the Free float ratio, the more liquid the instrument is and the more opportunities investors have.

What influences lithium prices

As said above, lithium is widely used and has always been in demand. However, the volumes required by the global market used to be much smaller than these days, and lithium companies managed to satisfy the demand fully. The situation changed abruptly when humanity started mass production of electric cars because lithium is used in batteries. So, the metal price started growing at once.

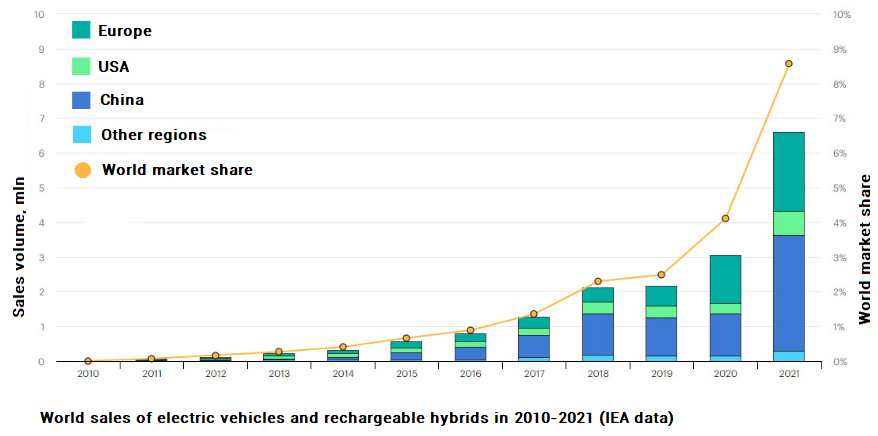
Take a look at the diagram of global sales of electric cars. Since 2014, sales of electric cars have been growing. In 2018 and 2019, sales volumes remained at a more or less equal levels, i.e. there was a minor pause. However, in 2020 and 2021, sales doubled.

sales.png


The dynamics of electric cars sales and lithium prices correlate. Hence, the main demand for lithium is created by the car industry. And the more electric cars appear, the higher becomes the demand for the metal.

Risks and lithium ETFs

The first ones to mention are political risks, i.e. limitations imposes on the business of foreign companies in certain countries, like in Chile. These situations will have a good influence on lithium prices, which means the price might grow after such events, yet the companies that get the limitations imposed on them will suffer a stock price decline. To avoid the risks entailed by investing in one company, investors might consider lithium ETFs, such as Global X Lithium & Battery Tech ETF (NYSE: LIT) or Amplify Lithium & Battery Technology ETF (BATT).

The second risk bases itself in active investments in lithium mining that might make the supply exceed the demand. In this case, lithium quotes will start declining, and companies that have invested in increasing production will fail their financial liabilities because their income will fall.

Read more at R Blog - RoboForex

Sincerely,
RoboForex team
 
Rule 72: What Is It for and How to Use It?

Author: Victor Gryazin

4-1536x662.jpg


Dear Clients and Partners,

This overview is devoted to such a method of assessing investments as Rule 72. We will see how it works and how it can be used.

What is Rule 72

Rule 72 is a simplified calculation method that shows how fast your investments will double if the profitability remains stable. Calculation of complicated percentage (profitability of constant reinvestments) is a really difficult mathematical operation that makes most people grab a calculator. Hence, for less accurate calculations, right on your lap, investors use Rule 72.

By this method, any person can simply count in their mind and fancy the magic of complicated percentage.

If you want to know how much time you will need to double your assets if the interest rate remains set, this Rule is the fastest option. It was for the first time mentioned in the works of an Italian mathematician Fra Luca Bartolomeo de Pacioli.

Calculation formula for Rule 72

The mathematical formula for Rule 72 looks as follows:

T = 72 / R

Where:

T is the time during which the capital be doubled;
R is the interest rate.

When it comes to assessing the errors of such estimations, you get better results when the interest rate is about 8%. Nonetheless, you can feel confident when the interest rate is between 1% and 15%.

When the profitability is higher than this, the calculation becomes too inaccurate. In the end, nothing can be compared to the real calculations of complicated percentage with special calculators.

How to use Rule 72 in finance

There are several main ways of using Rule 72 in finance:
  • Calculation of capital doubling time: the main task of the rule is assessing how many years it will take the capital to grow twice when the yearly interest rate is set (acceptable accuracy is between 1% and 15%).
  • Profitability calculation: the formula can be used vice versa as well, assessing which yearly interest rate is necessary to double the capital over a certain time. For example, to find out which interest rate we need to double the capital in 6 years, you just divide 72 by y = 12%.
  • Assessing inflation influence: it helps to understand how inflation decreases the capital if it just lies idle and brings no profit. For example, let us see how long it will take your savings under the mattress to become 2 times smaller when the yearly inflation is 6%: 72/6 = 12%. 12 years later, if inflation is stable, you will be able to buy twice as less goods and services than now. From some $10,000, you will only have $5,000.
What is the difference between Rule 72, Rule 70, and Rule 69

Apart from Rule 72, you can use Rule 70 and Rule 69 with the same goals. These rules help to simplify calculations or calculate more accurately depending on the period of interest payments.

For example, Rule 69 is most accurate when interest is paid daily. For monthly and annual payments, Rule 72 is normally used. Rule 70 is applicable for the sake of simplicity.

Anyway, each of these rules can be used for fast calculations with a set and relatively low error level. Choose the rule that is better for your goal.

Bottom line

Rule 72 is a simple and comfortable way of calculating the attractiveness of investments right in your mind. This is quite an innacurate way that makes certain errors but gives an opportunity to assess the profitability of investments without going deep in maths.

Read more at R Blog - RoboForex

Sincerely,
RoboForex team
 
Dear traders!

This week, the RoboForex company's project called ContestFX is waiting for you in the following competitions:

The 137th competition of "Demo Forex" has entered the third week.
The 374th competition of "Week with CFD" has just started.
At 12:00, August 17th, 2022, starts the 508th competition of "Trade Day".
At 20:00, August 18th, 2022, starts the 422nd competition of "KingSize MT5".

To take part in our contest, it is enough to go through a simple registration procedure and then any of the chosen competitions will be available to you in just a couple of mouse clicks

We wish good luck to all of you!

Sincerely,
RoboForex Contest
 
Back
Top